Conventional KPCA Approach Applied to Detect Simulated Faults in PV Systems Using Simulated Data
Abstract
Photovoltaic (PV) installations have become integral for harnessing solar energy, yet ensuring uninterrupted power generation remains crucial. This study addresses the challenge of maintaining reliability in PV systems by proposing a method to detect and identify simultaneous faults, using kernel principal component analysis (KPCA) and statistical metrics. The proposed method employs KPCA, a machine learning technique adept at identifying patterns in complex data. By utilizing statistical metrics in a feature space generated by KPCA, potential faults in PV system performance data are flagged. Unlike prior research that focused on single faults, this work extends the application of KPCA to detect and identify multiple faults occurring simultaneously, such as partial shading combined with open or short circuit faults. Through extensive simulations, including 100 samples of different faults under varying irradiance conditions, the method demonstrates high accuracy rates: 93.33% for partial shading, 100% for open circuit, 100% for short circuit, and 81.81% for combinations of partial shading with either open or short circuit faults. Results from a Matlab-Simulink model validate the effectiveness of KPCA in detecting both single and simultaneous faults in PV systems’ DC side.
1. Introduction
According to the international climate agreement approved at the end of COP 21 in Paris (2016), climate problems and the need to reduce greenhouse gas emissions are pushing researchers to find less polluting ways of generating electricity [1]. Another problem is the limited reserves of fossil and fissile energy. This is precisely why renewable energies are considered to have bright potential in the future [2]. Sun is one of the most widely used renewable energy sources, and it serves as a raw material in the production of photovoltaic (PV) energy to generate electricity through PV panels [3, 4]. PV solar energy is a renewable, sustainable, nonpolluting, and inexhaustible energy source that can be used as an alternative to fossil fuels. It plays an important role in the field of research to meet future energy needs [5]. Currently, PV module manufacturing technology has advanced significantly in terms of quality and production costs which are continuously falling over the years, 13% from 2020 to 2021 [6].
Electricity-generating PV systems can be operated in different locations. The outer exposure of the PV panels brings together a complex combination of factors (wind, rain, snow, heat, lightning, shade…) that cause their degradation over time. Consequently, this combination of factors has a negative impact on performance and, therefore, reduces the profit of the installation, without taking into account the maintenance costs to restore the system to function. The operation of PV panels is dependent on meteorological conditions (irradiance, temperature). Understanding the behaviour of PV panels requires an understanding of these phenomena.
To maximize the efficiency of PV conversion and reduce maintenance costs, many solutions have been proposed in the literature. Diagnosis is one of the interesting solutions to operate PV panels at their optimum power and compete with fossil fuel sources for economic reasons. The literature is prolific on the diagnosis of faults in PV systems by different approaches and models electrical and nonelectrical. To perform a system diagnosis, it is necessary to detect, locate, and estimate the amplitudes of the detected defects [7].
The conventional international protection standards [8, 9] that specify safety requirements for PV systems give sufficient guidelines for the AC side of a PV system protection but fail to detect faults on the DC side [10]. According to [10], the DC side of all PV systems must be protected against overcurrent faults, ground faults, and arcing faults with, respectively, overcurrent protection devices, ground fault detection, and interruption fuses, ground fault protection devices, and arc fault circuit interrupters or string level arc fault detectors.
But it has been documented in the literature [11–18] that these protection devices have frequently been unable to identify the corresponding faults in the PV array because of lower fault current amplitudes, maximum power point trackers presence (MPPTs), nonlinear PV characteristics, and its enormous dependence on the irradiance levels. Additionally, even if the system is outfitted with protective systems, any electrical fault occurring on the DC side of a PV system is certain to have a catastrophic impact on the output characteristics, which is often unpredictable and occasionally even burns out the entire system [15, 16]. Considering the above facts on DC side fault detection in this work, we are specifically interested in the detection of defects on the DC side of the PV system, that is, on the PV generator side.
In recent years, several solutions for detecting faults in PV systems have been explored by researchers in this field [19], The following nonelectrical methods might be mentioned: visual examination, mechanical flexion tests, imaging using photoluminescence and e-luminescence to identify cracks in PV cells [20], or even the use of thermal imaging to identify hot spots on PV panels that are malfunctioning [21, 22]. This method is based on the idea that all materials emit infrared radiation across a wavelength range that depends on the material’s temperature. If abnormalities exist, they can be located by examining the temperature distribution at the module level. To these nonelectric methods are added the electrical ones that do not require climate data (such as solar irradiation and temperature), such as the method based on measuring the capacity of the earth [20, 21], to detect the disconnection of a PV module, or the one based on reflectometry [21] to detect a PV module disconnection as well as the impedance change due to degradation, or even the method founded on variance analysis and the use of Kruskal–Wallis’ nonparametric tests. The methods based on satellite data analysis allow to differentiate several types of defects: the constant energy losses (due to degradation, dirt, etc.); the variable energy loss (due to shade, grid disconnections, inverter power limitation, MPP tracking failures, temperature, etc.); and the losses due in particular to snow presence [20]. Methods based on the analysis of the current-voltage (I-V) characteristic: for one of them, the characteristic (dI/dV) − V is used to detect the partial shadow defect in a PV system [21, 22]. The extraction of parameters (serial resistance, STC operating temperature (standard test conditions), maximum power point at STC) allows detection of the defect in a module or string (increased serial resistance between cells or between modules, aging) [23]. Using operating point analysis, an automatic monitoring and detection procedure based on power loss analysis is proposed, which identifies three groups of defects and a false alarm: defective modules in a chain, defective chain, and a group of different defects such as partial shadowing, aging, and MPPT error. [24]. Using power and energy analysis, in [25], the magnitude of the decrease in power produced was assessed. Depending on the drop amplitude and the corresponding operating condition (irradiation and temperature), the number of strings and number of modules per string being defective can then be detected.
Methods based on artificial intelligence (AI) techniques whose effectiveness has been demonstrated in [26]. A method of learning based on expert systems is developed in [27] to identify two types of defects (due to the shading effect and inverter failure). Another method for identifying short-circuit PV modules is presented in [28]. In [29], an ANN is used to classify the different types of defects that occur in a PV network. In this case, the ANN takes as inputs the I-V at the maximum power point, and the temperature of the PV module. Different methods based on the Takagie–Sugeno–Kahn fuzzy rule (TSKFRBS) have been described in the References [30, 31]. Most recently in 2021, deep learning methods were used to improve the accuracy of classification for the detection of different defects on the DC side of the PV network and to eliminate errors due to the manual extraction of different characteristics in other algorithms by Zaki et al. [32]; in fact, it is using a new deep learning convolutive neural network (CNN) for the PV system to gain the advantage of automatic feature extraction, which reduces computing load and increases high classification capacity. Gnetchejo et al. [33] bring a new approach based on kernel principal component analysis (KPCA) for the detection and identification of defects on the DC side of a PV field.
Fault detection can also be done using statistical methods such as EWMA proposed by Harrou et al. [34] in which the authors applied a statistical method EWMA to provide a reliable and efficient solution for FDD in PV systems. The approach can be easily implemented for real-time monitoring and can help to improve the performance and reliability of PV systems. In further researches, Harrou et al. [35] proposed an approach that combines the advantages of ensemble learning (boosting and bagging) with the sensitivity of the double exponentially weighted moving average (DEWMA) chart. The proposed method provides an effective and flexible approach for anomaly detection in the DC side of PV plants. The charts can accurately detect various types of anomalies, including electrical faults and shading, and can be easily implemented for real-time monitoring of PV systems. principal component analysis (PCA) is one of the statistical methods used in [36] where the PCA model is utilized to produce residuals to identify anomalies. Subsequently, these residuals undergo examination through the computation of monitoring schemes (including square predicted error) to detect faults in PV systems. Another statistical method widely used is KPCA with several applications in single fault detection as in [37] where a KPCA-based canonical correlation analysis (CCA) model for quality-related fault detection [34] and diagnosis (QrFDD) for nonlinear process monitoring is proposed. The model uses KPCA to extract the kernel principal components (KPCs) of original variables data to eliminate nonlinear coupling among the variables and then uses CCA to model the relationship between the KPCs and the output. The model also establishes a linear regression model between process and quality variables based on a proportional relationship between the process variables sample and kernel sample. The model is applied to the Tennessee Eastman (TE) chemical process and shows better performance than existing kernel-based CCA methods in terms of algorithmic complexity and interpretability. Okba Taouali, in [38], proposes a new online fault detection method based on the PCA technique. The proposed method is based on reduced KPCA and support vector data description (SVDD). The proposed method is compared with the traditional PCA-based method and the results show that the proposed method has better performance. Also, in [39], the KPCA-stacked denoising autoencoder (SDAE) method is presented for fault detection and diagnosis based on KPCA and SDAE. The proposed method is applied to the fault diagnosis of a gearbox, and the results show that the proposed method has better performance than the traditional PCA-based method. Lajmi in [40] investigates machine learning and control theory approaches for process fault detection. The study compares the performance of KPCA and the observer-based method. The results show that KPCA has better performance in detecting faults in the process. [41] introduces improved deep belief networks (DBNs) that combine with KPCA into a KPCA-CDBNs model. The model is applied to fault detection research of TE and shows higher prediction and stability of fault detection and diagnosis. Furthermore, Jiang in his study [42] proposes a new method of fault detection and diagnosis for nonlinear processes based on KPCA and least squares support vector machine (LSSVM). The fault detection rate (FDeR) and the fault diagnosis rate (FDiR) are used as the evaluation criteria for fault detection and diagnosis. The FDR measures the percentage of faults that are correctly detected, while the FDR measures the percentage of faults that are correctly diagnosed. The article compares the performance of the proposed KPCA-LSSVM model with other methods, such as KPCA-SVM, KPCA-ANN, and KPCA-DBNs, on the TE process. The results show that the proposed model has the highest FDR and FDR in most cases, indicating its superior effectiveness and robustness. [43] uses the fault isolation rate (FIR) as the evaluation criterion for fault isolation. The FIR measures the percentage of faults that are correctly isolated to the corresponding sensors. The article compares the performance of the proposed variable moving window KPCA method with other methods, such as fixed window KPCA, dynamic window KPCA, and adaptive window KPCA, on a simulated distillation column process. The results show that the proposed method has the highest FIR in most cases, indicating its superior adaptability and sensitivity. A self-tuning KPCA-based approach to fault detection is presented in [44] evaluates the effectiveness of the proposed fault detection method by means of tests on emulated and real chiller data. The KPCA approach is first proved to exhibit better detection performances than linear PCA. Recently, a new fault detection and identification method with KPCA and K-means clustering is proposed in [45] by Nahid. The KPCA is first applied to the data for reducing dimensionality, and the occurrence of faults is determined by means of two statistical indices, T2 and Q. The K-means clustering algorithm is then adopted to analyse the data and perform clustering, according to the type of fault. Finally, the type of fault is determined using a long short-term memory (LSTM) neural network. The performance of the proposed technique is compared with the PCA method in early detecting malfunctions on a continuous stirred tank reactor (CSTR) system. [46] Proposes an improved KPCA method for fault detection of nonlinear systems. The method introduces a new index called kernel distance index (KDI) to measure the distance between the test sample and the normal data in the kernel space. The method also uses a dynamic threshold to adjust the sensitivity of fault detection according to the variation of process data. The method is applied to a simulated distillation column system and shows lower false alarm rate than the conventional KPCA method.
Nevertheless, from the above researches, KPCA was used for the detection of isolated or single defaults in many systems, particularly in PV systems. But during PV system operation, defects can occur multiple at a time and produce a cumulative effect. The most likely case that can be considered is shadowing caused by the passage of a cloud that adds to a defect that has already appeared in the PV module. Therefore, we should analyse and highlight the defects involved individually and hence discrimination. In this article, a machine learning method based on KPCA is proposed for the detection of simultaneous faults on the DC side of a PV system. The principle of KPCA is to modify the data from the sensors through a nonlinear application to then transpose it into a higher dimensional space called characteristic space. In this new space, the classic PCA is applied, and the diagnosis is carried out through index testing.
- -
To the knowledge of authors at the time of writing this article, this is the very first time that the directly used KPCA is used for the diagnosis of simultaneous faults in a PV system.
- -
Testing the proposed work on a simulated dataset.
- -
Comparing the proposed method with a number of algorithms to verify its effectiveness based on their integration complexity.
In the second section of this work, we will present the model of a PV cell and a PV field; the KPCA principle for fault detection will be presented in the third section; the fourth section will focus on the application of KPCA for the diagnosis of simultaneous faults in a PV system and the results obtained. The fifth section will be the conclusion, discussion, and limitations of this work.
2. PV System Modelling
2.1. Cell I-V Characteristic
The I-V characteristics of a typical silicon PV cell operating under typical circumstances are displayed in Figure 1. The output I-V of a single solar cell or solar panel (I x V) is what determines how much power they can produce. For a specific radiation intensity, the power curve above can be derived by multiplying all voltages, from short-circuit to open-circuit, point for point.
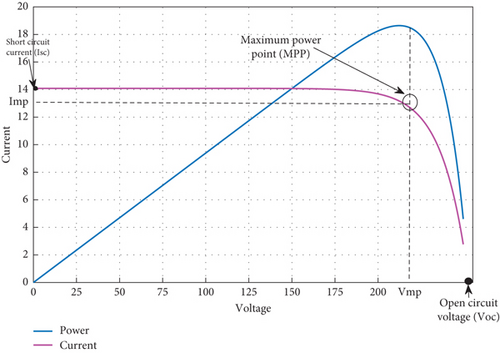
The current will be at its minimum (zero), and the voltage across the cell will be at its maximum when the solar cell is open-circuited, which is not linked to any load. This voltage is known as the solar cell’s open circuit voltage, or VOC. At the other extreme, the voltage across the solar cell is at its minimum (zero), but the current leaving the cell reaches its maximum, known as the solar cell short circuit current, or ISC, when the positive and negative leads are connected together.
The power achieves its peak value for a specific combination of I-Vat Imax and Vmax. The top right corner of the green rectangle represents this, or the location where the cell produces its greatest amount of electrical power Pmax. The MPP stands for “maximum power point.” As a result, the maximum power point is thought to represent the condition in which a PV cell (or panel) operates optimally. We have so far examined the solar cell I-V characteristic curve for a single solar cell or solar panel. However, a PV array is made up of smaller PV panels that are connected to one another. The I-V curve of a PV array is simply a scaled-up version of the I-V characteristic curve of a single solar cell, as shown.
2.2. Fill Factor (FF)
2.3. Cell Model
In this work, we are using an electrical method based on the current-voltage electrical characteristics analysis of the modules under different levels of radiation and different PV cell temperatures. Therefore, the modelling of the PV system have to be done by means of equations that blur different degrees of approximation of the real device. Several electrical models have been proposed in the literature to simulate PV cells operating under various conditions. The complexity of models depends on the number of parameters (RS, RSh…) to be identified. Each model is essentially an improvement to the ideal model that contains a current source representing the incident solar power and a diode representing PN junction. Additional elements can be added to better account for the description of PV cell behaviour in some operating quadrants [48, 49].
The single-diode model is the most widespread one. It is used for PV cells and PV modules due to its simplicity and good precision in the power generation quadrant. The evolution of the single-diode model led to more precise models such as Bishop’s model [50] which describes the behaviour of a PV cell in reverse polarization. The double-diode model allows to improve the single-diode model by taking into account the resistive losses and recombination mechanisms in the different electrical components of the circuit [51, 52]. In addition, dynamic models were proposed by the introduction of a capacity to model the dynamic behaviour of the PV cell [49]. These models differ in the number of parameters necessary for the calculation of the characteristic I-V [53].
Because of its characteristics (simplicity, speed, and accuracy) [33], the single-diode model (Figure 2) was been chosen to model the PV array in this work.
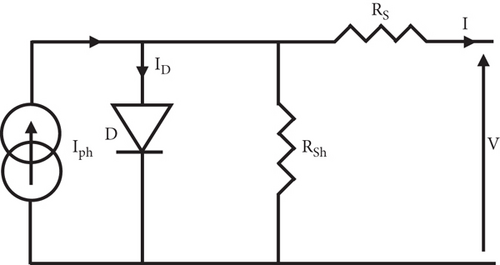
where Iph is the photocurrent, I0 is the saturation current, the ideality factor is n, the Boltzmann constant is K, the electron charge is q, the cell temperature is T in kelvin, the series resistance is RS, and the shunt resistance is RSh.
2.3.1. Photocurrent
This expression does not take into account the effect of wind cooling on the modules. It is therefore essential to make the measurement on the PV array directly with temperature sensors.
2.3.2. Reverse Saturation Current of the Diode
2.4. PV Array Modelling
| Array parameters | Cell parameters |
|---|---|
| I′ph | NpIph |
| I′0 | NpI0 |
| R′s | (Ns/Np)∗Rs |
| n′ | Ns∗n |
| R′p | (Ns/Np)Rp |
3. Principles of Fault Detection by KPCA Principles
3.1. KPCA Principle
PCA is used to diagnose systems for which there is a linear relationship between the data. Its algorithm is expressed in terms of the scalar product. For a nonlinear system, PCA has limitations and does not work properly. Many studies have been done to solve this problem for nonlinear systems using kernel methods. Thus, a nonlinear version of PCA has been developed to overcome these difficulties, namely, KPCA. KPCA is a nonlinear dimensionality reduction technique that operates in a reproducing kernel Hilbert space. It essentially performs PCA in this higher dimensional feature space without explicitly computing the coordinates. The key idea is to project the data into a Hilbert space using a kernel function (such as Gaussian RBF kernel) and then perform PCA in that space to obtain the principal components. This allows KPCA to find nonlinear patterns in the data that normal PCA may miss since it assumes linear relationships. The principal components obtained via KPCA can capture complex nonlinear correlations between process variables. In fault detection, KPCA is first applied to historical normal data to obtain a low-dimensional representation. The principal components are then used to construct a statistical model like one-class SVM to define the boundary of normal operating states. New incoming data is then projected onto the KPCA model space and evaluated against the normal operating boundary. Points outside the boundary would indicate a potential fault requiring further investigation. KPCA provides a more robust representation compared to standard PCA since it can model nonlinear relationships. This improves the ability to detect subtle faults hidden in nonlinear process dynamics. The kernel trick also allows KPCA to be applied to complex high-dimensional data without needing to explicitly compute mappings to the Hilbert feature space. This makes KPCA computationally efficient for online industrial fault detection applications [7].
where α identifies the eigenvector ω after normalisation. The eigenvectors identified in the characteristic space F can be considered as the main components of the kernel that characterize the system [55].
3.2. KPCA-Based Fault Detection
As with linear PCA, three indices (or indicators) are generally used for fault detection using KPCA: the squared prediction error (SPE), the Hotelling statistic T2, and the combined index φ. This fault detection phase is the first step in the diagnostic process.
3.2.1. SPE
A fault is detected on the observation x when the index is above the confidence limit δ2(SPE(x) > δ2),
The confidence limit δ2 can be fixed experimentally or by a theoretical calculation. The calculation of the experimental confidence limit is done by choosing a percentage of the SPE index applied to the fault-free data [7].
3.2.2. Hotelling Index T2
As with the SPE index fault is detected on the observation x when the Hotelling index T2 is above the confidence limit τ2(T2(x) > τ2). Which can also be fixed experimentally or by a theoretical calculation. The calculation of the experimental confidence limit is done by choosing a percentage of the T2 index applied to the fault-free data.
3.2.3. Combined Index φ
δ2 and τ2 are the thresholds of the SPE and T2, respectively. In case of abnormal operation on the observation x, ϕ(x) > ζ2.
For this work, we would make the following assumptions for using KPCA in simultaneous fault detection: KPCA assumes that the data are nonlinearly separable in the original space but linearly separable in the feature space1. This means that the data have some intrinsic structure or manifold that can be captured by the kernel function. KPCA also assumes that the data are stationary and homogeneous, meaning that the underlying distribution and characteristics of the data do not change over time or across different subsets. This may not hold for dynamic or heterogeneous systems, such as PV systems under varying environmental conditions or operating modes. KPCA further assumes that the data are independent and identically distributed, meaning that each observation is drawn from the same probability distribution and does not depend on any other observation. This may not be true for correlated or sequential data, such as time series or spatial data.
4. Application of KPCA for Simultaneous Fault Detection in a PV System
One of the difficulties in PV system fault detection is that many faults may emerge at the same time. This type of issue is known as simultaneous fault detection. Another problem is acquiring a high number of simultaneous fault parameters for the diagnostic system since the number of training data is determined by the combination of distinct single faults. The aforementioned issues might be overcome by using KPCA for simultaneous fault detection in a PV system. The detection principle is based on the analysis of the I-V characteristic in normal operation. From the actual measured data (temperature and irradiance), the current-voltage characteristic ([Iest, Vest]) is estimated from Equations (6), (20), (21), and (22), and this forms the basis for training the data (normal operation). The actual characteristic ([Imes, Vmes]) of the PV field is measured from the current and voltage sensors (see Figure 2). Both the actual data ([Imes, Vmes]) and the estimated data ([Iest, Vest]) after being centred and reduced are evaluated by the KPCA and projected into a high-dimensional feature space. In this feature space, two index tests: the Hotelling statistic (T2) and the SPE index are applied for defect detection and identification.
4.1. Simulink Model of the PV System
The system considered for the simulation is composed of 3 strings in parallel, each consisting of 4 modules (of 36 cells each) in series as shown in the figure below. The electrical characteristics of the PV module (Sun Power SPR-300-WHT-D) used are also presented in Table 2.
| Maximum power (Pmax) | 300 W |
| Power tolerance | ±5 W |
| Open circuit voltage (Voc) | 64 V |
| Voltage at maximum power point (Vmax) | 54.7 V |
| Short circuit current (Isc) | 5.87 A |
| Current at maximum power point (Imax) | 5.49 A |
| Temperature coefficient of Isc: α (mA/K) | 3.5 |
| Temperature coefficient of Voc: β (mV/K) | −176,6 |
| Temperature coefficient of Pmax: γ (%/K) | −0.38 |
| Number of cells in series | 96 |
The elements in red are those on which the different defects are simulated.
4.2. Method Flowchart for Simultaneous Fault Detection
By comparing these errors with the threshold values, we were able to identify the fault symptoms illustrated in the flowchart shown in Figure 3.
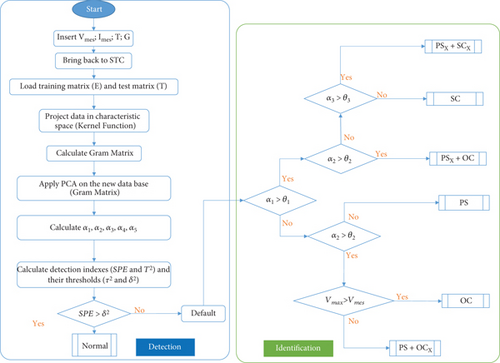
4.3. Simulation Results
For the experimental purpose, Figure 4 made in the Matlab/Simulink platform was used to collect the data on the I-V characteristic. We first obtained the characteristics of the single defects shown in Figure 5
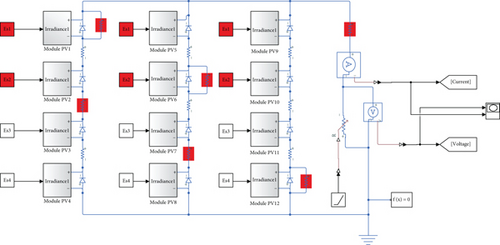
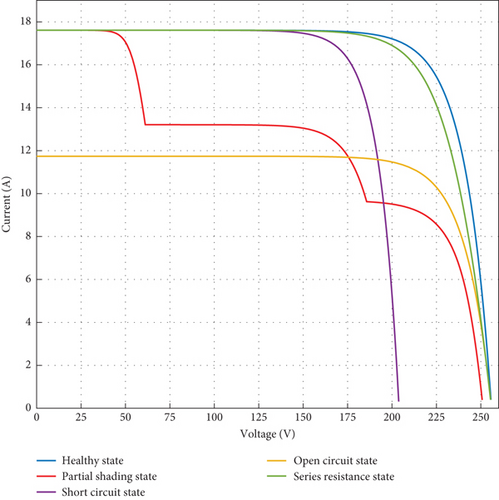
Figure 5 shows the various operating configurations of our solar PV array, including healthy operation (blue curve), partial shading operation or the presence of an opaque element between the light source and the module (red curve), bypass diode degradation operation or short circuit operation (purple curve), operation due to the disconnection of one or more modules or open circuit operation (yellow curve), and operation due to connection degradation, corrosion, or serial resistance (yellow curve) (green curve). For this purpose, we simulate the different single faults listed above and then collect the current-voltage characteristic and system index test from each simulation.
4.3.1. Single Fault Simulation Results
4.3.1.1. Simulation Result for Normal Operating State
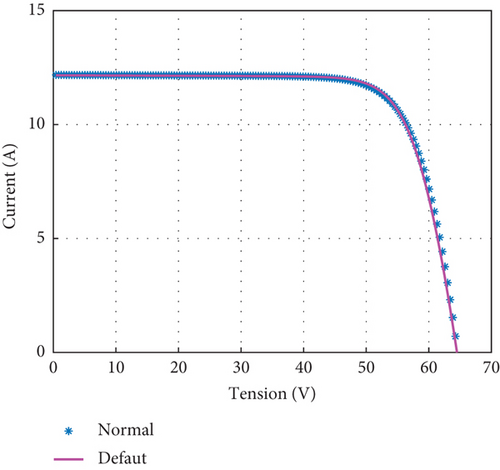
Figure 6(a) shows the I-V characteristics during normal operation of the system. In this case, the estimated data shown in blue coincide with the measured data shown in pink.
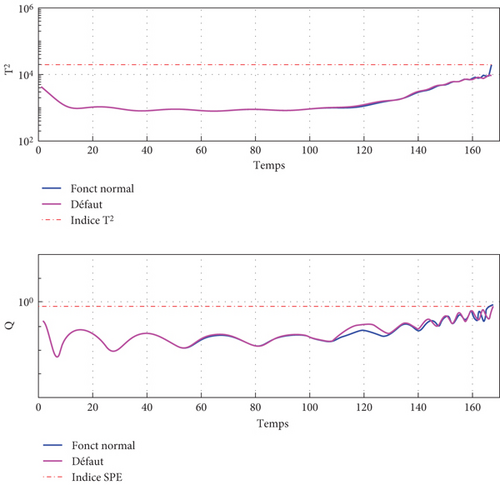
The index and threshold curves in normal operation are shown in Figure 6(b). These two index curves (estimated and measured) are overlaid and below the limit (in red): This shows the absence of a fault.
4.3.1.2. Simulation Result for Partial Shading
Figure 7(a) shows the I-V characteristic when a PV is partially shaded. It can be seen that the distortion of the original curve is mainly due to the activation of the diodes placed in parallel with the PVs concerned. The index and threshold curves for normal and faulty operation are shown in Figure 7(b).
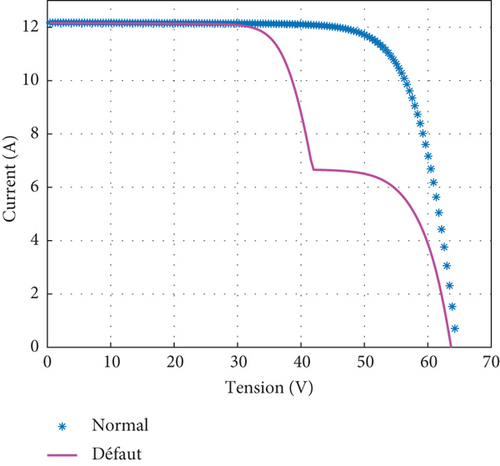
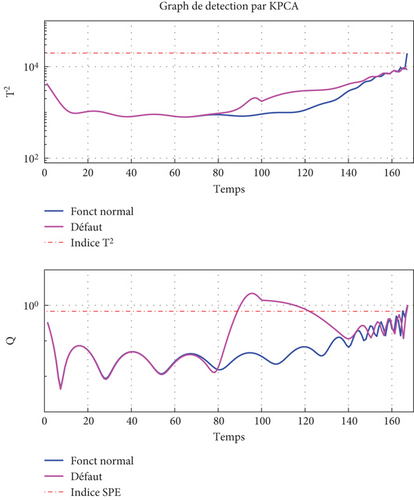
We can observe between the instants (80 and 140), a dissimilarity between the measured and estimated data. It can also be seen that the SPE index threshold was crossed during this interval: This indicates the presence of defect.
4.3.1.3. Simulation Result for Short Circuit
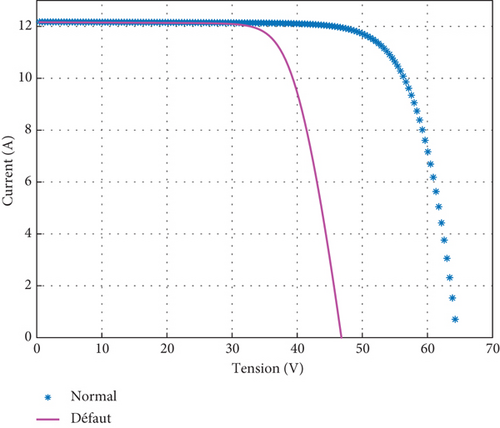
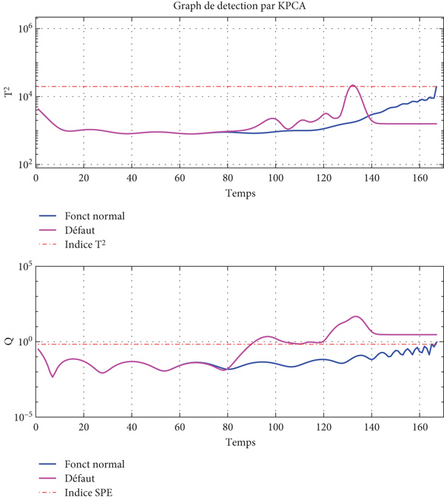
Figure 8(a) shows the state of the system when a PV is short-circuited. There is a decrease in the open circuit voltage, which will also reflect a decrease in the total power of the system. On the index and threshold curves in Figure 8(b), there is a dissimilarity between the measured data and the estimated from time 80. This dissimilarity leads to an overflow of the index thresholds SPE and T2 thresholds at times 90 and 110, respectively.
4.3.1.4. Simulation Result for Open Circuit
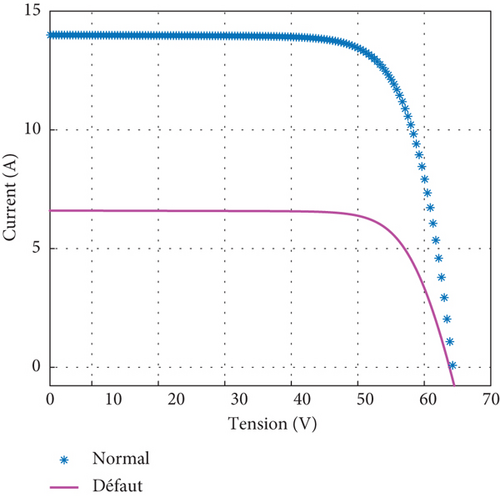
The I-V characteristic of the system when a PV is open is shown in Figure 9(a). A considerable decrease in the short-circuit current and also a slight decrease in the slope can be observed; this leads to a reduction in power. A dissimilarity can be seen in the T-curve over the whole data set (Figure 9(b)): this is explained by the decrease in short-circuit current and the slope of the characteristic. The SPE index overflows from the initial to time 120, which represents the beginning of the slope.
4.3.2. Simultaneous Fault Simulation Results
Since simultaneous faults are the case when single defects are superimposed at a time and produce a cumulative effect, from the different single faults we can obtain simultaneous one by combination. Table 1 represents a fault combination matrix based on the three simple defects presented above, namely, partial shading, short circuit, and open circuit.
From Table 3, we can see that we can have the following combinations: partial shading-short circuit (PS-SC); partial shading-open circuit (PS-OC), and short circuit-open circuit (SC-OC). Given the size of the database (3600 data) and the limited characteristics of the computer used to simulate, we will present only the results of PS-SC and PS-OC.
| Normal state | Partial shading | Short circuit | Open circuit | |
|---|---|---|---|---|
| Normal state | ||||
| Partial shading | V | V | ||
| Short circuit | V | V | ||
| Open circuit | V | V |
4.3.2.1. Simulation Result for PS-SC
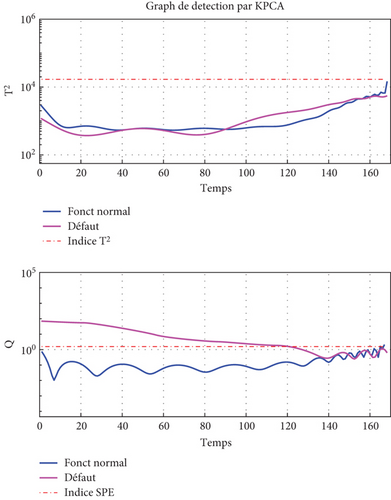
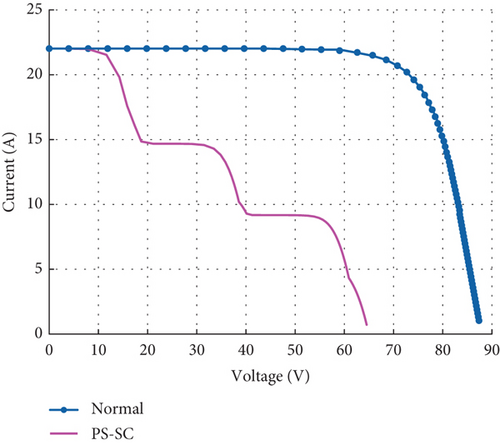
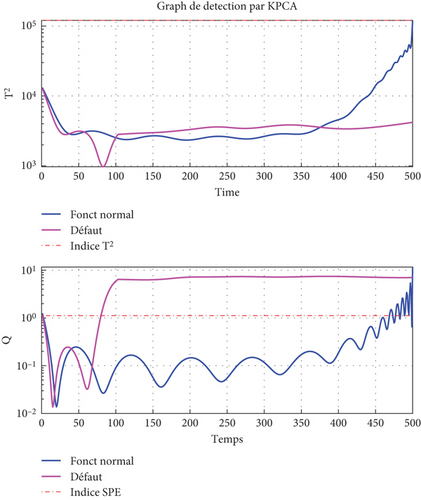
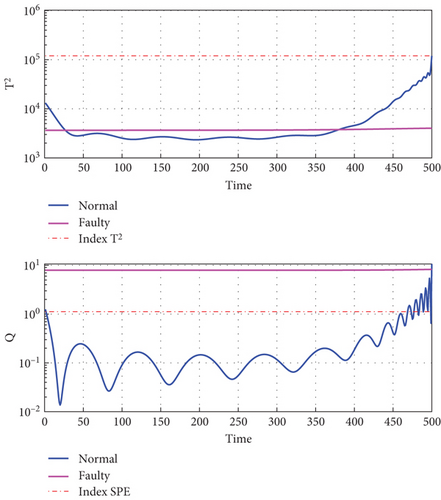
Figure 10(a) shows the state of the system when a PV is partially shaded and short-circuited. There is a decrease in the open circuit voltage, which will also reflect a decrease in the total power of the system. On the index and threshold curves in Figure 10(b), there is a dissimilarity between the measured data and those estimated from time 50. This dissimilarity leads to an overflow of the index threshold T2 from time 100 to 375 and for the index threshold SPE the overflow start at time 75 to the end.
4.3.2.2. Simulation Result for PS-OC
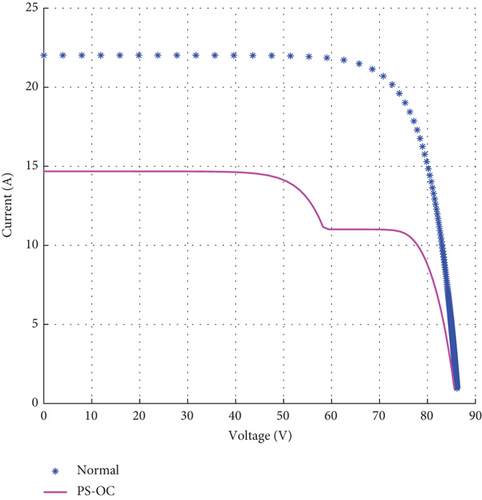
A partially shaded and opened-circuit PV system is illustrated in Figure 11. There is a decrease in the short circuit current, which will also reflect a decrease in the total power of the system. On the index and threshold curves in Figure 11(b), there is a dissimilarity between the measured data and those estimated from time 00. This dissimilarity leads to an overflow of the index thresholds SPE and T2 thresholds from the beginning and converges to the characteristic in the normal state.
4.3.3. Severity Analysis
4.3.3.1. Graphical Severity Analysis
For the two simultaneous faults presented above, we will analyse their severity graphically according to two parameters: Current (I) and voltage (V). The faults are applied on a PV array composed of 3 strings in parallel, each consisting of 4 modules (of 36 cells each) in series as shown in Figure 4. Table 4 shows the different combinations of simultaneous faults for severity analysis.
| Description | Severity | |
|---|---|---|
| PS | Partial shading | / |
| SC | Short circuit | / |
| OC | Open circuit | / |
| PS1-OCX | ||
| PS1-OC1 | Partial shading - open circuit | 3 modules shaded – 1 string opened |
| PS1-OC2 | Partial shading - open circuit | 3 modules shaded – 2 strings opened |
| Psx-oc1 | ||
| PS1-OC1 | Partial shading - open circuit | 3 modules shaded – 1 string opened |
| PS2-OC1 | Partial shading - open circuit | 6 modules shaded – 1 string opened |
| PS3-OC1 | Partial shading - open circuit | 9 modules shaded – 1 string opened |
| PS1-SCX | ||
| PS1-SC1 | Partial shading - short circuit | 3 modules shaded – 1 string shorted |
| PS1-SC2 | Partial shading - short circuit | 3 modules shaded – 2 strings shorted |
| PS1-SC3 | Partial shading - short circuit | 3 modules shaded – 3 strings shorted |
| Psx-sc1 | ||
| PS1-SC1 | Partial shading - short circuit | 3 modules shaded – 1 string shorted |
| PS2-SC1 | Partial shading - short circuit | 6 modules shaded – 1 string shorted |
| PS3-SC1 | Partial shading - short circuit | 9 modules shaded – 1 string shorted |
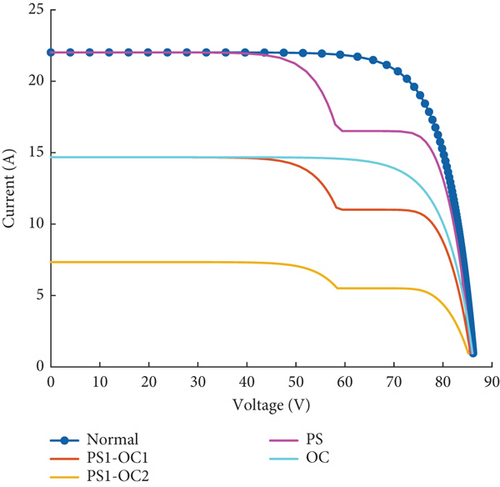
Figure 12 shows I-V characteristics in the cases where the PV array is partially shaded on 3 modules and the severity of the Open Circuit fault is increased from 1 string to 2 strings opened. Then we can observe that when the Partial Shading fault severity is fixed and the Open circuit fault severity is increasing, the open-circuit voltage varies slightly from 85.0 to 86.1 V in this case. Maximum power (MP) in turn decreases as the severity of the open circuit fault increases. Similarly, the short-circuit current decreases from 22.0A in normal state to 7.3A as the severity of the open-circuit fault increases. Also, we can observe that the curve keeps the same shape for the same severity of partial shading and an increase in open circuit fault severity; however, one sudden change at 58 V can be identified.
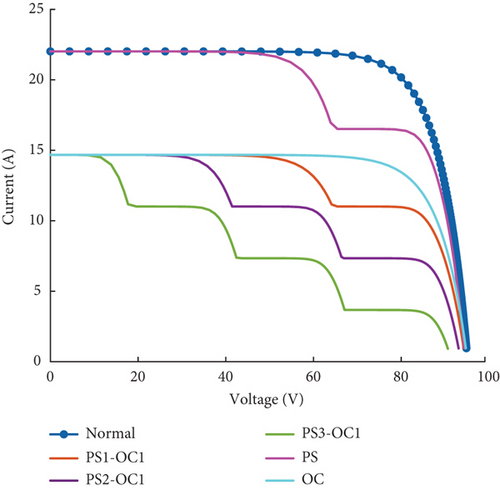
In Figure 13, I-V characteristics in the cases where the PV array is opened on one string and the severity of the partial shading fault is increased from 3 modules to 9 modules shaded is presented. In such a situation, we observe that when the partial shading fault severity is increasing and the open circuit fault severity is fixed, the open-circuit voltage ranges between 83.1 and 86.1. In this case, MPP decreases as the severity of the partial shading fault increases. The short-circuit current remains fixed at 14.6A as the severity of the open-circuit fault is fixed but lower than the short-circuit current at the normal state of 22.02 A. We can also observe that the curves are not keeping the same shape for the same severity of open circuit fault and an increase in open circuit fault severity; with the number of sudden changes increasing with the partial shading severity (one sudden change for 3 modules shaded, two for 6 modules shaded, and three for 9 modules shaded). We can observe these sudden changes, respectively, at 16.0 V, between 37.6 and 38.5 V and between 58.2 and 60.9 V.
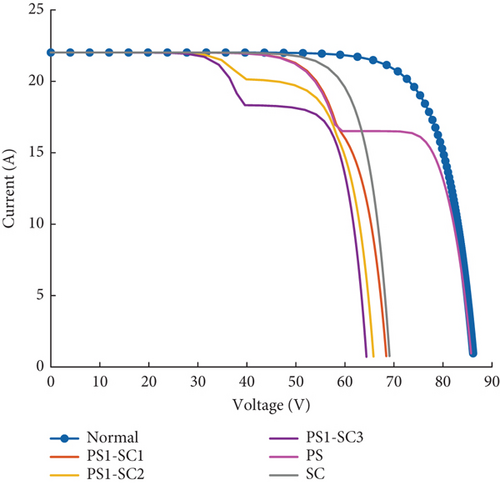
In the cases where the PV array is partially shaded on 3 modules and the severity of the Short Circuit fault is increased from 1 string to 3 strings Shorted, we can see that when the Partial Shading fault severity is fixed and the Short circuit fault severity is increasing, the open-circuit voltage is decreasing sharply from 86.1 at normal state to 64.3 V for 3 Strings shorted. In this case, MPP decreases as the severity of the Short circuit fault increases. The short-circuit current is the same with the normal state 22.02A as the severity of the partial shading fault is fixed. We can also observe that the curves aren’t keeping the same shape for the same severity of the partial shading fault and an increase in short circuit fault severity; with one sudden change each time. We can observe these sudden changes, respectively, at 17.02, 20.1, and 18.3 V for the 3 severities illustrated in Figure 14.
The cases where the PV array is shorted on 1 string and the severity of the Partial Shading fault is increased from 3 modules to 9 modules shaded show that when the partial shading fault severity is increasing and the short circuit fault severity is fixed, the open-circuit voltage decreasing sharply from 86.1 at normal state to 64.3 V for 9 modules shaded. In this case, MPP decreases as the severity of the partial shading fault increases. The short-circuit current remains fixed at 22.02A as the severity of the open-circuit fault is fixed and the same as the short-circuit current at normal state. We can also observe that the curves aren’t keeping the same shape for the same severity of short circuit fault and an increase in partial shading fault severity; with the number of sudden changes increasing with the partial shading severity (One sudden change for 3 modules shaded, two for 6 modules shaded and three for 9 modules shaded). We can observe these sudden changes, respectively, at 14.8 V, in between (40.3–40.1) V and between 58.2–60.7 V. The three severities are illustrated in Figure 15.
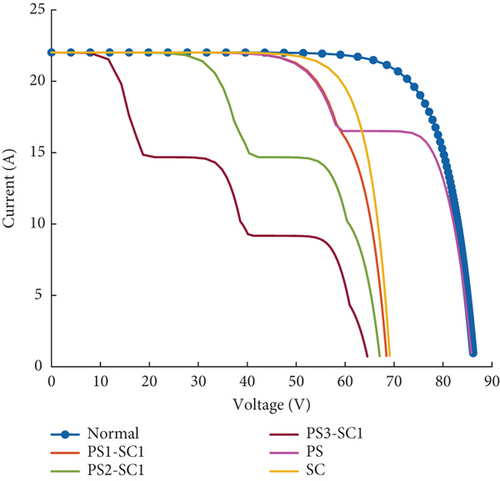
4.3.3.2. Matrix of Fault Signatures
The above severity analysis based on I-V curves gives a graphic description of simultaneous faults but does not completely identify those fault characteristics nor severities. So for a further analysis in other to give the above singles and simultaneous faults identity let us analyse them according to 5 parameters, namely,
Vmax: maximum voltage
Imax: maximum current
Pmax: maximum power
ISC: short circuit current
VOC: open circuit voltage
By analyzing the direction of change of these various parameters in relation to the values in normal operation, we have been able to establish a characteristic vector for each isolated or cumulative fault evaluated above. Taking healthy operation as a basis, we have been able to establish, for example, that in the case of the partial shading fault, the maximum voltage increases, while the maximum current decreases, as does the MP, while the short-circuit current and the open-circuit voltage remain equivalent to the values in normal operation. For an increase with respect to the healthy operating value, we have set the parameter to 1, for a decrease we have set the parameter to −1 and for equivalence with the healthy operating value we have set the value to 0. Hence, the following table summarises the different vectors corresponding to the different faults. Table 5 shows the matrix of fault signatures.
| State | Vmax | Imax | Pmax | ISC | VOC |
|---|---|---|---|---|---|
| Normal | 0 | 0 | 0 | 0 | 0 |
| PS | 1 | −1 | −1 | 0 | 0 |
| OC | 0 | −1 | −1 | −1 | 0 |
| SC | −1 | 0 | −1 | 0 | −1 |
| PS-OC | 1 | −1 | −1 | −1 | 0 |
| PS-OCX | 1 | −1 | −1 | −1 | 0 |
| PSX-OC | −1 | −1 | −1 | −1 | −1 |
| PS-SC | −1 | −1 | −1 | 0 | −1 |
| PS-SCX | −1 | −1 | −1 | 0 | −1 |
| PSX-SC | −1 | −1 | −1 | 0 | −1 |
We obtain this table after 20 repeated tests for each trial. To obtain this table, we analyse the direction of change of each parameter for the different faults. Table 5 shows the analysis of 5 parameters from the [Vmax, Imax, Pmax, ISC, VOC], and we were able to identify and distinguish by characteristic vectors the faults of partial shading, short circuit, open circuit, partial shading associated with open circuit, and partial shading associated with short circuit. We were also able to establish the distinction at the level of severity of the association partial shading open circuit. In fact, for a system affected by the partial shading open circuit association and for which the severity of the open circuit fault is greater, we obtain the vector [1, −1, −1, −1, 0]; whereas in the opposite case, we have a different vector [−1, −1, −1,−1, −1]. Unfortunately, this method is not able to identify the severity of the association between partial shading and short circuit faults. To come through this, we introduced the analysis of a sixth parameter namely FF.
4.3.3.3. Severity Analysis Based on FF
The FF is the ratio of the maximum electrical power to the product of the short-circuit current and the open-circuit voltage. The FF ratio for normal state is between [0.75-0.79]. A FF<0.75 means that the system is affected by a fault. Analyzing the FF our different simultaneous faults, we obtain Table 6.
| Simultaneous fault | FF ratio |
|---|---|
| Normal | 0.7725 |
| PSX-OCX | |
| PS1-OC1 | 0.6443 |
| PS1-OC2 | 0.6476 |
| PS2-OC1 | 0.4713 |
| PS2-OC2 | 0.4785 |
| PS3-OC1 | 0.3246 |
| PS3-OC2 | 0.3285 |
| PSX-SCX | |
| PS1-SC1 | 0.7190 |
| PS1-SC2 | 0.7043 |
| PS1-SC3 | 0.6770 |
| PS2-SC1 | 0.5316 |
| PS2-SC2 | 0.4870 |
| PS3-SC1 | 0.3457 |
| PS3-SC3 | 0.3475 |
The true positive ratio (TPR) given by Equation (30) is then evaluated to establish the accuracy of the method used. One hundred samples of different faults at different irradiance have been generated between an irradiance from 50 to 1000 w/m2. The accuracy rate was 93.33% for partial shading, 100% for open circuit, 100% for short circuit, 81.81% for PS-OC, and 81.81% for PS-SC. The various results obtained from a Matlab-Simulink model demonstrate the efficiency and performance of the proposed algorithms.
4.3.3.4. Comparison With Existing Methods
- -
Execution time
- -
Number of iterations
- -
Number of parameters (Weight, learning rate…)
- -
Training/adjustment required
| Methods | Detection method | Number of defects | Type of fault detected |
|---|---|---|---|
| Proposed | KPCA | 5 | Single + simultaneous faults |
| Koloko et al. [57] | Metaheuristic | 3 | Single faults |
| Gnetchejo et al. [33] | KPCA | 5 | Single faults |
| Fhadel et al. [58] | PCA | 1 | Single faults |
| Harrou et al. [34] | Statistical | 4 | Single faults |
| Dhimish et al. [59] | Artificial neural network | 3 | Single faults |
KPCA is a powerful technique for identifying patterns in high-dimensional data. Its application in detecting both single and simultaneous faults indicates versatility. The medium integration complexity suggests a reasonable balance between computational demand and effectiveness. By capturing various fault scenarios, this method offers a comprehensive approach to fault detection in PV systems. Koloko et al. proposed a Metaheuristic approaches that offer flexibility and robustness in handling complex optimization problems. While effective in detecting single faults, the high complexity may pose challenges in real-time implementation. However, the focus on a smaller number of defects may streamline integration efforts, albeit at the cost of potentially overlooking less common faults. Gnetchejo et al. utilize KPCA for single-fault detection. This suggests the efficacy of KPCA in identifying faults in PV systems. The medium integration complexity implies a feasible implementation, although it might require careful parameter tuning for optimal performance. Fhadel et al. study PCA a simpler variant of KPCA, which focuses on capturing variance in data without the kernel trick. While effective for detecting single faults, the limitation to only one defect may restrict its applicability in scenarios involving multiple faults. However, its simplicity facilitates easier integration, making it suitable for less complex fault detection tasks. Harrou et al. Used a statistical method offering a straightforward approach to fault detection, leveraging mathematical models and algorithms. While effective for identifying single faults, the limitation to single faults may restrict their applicability in scenarios involving simultaneous faults. Dhimish et al. provide an ANN powerful tool for fault detection due to their ability to learn complex patterns from data. However, their very complex integration complexity indicates potentially high computational demands and intricate implementation requirements. While effective for detecting single faults, the focus on a smaller number of defects may limit its applicability in scenarios involving multiple faults.
In conclusion, each method offers unique advantages and trade-offs in terms of fault detection capabilities, computational complexity, and integration feasibility. The choice of method should align with the specific requirements and constraints of the PV system being monitored.
5. Conclusion
In this study, we employed KPCA on PV panel current-voltage characteristic data to diagnose the operational status of a PV array under normal and faulty conditions. By utilizing two key index tests, namely the Hotelling (T2) statistic and the SPE index, we were able to differentiate between three operational states: normal operation, PV partially shaded with an open circuit, and PV partially shaded with a short circuit. Our findings demonstrate the efficacy of this method in identifying cumulative faults within a PV system. Given the advancements in I-V data logging systems and the simplicity of the detection algorithm, our proposed approach can be readily implemented on basic microcontrollers.
However, there are certain limitations to simultaneous fault detection using KPCA. KPCA, being a nonlinear technique, relies on a kernel function to map data into a higher-dimensional feature space. Selecting an appropriate kernel function and its parameters is nontrivial and can impact KPCA’s performance. Additionally, KPCA is sensitive to outliers and noise in the data, which may distort principal components and reduce fault detection accuracy. Furthermore, KPCA operates as a batch method, necessitating the entire dataset to be available prior to analysis, which may hinder its suitability for online or real-time fault detection, particularly with large-scale or streaming data. Therefore, a future work must focus on preprocessing techniques such as filtering, scaling, employing deep learning methods or incremental and adaptive versions of KPCA to enhance data quality and address those limitations. Although the algorithm proposed in this paper is capable of detecting and identifying two simultaneous faults using simulated data, an experimental validation to demonstrate its efficiency and performance should be also the aim of a further work.
Nomenclature
-
- α
-
- temperature coefficient of the short circuit current
-
- φ
-
- combined index
-
- AC
-
- alternative current
-
- AI
-
- artificial intelligence
-
- ANN
-
- artificial neural network
-
- CNN
-
- convolutional neural network
-
- DC
-
- direct current
-
- DEWMA
-
- double exponentially weighted moving average
-
- Eg
-
- initial energy
-
- EWMA
-
- exponentially weighted moving average
-
- FF
-
- fill factor
-
- FP
-
- fault positive
-
- G
-
- irradiance received by the PV cell
-
- GSTC
-
- irradiance at the standard test condition
-
- I
-
- output current of the solar cell
-
- I0
-
- saturation current of the diode
-
- I0,ref
-
- saturation current of the diode given by the manufacturer
-
- Iest
-
- estimated current
-
- Imax
-
- current at maximum power point
-
- Imes
-
- measured current
-
- Iph
-
- photo-current of the solar cell
-
- Iph,STC
-
- photo-current of the solar cell at STC
-
- ISC
-
- short-circuit current of the diode
-
- I-V
-
- diode current–voltage characteristic
-
- K
-
- Boltzmann constant
-
- KPCA
-
- kernel principal component analysis
-
- MPPTs
-
- maximum power point trackers
-
- n
-
- ideality factor
-
- N p
-
- number of cells connected in parallel
-
- N s
-
- number of cells connected in series
-
- NOCT
-
- normal operating cell temperature
-
- OC
-
- open circuit fault
-
- PCA
-
- principal component analysis
-
- Pmax
-
- maximum power
-
- PS
-
- partial shading fault
-
- PV
-
- photovoltaic
-
- q
-
- electron charge
-
- RS
-
- series resistance
-
- RSh
-
- shunt resistance
-
- SC
-
- short circuit fault
-
- SPE
-
- squared prediction error
-
- STC
-
- standard test conditions
-
- T2
-
- Hotelling statistic index
-
- Ta
-
- ambient temperature
-
- TC
-
- PV cell temperature
-
- TC,STC
-
- PV cell temperature at STC
-
- TP
-
- true positive
-
- TPR
-
- true positive ratio
-
- Vest
-
- estimated voltage
-
- Vmax
-
- voltage at maximum power
-
- Vmes
-
- measured voltage
-
- Voc
-
- open-circuit voltage
Conflicts of Interest
The authors declare no conflicts of interest.
Funding
No funding has been received for the study.
Open Research
Data Availability Statement
All data are available on the following link: https://drive.google.com/file/d/1955R0uZet9ov0KUrnAisT8HLCN8SVdZx/view?usp=sharing.


