Heat Transfer Performance Tests of a Circular-Fin Sodium-to-Air Heat Exchanger for Sodium-Cooled Fast Reactors
Abstract
Shell and tube-type crossflow heat exchangers with circular fins are widely used in various industries, including nuclear power plants. This study focuses on the sodium-to-air heat exchanger, which is one of the key safety features in sodium-cooled fast reactors. Tube alignment inside the heat exchanger is important because it directly determines the performance. Although heat exchangers are generally designed to have staggered tube alignment, inevitable inline-aligned zones exist. Therefore, this paper proposes a hybrid tube alignment modeling approach that considers both staggered and inline tube heat transfer phenomena. The results of the hybrid model calculations are verified and validated with liquid sodium experiments. The hybrid approach to the tube arrangement reduced the temperature deviation between experimental and calculated values to a difference of 4.55% and 7.38% for both sodium and air sides, respectively, while for the heat transfer, the difference was 15.12% and 9.06% for sodium and air sides, respectively. The results of this study can also be used as a basis for the safety evaluation of nuclear reactors and licensing processes for sodium-cooled fast reactors. In addition, this study is limited not only to sodium heat exchangers but also to any serpentine tube arrangement or crossflow heat exchanger under high-temperature systems, such as concentrated solar power and thermal energy storage industries.
1. Introduction
Crossflow heat exchangers with circular fins are among the most common single-phase heat transfer components and are widely used in various industries, including nuclear power plants. The nuclear power industry now prioritizes higher efficiency with a compact design in addition to safety. For both safety and efficiency, the key component is the heat exchanger. Conventional nuclear power plants use steam generators and employ water as a coolant. However, recently developing Generation IV reactors use various fluids to transfer heat. One of the most promising designs is a sodium-cooled fast reactor (SFR) [1, 2].
Although the designs of SFR differ, they generally have various heat exchangers that can be categorized by the coolants such as sodium-to-sodium, sodium-to-water, and sodium-to-air types [3]. The sodium-to-air heat exchanger is directly related to the safety of the overall plant [4–12]. However, the heat transfer characteristics of air are relatively unfavorable compared to those of liquid sodium. Many researchers have attempted to enhance the heat transfer rate through various designs while maintaining cost competitiveness. One such solution is a heat exchanger with circular fins. The fins provide a large surface area to enhance the heat transfer performance, and the characteristics change according to the layout of the tubes [13–17].
Tube alignment inside the heat exchanger is very important because it directly determines the performance [18–22]. Generally, a staggered alignment enhances heat transfer; thus, most crossflow heat exchangers adopt staggered tubes. However, several inevitable “inline tube zones” with nonnegligible effects exist. Previous studies on the modeling approach did not consider this aspect, and an appropriate methodology is required to accurately predict the heat transfer rate. Moreover, experimental verification is necessary to confirm and support the analytical results.
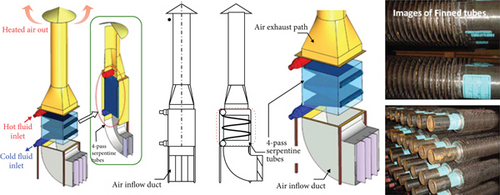
In this study, a hybrid tube alignment modeling approach is proposed. It considers both staggered and inline tube heat transfers with a weighting factor. The calculation results of the hybrid model were verified and validated using a liquid sodium experiment. This study focuses on the effect of the hybrid model on a finned-tube sodium-to-air heat exchanger (FHX), where sodium is on the tube side. Schematics of the FHX in the SFR and the general tube arrangement are shown in Figure 1 [23, 24].
2. Modeling of Circular Fin Heat Exchanger
2.1. 1-D Analysis Model in FHXSA Code
The FHXSA code was originally developed by KAERI (Korea Atomic Energy Research Institute) to design a finned-tube crossflow sodium-to-air heat exchanger in SFR. It calculates both the heat transfer area for a given heat transfer and temperature/flow rates of the sodium/air inlet/outlet and the heat transfer rate for a given heat transfer area. It calculates the heat transfer rate of a single tube from the tube side to the air side (shell side), as well as the pressure drop on each side. The results of single-tube calculations can be expanded to estimate the total heat transfer rate. The model is evenly divided into several control volumes, and the correlations between heat transfer and pressure drop are used for each control volume. In the FHXSA code, the governing equations are expressed as follows.
2.1.1. Continuity Equation
2.1.2. Momentum Equation
2.1.3. Energy Equation
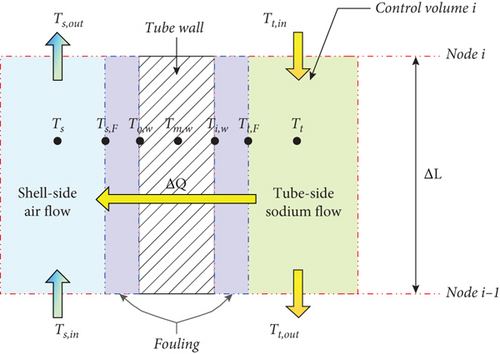
The fouling factor is generally applied to water or steam because the fouling effect is closely related to oxidation at the surface of the metal. However, in the case of sodium, oxygen and hydrogen are controlled and monitored using a cold trap and plugging meter to maintain a certain concentration. Therefore, the fouling on the sodium side is negligible, whereas fouling on the air side is considered, taking into account the humidity. In the FHX design, the fouling factor for compressed air (0.002 Ft2 °F/Btu) was applied, and the corresponding hs,F is approximately 2.841 kW/m2.
2.2. Heat Transfer Modeling
2.2.1. Tube Side (Sodium)
2.2.2. Shell Side (Air)
The heat transfer correlation for the air side was selected as that of Zukauskas, which is expressed as a function of the pitch-to-diameter ratio because heat transfer is most affected by the flow area and perimeter [11]. The finned tube layout and flow channel model are shown in Figure 3.
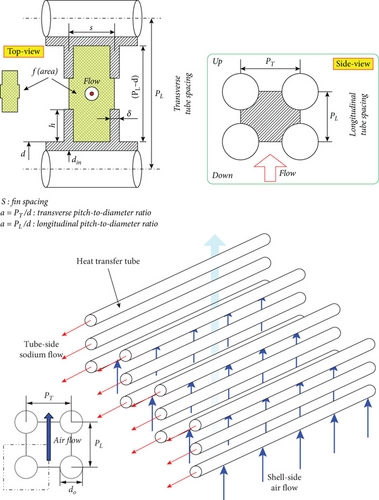
where f denotes the air crossflow area between the fins. The h, δ, s, d, and din are the fin height, thickness, spacing between the fins, tube outer diameter, and tube inner diameter, respectively. The Vmax, used to calculate Ref, is the maximum air velocity and is expressed as a function of the geometrical information of PT and PL. V is the frontal velocity before entering the tube. The RA,flow is defined as the ratio of the flow area reduction owing to the fin area. The ε is the surface extension ratio. The coefficients used in the correlation are based on the tube alignment of the staggered or inline grid.
2.3. Detailed Tube Alignment
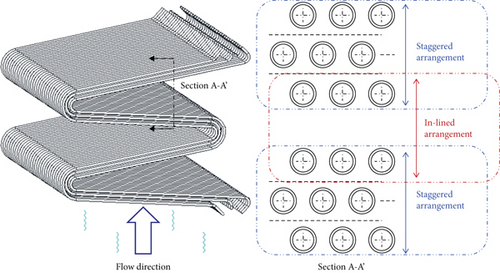
Figure 4 shows the detailed tube layout inside the FHX. The tube alignment in the airflow direction is neither staggered nor inline. The last tubes in the path are aligned with the tubes in the next path, whereas the tubes within the path are in a staggered position. The flow pattern in several rows before the tube bank is different from the tube rows in the stabilized flow region. Therefore, Zukauskas’s correlation for a staggered grid applies to a fully stabilized flow. However, in this case, the flow does not stabilize sufficiently for the case of only 3 rows. Therefore, a correction factor is required. In the code, a weighting method was applied to handle the hybrid tube layout. The final Nusselt number was calculated by adding that of each staggered and inline configuration, weighted by 1/3 and 2/3, respectively.
2.4. Pressure Drop Modeling
2.4.1. Tube Side (Sodium)
2.4.2. Shell Side (Air)
3. Experiments
3.1. Test Facility
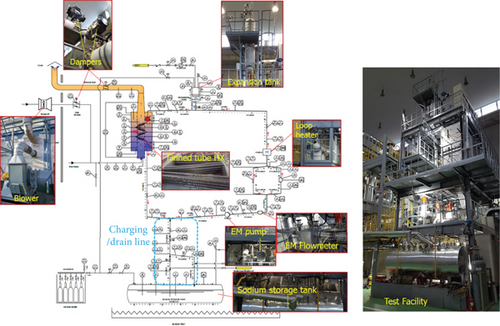
The test facility consists of a main test loop, a gas supply, and related auxiliary systems. The main sodium-side (tube side) components are the test section, model heat exchanger (M-FHX), electromagnetic pump, electric loop heater, flow meters, expansion tank, and sodium storage tank. The air-side (shell side) components are the blower and dampers. The P&ID and images of the test facility are shown in Figure 5. The designed maximum temperature of the facility is 500°C, and the designed power capacity of the main heater is 650 kW. The entire heat exchanger test facility employs pipes with a 2-inch diameter and Sch20 classification [13], and the expected operation flow range is 0.99–4.38 kg/s on the tube side and 0.12–3.4 kg/s on the air side. The maximum available flow rates of the electromagnetic pump and blower are approximately 6 and 5 kg/s, respectively. Appropriate instruments were used to measure the flow rates, temperatures, and pressure differences.
3.2. Test Section—Model FHX
For the experimental verification, an M-FHX was designed, fabricated, and installed in the facility. To have a clear connection with the actual reactor, FHX in the prototype Gen IV sodium-cooled fast reactor (PGSFR), developed by KAERI, was selected as the reference design because sufficient data is publicly available. In Table 1, detailed design parameters of the M-FHX are listed. Each bend of its tube has a thermocouple with a thermowell to measure the temperature of the sodium inside. Twenty multipoint thermocouples with five different measurement points in each sensor (i.e., a total of 100 measurement points) were installed on the air side to measure the temperature of the air.
| Design parameters | Model HX |
|---|---|
| Thermal duty (MWt) | 0.3125 |
| No. of tube columns | 4 |
| No. of tubes | 12 |
| Tube pitch to diameter (P/OD), PL & PT | 2.05 & 2.5 |
| Tube material | STS304 |
| Bare tube (OD/ID) (mm) | 34.0/30.7 |
| Thickness (mm) | 1.65 |
| Finned tube length (total, m) | 7.722 |
| Fin height (mm) | 15.0 |
| Fin thickness (width, mm) | 1.5 |
| Tube inclined angle (degree) | 7.2 |
| No. of fin (per unit length, m) | 157.48 |
| Spacing between fins (mm) | 4.85 |
| Total heat transfer area with fin surface (m2) | 82.04 |
| Total number of fins per single tube (ea) | 1216 |
| Flow region size (W × D, m) | 1.984 × 0.3825 |
| Tube side (sodium) | |
| Flow rate (kg/sec) | 2.19 |
| Inlet/outlet temp. (°C) | 335/224.18 |
| Pressure drop (Pa) | 512 |
| Shell side (air) | |
| Flow rate (kg/sec) | 1.70 |
| Inlet/outlet temp. (°C) | 20.0/213.9 |
| Pressure drop (Pa) | 47 |
3.3. Test Matrix and Procedure
The test conditions of M-FHX were set to verify and validate the code model discussed in the previous section. In Table 2, the test matrix for the 17 test groups is shown.
| Test group no. | Tube side (sodium) | Shell side (air) | ||
|---|---|---|---|---|
| Flow rate (kg/s) | Inlet temperature (°C) | Flow rate (kg/s) | Inlet temperature (°C) | |
| (1) | 0.99 | 187 | 0.12 | Atmospheric temperature (uncontrolled) |
| (2) | 1.06 | 380 | 0.11 | |
| (3) | 1.50 | 366 | 0.37 | |
| (4) | 1.50 | 366 | 0.61 | |
| (5) | 1.50 | 366 | 1.14 | |
| (6) | 2.19 | 335 | 1.14 | |
| (7) | 2.19 | 335 | 1.66 | |
| (8) | 2.19 | 335 | 2.08 | |
| (9) | 2.19 | 480 | 1.66 | |
| (10) | 2.19 | 480 | 2.08 | |
| (11) | 2.74 | 335 | 1.14 | |
| (12) | 2.74 | 335 | 1.66 | |
| (13) | 2.74 | 335 | 2.08 | |
| (14) | 2.74 | 335 | 2.49 | |
| (15) | 3.29 | 480 | 1.66 | |
| (16) | 3.29 | 480 | 2.08 | |
| (17) | 3.29 | 335 | 2.49 | |
The experiment starts with sodium charging. After charging the main test loop from the storage tank, sodium was circulated until the target temperature was reached. Simultaneously, the airflow rate was adjusted. Eventually, the sodium flow rate, sodium inlet temperature, and airflow rate were maintained at the target values for a steady state. Table 3 lists the criteria for the steady-state conditions of the measurements, and the measured data are the average values over 10 min.
| Parameter | Steady-state condition |
|---|---|
| Sodium inlet temperature | (Avg. ±1%) |
| Sodium outlet temperature | (Avg. ±1%) |
| Air inlet temperature | (Avg. ±1%) or (Avg. ±1°C) |
| Air outlet temperature | (Avg. ±1%) or (Avg. ±1°C) |
| Sodium flow rate | (Avg. ±1%) or (Avg. ±1 kg/s) |
| Airflow fate | (Avg. ±1%) or (Avg. ±1 kg/s) |
4. Results and Discussion
4.1. Test Results
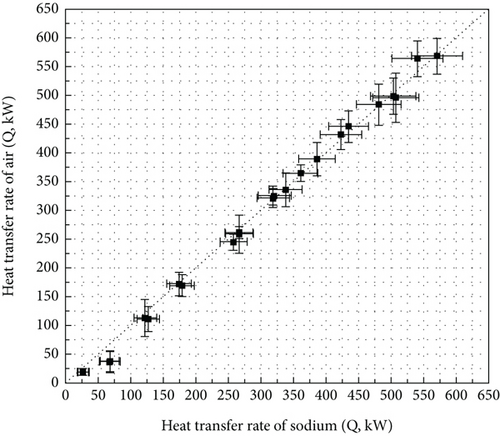
A total of 25 tests were conducted along with the uncertainty analysis results. Additionally, the heat-transfer rates of sodium and air were compared in terms of the enthalpy changes to ensure data reliability (Figure 6). The individual heat-transfer rates from sodium to air were calculated. The specific heat was obtained by averaging the inlet and outlet data. The vapor enthalpy of air was also considered, and the water vapor pressure was obtained using the Buck equation.
4.2. Uncertainty Analysis
For the sodium temperature measurements, the bias error components are related to the measurement system. BST1 and BST2 were estimated to be ±1.5°C from calibration results and ±1.0°C by additional signal transmission tests, respectively. BST3 was statistically obtained using Student’s t-distribution table. BST4 was conservatively defined as ±0.5°C by separately conducted experiments, and BST5 was considered a negative error after the heat loss tests. The precision errors were quantified using a statistical approach. PST1 was calculated by taking conservative degrees of freedom from the measured values obtained over 5 min, and PST2 was deduced from four separate experiments performed on different days.
For air temperature measurements, the error components are defined as follows: BAT1 and BAT2 had the same values as sodium. BAT3 was obtained in the same manner using a statistical approach. PAT1 and PAT2 were calculated in the same manner as for sodium.
For sodium flow rate measurements, Coriolis and electromagnetic flow meters were used. The corresponding error components are defined as follows. BSF1 and BSF2 were considered to be ±0.0125 and ±0.001 kg/s, respectively. BSF3 denoted the transfer error from the current signal to the physical instrument, and its value was ±0.0005 kg/s. PSF1 and PSF2 were quantified using statistical approaches.
For airflow rate measurements, the installation uncertainty was considered. All the other measurements were performed using the same procedure. Moreover, the measurement error of air humidity was considered. Consequently, 3.5 and 0.112% R.H. for the bias and precision error, respectively, were used in the uncertainty analysis.
The relative influence of each error component is summarized in Tables 4 and 5.
| Description of the bias error component | Influence |
|---|---|
| Calibration error for used instruments | Moderate |
| Data acquisition error on transmitting process | Small |
| Data recording error on the HMI program | Small |
| Error due to manufacturing tolerance | Moderate |
| Error due to spatial variation | Large |
| Description of the precision error component | Influence |
|---|---|
| Random error of measured values | Moderate |
| Random error for repeated tests (on different days) | Moderate |
4.3. Comparison with Code Calculation
4.3.1. Temperature
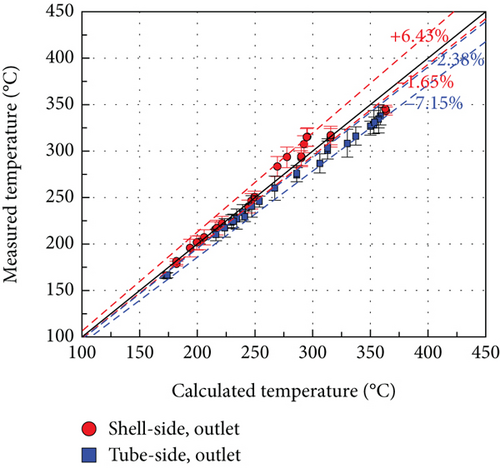
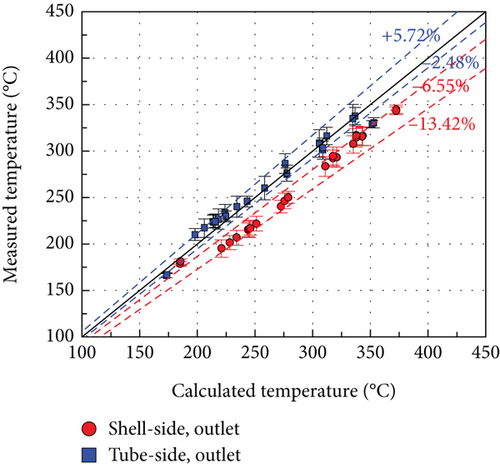
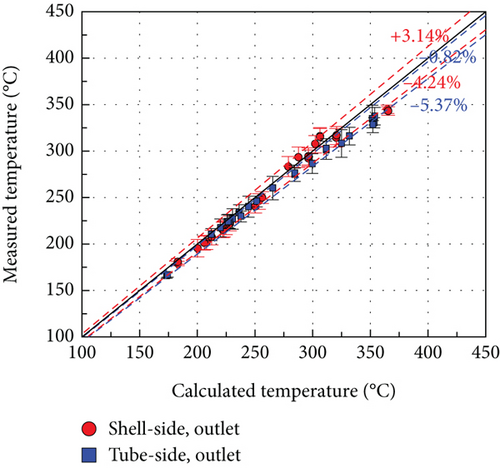
The test results were compared with the code calculations shown in Figures 7, 8–9. For a clear distinction of the hybrid models, the inline- and staggered-only results are also depicted. The hybrid model predicts more accurately than the inline-only and staggered-only models. The inline-only model shows larger differences on the tube side, whereas the staggered-only model shows larger differences on the air (shell) side. The hybrid approach reduced these differences for both tube and shell sides, resulting in 4.55% and 7.38% differences, respectively.
4.3.2. Heat Transfer
The heat transfer comparison results are shown in Figures 10, 11–12. Similar to the temperature comparison cases, the heat transfer was compared with the inline-only and staggered-only calculations. Both the inline-only and staggered-only models exhibited larger differences on the tube side. The results of the hybrid model for tube and shell sides exhibited differences of 15.12% and 9.06%, respectively.
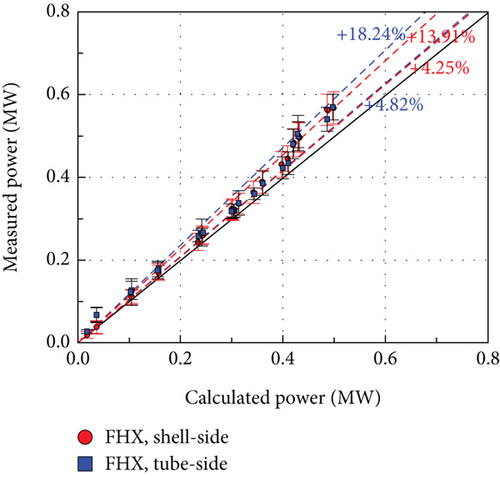
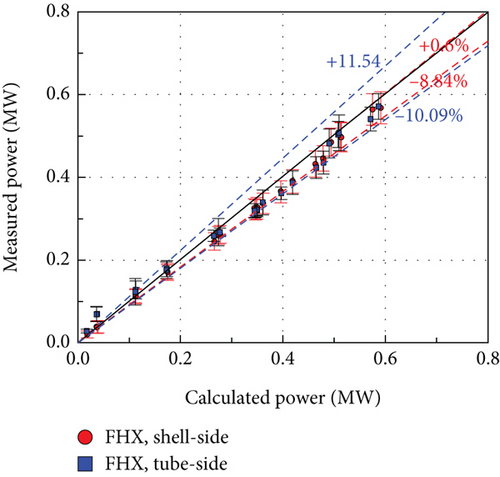
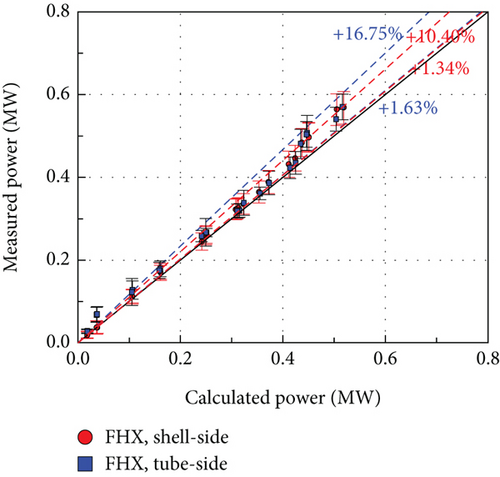
The FHX tube arrangement in this study looks staggered if only 3 tubes are considered. However, the tubes at the top and bottom of the serpentine structure can be considered as an inline arrangement. In this case, the correlation for each arrangement (staggered-only or inline-only) cannot predict the heat transfer accurately. Therefore, the hybrid model was applied to solve the problem with reasonable results, especially for the abnormally arranged tubes.
5. Conclusions
To ensure safety in modern nuclear reactors, heat exchangers play a crucial role, with staggered-arrayed serpentine tubes featuring circular fins being a critical component of SFR. Tube alignment in the heat exchanger directly influences its performance, and the FHX has both staggered and inline tube zones. A hybrid modeling approach is proposed, and the calculation results are verified and validated using a liquid sodium experiment. In applying the correlation equation, the hybrid approach to the tube arrangement reduced the temperature deviation between experimental and calculated values to a difference of 4.55% and 7.38% for both sodium and air sides, respectively, while for the heat transfer, the difference was 15.12% and 9.06% for sodium and air sides, respectively. In this study, a total of 25 tests were conducted, and the data uncertainty was evaluated quantitatively. Consequently, significant improvements in the temperature prediction and heat transfer rate were achieved. The sodium experiment enabled an appropriate evaluation of air-side heat transfer correlation at high temperatures (over 500°C) while keeping the minimum heat resistance issue. The result of this study is limited not only to sodium heat exchangers but also to any serpentine tube arrangement or crossflow heat exchanger under high-temperature conditions, such as the concentrated solar power (CSP) and thermal energy storage (TES) industries. The results of this study can also be used as a basis for the safety evaluation of nuclear reactors and licensing processes for sodium-cooled fast reactors by verifying the performance of the final heat sink in the decay heat removal system (DHRS).
Conflicts of Interest
The authors declare that they have no conflicts of interest.
Acknowledgments
This work was supported by the National Research Foundation (NRF) and National Research Council of Science & Technology (NST) grant funded by the Korea government (MSIT) (Nos. 2021M2E2A2081063, 2023M2D2A1A01074092, and CAP20034-000).
Open Research
Data Availability
The data is available upon request.


