Solar PV System for Thailand’s International Airport: Site Configuration, Energy Production, and Glare Effect
Abstract
In this study, Khon Kaen and Phuket International Airports are chosen to analyze the glare effect using ForgeSolar and economic viability. Simulation is performed with fixed tilt and orientation as this study aims to provide glare-free solar photovoltaic (PV) sites for stakeholders without negotiating the energy generation. The solar site at Khon Kaen International Airport, a potential for temporary afterimage, occurred on KKC-PV-F1, KKC-PV-G3, KKC-PV-G4, KKC-PV-G5, KKC-PV-G7, KKC-PV-G10 for 3,564 min (flight path receptor (FPR)), 2,206 min (air traffic control (ATC)), 1,199 min (ATC), 438 min (ATC), 8,616 min (FPR), 1,743 min (FPR). Following that, low potential for temporary afterimage occurred on KKC-PV-G4 and KKC-PV-G7 for 2,589 min (ATC) and 5,850 min (FPR), respectively. Apart from these, KKC-PV-F1, KKC-PV-G1, KKC-PV-G2, KKC-PV-G6, KKC-PV-G8, KKC-PV-G9, and KKC-PV-G11 are naturally free from the glare effect for FPR and ATC. The Phuket International Airport, HKT-PV-G2, HKT-PV-G5, HKT-PV-R1, and HKT-PV-R2 solar PV sites are free from the glare effect. Overall, it is concluded that 3,350 kWp (KKC) and 4,300 kWp (HKT) solar PV systems are qualified as per Federal Aviation Administration (FAA) regulations. Further, economic analysis shows that the payback period of the system is 8.34–9.65 years and the overall benefit of 3,462.11 M฿.
1. Introduction
1.1. Motivation and Incitement
Renewable energy has recently become vital to overcome combustion-based conventional power production [1, 2, 3]. Renewable energy systems are more likely dependent on geographical conditions; beneficially solar photovoltaic (PV) systems gained popularity in most climatic conditions. For its reliable power generation to residential-to-space applications with negotiable complications in operation and maintenance (O&M), this system is highly valued [4, 5]. A solar cell is a thin silicon-based semiconductor that converts sunlight (photons) into electrical energy. To prevent solar cells from environmental-based degradation, Tedlar, ethyl vinyl acetate (EVA), and solar glass are used to fabricate the solar cell in bulk physical appearance [6, 7]. Solar glass refraction index and absorbability are high to convert a high amount of electrical energy. However, the entire sunlight is not refracted through the solar glass [8, 9, 10]. Some of the reflected sunlight causes flash and glare/glint effects. Notably, no scientific evidence exists of whether the PV module glare/glint could potentially degrade power production. Due to a lack of evidence, in most cases, designing the solar PV farm often neglected the glare effect studies. However, some of the issues were reported by the people living around the solar farm, such as a reflection from the PV module creating a negative impact on short-term visual loss and other discomforts [11].
The solar glare has become a significant concern in recent years as several nations are switching to solar-powered airports to minimize carbon emissions and to utilize the unused land/space from the airport [12, 13]. The increase in solar-powered airports raised concerns over flight safety issues due to massive reflections from the PV module. Notably, several pilots and air traffic control (ATC) officers have raised issues with the solar glare on the runway and ATC tower [14]. A 650–1,100 lm/m2 of glare could flash 4–12 s of vision for pilots on the runway during the landing and takeoff. This concerns flight crews, passengers, and ATC officers for a short-time vision loss which could collapse the operations and lead to a flight crash [15, 16]. Considering this issue, the Federal Aviation Administration (FAA) set regulations to install new solar power plants and for existing power plants to maintain the glare effect from the PV module [17]. Such solar PV systems inside and nearby airport areas must meet the low and the potential for temporary afterimage glare effect conditions from the FAA to avoid the pilot and ATC officer’s temporary vision loss [18, 19]. As per the FAA, low potential for temporary afterimage is acceptable for flight paths but not ATC towers. However, the potential for temporary afterimage glare is restricted for both the flight path and the ATC tower, considering the temporary vision loss [20, 21].
1.2. Literature Review
The reason behind the massive adoption of solar farms in international airports is to reduce the cost of land buying/leasing. The continuous power consumption of airports attracts solar stakeholders to gain higher profit and grid accessibility [22, 23, 24]. Sreenath et al. [25] examined the glare effect at Sultan Ahmad Shah International Airport, Malaysia, using ForgeSolar software. Inbuilt Google map support for the ForgeSolar favors accessing the site location and sun movement automatically. By allocating the area for the PV module mounting and marking the ATC and flight path, it is possible to calculate the annual glare effect. It is found that the selected location exhibits low and potential for temporary afterimage of 833 and 5,945 min for ATC, respectively. The same location shows zero, low, and potential for temporary afterimage for the flight path; however, considering the glare at ATC makes the selected location not suitable for solar installation as per the FAA [25]. Kuantan Airport is considered one of the largest airports that serves civilians and the Malaysian Air Force, with an area of 930.458 acres (3.76 km2). The airport’s monthly average electrical power consumption was 155.89 MWh in 2019. As mentioned earlier, the airport has become attractive for solar stakeholders because of the high power consumption and the vast area for installing the PV farm. At the Kuantan Airport, eight zones are listed as potential areas for solar farms; considering the FAA policy, glare analysis is performed for all zones using ForgeSolar. The resulting seven zones are free from low and potential for temporary afterimage, which can accommodate a 20 MWp solar farm. However, the last zone depicts potential for temporary afterimage for 4,552 min on ATC, although the flight path is free from glare. Considering the FAA policy, the last zone is listed as a restricted zone for solar farms [26]. Following Sultan Ahmad Shah International Airport and Kuantan Airport, Senai International Airport is examined to find the total solar power potential under FAA regulation. A total of 11 sites are selected; among those four sites contain glare effects due to the orientation and tilt of the solar PV system. Furthermore, to eliminate the glare from the mentioned four sites, the tilt and orientations are varied and attain a glare-free site. However, the performance of the system drops to 74.7% [27].
1.3. Contribution and Study Organization
Evaluating the solar glare is crucial for the safety of pilots and the crew, as demonstrated by the above literature and the data in Table 1. It is found that few studies have been performed in analyzing the solar PV glare, and more studies are yet to be performed for a better understanding of the nature of the solar glare. Remarkably, the glare analysis is performed on a location basis and recommends a suitable system for the designated airport. Most of the studies are conducted for Indian and Malaysian airports, to find the feasibility of the solar potential. According to the authors’ knowledge, no glare study has been performed for the solar sites around the Khon Kaen and Phuket International Airport. Furthermore, this study performs a glare analysis for two active international airports in Thailand, namely, Khon Kaen and Phuket International Airport. The reason behind the selection of these two airports is that they are fast-growing international airports. Beneficially, they are not a metropolitan area which favors commissioning large solar sites to reduce the conventional energy consumption for airports and nearby residential and nonresidential regions. For Khon Kaen International Airport, two floating and 11 ground-mounted solar PV sites are configured, and for Phuket International Airport, five ground-mounted and three rooftop solar PV sites are configured. Analyses are conducted on all commissioned sites to assess various aspects of glare, including its duration, annual occurrence, hazard plot, distance of occurrence from the flight path, reflection footprint, and annual emanations. Furthermore, the glare-free site at both international airports is recommended for commercialization based on FAA regulations. In Section 2, project description and simulation details are discussed which includes the selected airport sites of Google Earth view and the aerial view of FPR, ATC, and route receptor (RR) following the importance of airport glint and glare descriptions as per FAA regulations. Solar potential with the selected site area and capacity of the PV system commissioned, and the feasibility of solar PV systems around the airport areas are critical factors to consider in this study. Section 3 explains the results and discussions of the performed study, which includes fixed tilt and orientation for the KKC and HKT International Airports and their low and potential for temporary afterimage for all the FPR, ATC, and RR. Energy productions of the commissioned solar sites are discussed, and economic analysis is performed according to the price systems’ developments in Thailand (feed-in tariff). Section 4 concludes the overview of the examined solar site’s glare effect, energy production, and economic analysis for both glare and glare-free sites.
| Location | PV capacity (site area) | Input | Simulation/software | Platform | Objective | Remarks | References |
|---|---|---|---|---|---|---|---|
| Kannur Airport, India | 80 kWp (9,129 m2) | Google Earth Pro | ForgeSolar | Glare gauge and glare reduce | The glare effect was studied for different scenarios of PV modules to identify the major cause. | PV modules using smooth glass without anti reflective coating (ARC), smooth glass with ARC, and light texture with ARC are not suitable for airport integration. | [28] |
| Doncaster Sheffield Airport, United Kingdom | 12 MWp | Google Earth | Solar electricity calculator | Trigonometric calculation | Based on the power demand, a 12 MWp solar PV system is proposed, and feasibility studies are performed to avoid the glare effect. | The optimal tilt range is selected to minimize the glare effect and maintain the least glare perpendicular to the runway. | [29] |
| Mysore Airport, India | 1,950 kWp (19,464 m2) | Google Earth Pro | ForgeSolar | Vector algebra, complex algorithms | Fixed, single-axis, and dual-axis tracking of ground-mounted solar PV systems are performed to determine the glare effect. | Fixed and dual-axis tracking systems failed to meet the FAA policy. | [30] |
| Chandragadi Airport, Nepal | 134 kWp | — | PVSYST | — | Based on the real-time power consumption, a 134 kW solar PV system is proposed to facilitate the airport free from conventional power consumption. | A glare-free site is chosen to avoid the discomfort of the airport staff and pilots. | [19] |
| Incheon International Airport, South Korea | 7 MWp | Google map | Solar glare hazard analysis tool | — | A glare-free solar PV system was developed by varying the azimuth–tilt angle of the integration of different conditions. | Solar PV system integrations are recommended in the opposite directions of the runway to avoid glare effects on the pilot. | [12] |
| Hurghada International Airport, Egypt | 31.3 MWp | — | PVGIS | — | Considering the increase in energy demand, a wasteland from the airport is proposed for a solar PV system to produce renewable energy for airport consumption and grid feeding for energy demand. | A higher amount of emissions are reduced, but the Egyptian grid policy breaks the profit of the solar system due to less grid feed-in tariff rate. | [31] |
| Ahmedabad Airport, India | 170 kWp operational and 9.8 MWp estimated | Google Earth | ForgeSolar | Glare gauge and glare reduce | The glare effect is studied for different structures of PV modules, such as smooth glass without ARC, smooth glass with ARC, lightly textured glass with ARC, variation of tilt and orientation, single-axis tracking, and dual-axis tracking. | PV module using a different tilt and orientation and single-axis tracking model was qualified as per FAA’s glare policy. | [32] |
| Khon Kaen, Phuket and Samui International Airport | — | Google Earth | ForgeSolar | Glare gauge |
|
|
Present study |
2. Project Description and Simulation
2.1. Site Selection
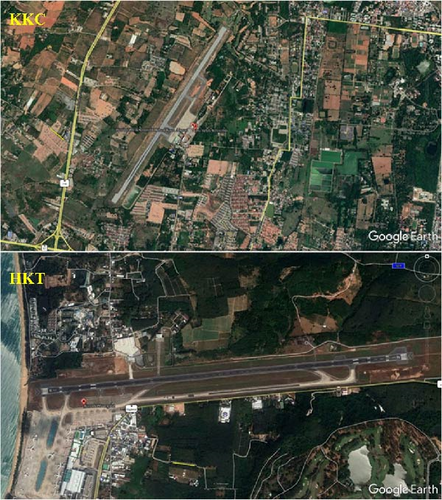
Thailand is one of the famous adventure destinations listed in the eighth position in the world tourism ranking. Three modes of transportation are used to enter the Kingdom of Thailand, such as water, road, and air. Comparatively, more than 80% of them enter the mode of air. To avoid air traffic, Thailand offers 14 international and 19 domestic airports as mentioned earlier; airports are well-known energy consumers. Mainly, Thailand airports are functioning at full capacity for most of the period in a year. In this study, two international airports (Figure 1(a)) are chosen to analyze the feasibility of solar potential. Thailand is rich in solar potential, with an average of 300 days of clear sunshine. Solar PV systems are incorporated easily anywhere in/around the airport, such as on building rooftops, water bodies, and unused land.
2.2. Glare Analysis
2.2.1. Importance of Airport Glint and Glare Effects
According to FAA regulations, the ocular transmission coefficient is 0.5, and the pupil diameter and eye focal length are 0.002 and 0.017 m, respectively, as listed in Table 2. The glare analysis is performed in minute intervals to vary the reflectivity of the solar PV module toward the sun’s movement. For glint/glare analysis, clear sunshine is assumed under a varying direct normal irradiance (DNI). Table 3 depicts the FAA regulation on permitting solar sites in/around the airport zone. When the ForgeSolar simulation study shows no glare found on the solar sites, they are free from restriction and can be implemented for solar power generation. The red glare is not applicable for solar PV systems as they are perfect reflectors like solar concentrators. However, yellow glare is considered as potential for temporary afterimage, and direct viewing of the sun is within the yellow glare. An increase in the subtended source angle can cause potential temporary vision loss though the retinal irradiance is less. On the other hand, an increase in retinal irradiance not greater than 10 W/cm2 can maintain the low potential for temporary afterimage with a 1 mrad subtended source angle. The FAA regulation indicates that the potential for temporary afterimage is not suitable for ATC and FPR. And, the low potential for temporary afterimage is suitable for only FPR which represents a low potential for temporary afterimage. ATC is required to maintain glare-free to avoid potential damage to flight passengers, crews, pilots, and others.
| Description | Range |
|---|---|
| Ocular transmission coefficient | 0.5 |
| Pupil diameter | 0.002 m |
| Eye focal length | 0.017 m |
| Sun subtended angle | 9.3 mrad |
| Axis tracking | Fixed |
| Tilt | 16 |
| Orientation | 180 |
| Glare indices | 650–1,100 lm/m2, 7 W/m2 (4–12 s temporary vision loss) |
| Incident angles | 0°−180° |
| Glare observation period | Sunrise to sunset |
| Atmospheric and weather patterns | Clear sky, varying DNI |
| PV system degradation over time | Not considered for glare analysis, for power generation 0.8%/year |
| Glare color | Impact | FAA’s regulation |
|---|---|---|
| Glare-free | No impact | Suitable for solar PV system installation |
| Red | Potential retinal burn (permanent eye damage) | Not suitable for FPR |
| Not suitable for ATC | ||
| Yellow | Potential for temporary afterimage | Not suitable for FPR |
| Not suitable for ATC | ||
| Green | Low potential for temporary afterimage | Suitable for FPR |
| Not suitable for ATC | ||
2.3. Performance Analysis
2.3.1. Solar Potential for Airport Zone
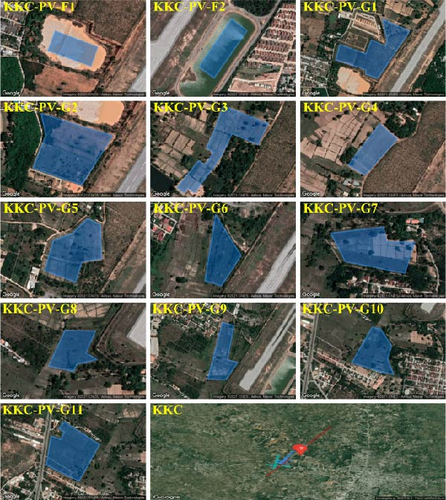
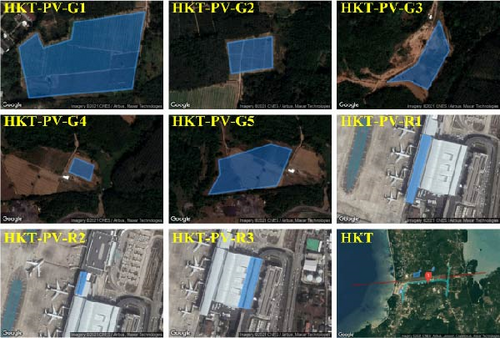
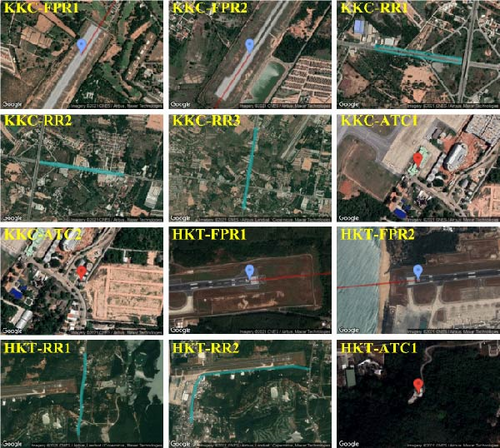
Based on the land availability around KKC International Airport, two floating-type PV module mounting structures and 11 ground mounting structures were selected with a total capacity of 43,500 kW as listed in Table 4 (Figure 1(b)). The reason behind the selection of the floating type at KKC is to reduce the land renting cost, conserve the water bodies from industrial pollutants, and reduce water evaporation. On the other hand, these are the sites available for solar installation within the 30-km range from the airport which requires following FAA regulations [25]. In this case, rooftop mounting structures are not selected due to the unavailability of the space. For HKT International Airport, floating-type PV systems are not selected due to the unavailability of freshwater bodies around the airport area. However, six ground mounting and three rooftop mounting structures are selected for a total capacity of 13,850 kW, as shown in Figure 1(c). Khon Kaen and Phuket International Airport are the largest airports in the northeastern and southern parts of Thailand, respectively, which connects several national and International Airports in Thailand and other neighboring countries. The glare effect from KKC and HKT International Airports was examined to find the low and potential for temporary afterimage for two flight paths, three RRs, and two ATCS. Overall, two international airport solar sites are shown in Figures 1(b) and 1(c), which are used to perform the glare analysis to meet the requirements of the FAA.
| Location | Site name | Site area (m2) | PV capacity (kWp) |
|---|---|---|---|
| Khon Kaen International Airport (KKC) | KKC-PV-F1 | 11,625 | 1,000 |
| KKC-PV-F2 | 13,840 | 1,500 | |
| KKC-PV-G1 | 80,502 | 8,500 | |
| KKC-PV-G2 | 40,897 | 3,500 | |
| KKC-PV-G3 | 26,541 | 2,500 | |
| KKC-PV-G4 | 13,160 | 1,000 | |
| KKC-PV-G5 | 26,166 | 2,500 | |
| KKC-PV-G6 | 17,048 | 1,500 | |
| KKC-PV-G7 | 30,074 | 2,500 | |
| KKC-PV-G8 | 15,450 | 1,500 | |
| KKC-PV-G9 | 45,223 | 4000 | |
| KKC-PV-G10 | 56,370 | 4,000 | |
| KKC-PV-G11 | 89,856 | 9,500 | |
| Phuket International Airport (HKT) | HKT-PV-G1 | 78,153 | 7,400 |
| HKT-PV-G2 | 14,121 | 1,200 | |
| HKT-PV-G3 | 14,697 | 1,200 | |
| HKT-PV-G4 | 3,500 | 450 | |
| HKT-PV-G5 | 27,292 | 2,500 | |
| HKT-PV-R1 | 5,309 | 500 | |
| HKT-PV-R2 | 1,285 | 100 | |
| HKT-PV-R3 | 5,866 | 500 | |
- G: ground mounting; R: rooftop mounting; F: floating.
2.3.2. Feasibility of Solar PV Systems at Thailand’s Airport
In this study, two international airports from northeastern and southern airports are chosen based on the frequency of the flight operations and distance from the capital city (Bangkok). Advanced research in solar PV modules reduced the reflectivity of the solar glass using antireflecting coating methods. However, some of the incident rays will reflect into the sky, which causes a solar glare or glint. There is no way to reduce the glare effect from solar PV modules. Hence, finding the glare effect and glare period could beneficially reduce temporary eye discomfort by choosing alternative options. A well-known method to evaluate the glare effect for airport solar sites is ForgeSolar, developed by Sandia National Laboratories, using the guidelines from the FAA. ForgeSolar software contains an inbuilt Google Earth viewer to select the real-time location and sun movement. The solar PV system site can be constructed through the input feeder, and marking the FPR’s, ATC officer’s, and RR’s location favors analyzing the glare effect, as shown in Figure 1(d). In this study, the tilt and orientation of the PV modules are fixed and not varied to reduce the glare effect. Because tilt and orientation are critical parameters for solar PV systems in yielding higher power generation. If the glare effect occurs, the site is not recommended for installing the PV modules. The description and captions of ForgeSolar simulation results are depicted in Table 5.
| Figure captions | Description |
|---|---|
| Low potential for temporary afterimage | Caused by green glare |
| Potential for temporary afterimage | Caused by yellow glare |
| Permanent retinal damage zone | Caused by red glare, this permanent retinal damage zone does not apply to solar PV systems |
| PV array footprint | Area of the PV module that exhibits the glare effect |
| Hazard from source data | Glare reflection from the solar PV modules to ATC, FPR, and RR in the form of low and potential for temporary afterimage |
| Hazard due to viewing unfiltered sun | Viewing the sun with bare eyes (without protection) |
| Reflected light vectors | Reflected glare in the form of vertices from PV module arrays to RR |
| Reflective surface footprint | Glare generated by PV module |
| Receptor footprints | Glare received by the RR |
2.4. Economic Analysis
Solar PV systems are one of the potential renewable energy sources particularly when they are installed in the airport areas. However, installing within and around the airport area requires following the FAA regulations which creates the complexity. In this study, two floating and eleven ground-mounted solar PV systems are commissioned for KKC, while five ground-mounted and three rooftop systems are commissioned for HKT airports. Considering the economic feasibility of the system, PV module orientations and tilt angles are fixed, and economic analysis is performed for both glare-free and glare-occurring solar sites.
2.4.1. Assumptions
Economic analysis has been performed for 20 years as Thailand’s electricity purchasing agreements are 20 years between the solar farm and the Provincial Electricity Authority (PEA). The standardized power degradation factor of 0.8%/year is considered throughout the economic analysis [33]. According to the standard labor cost, 1% of the total investment is considered O&M cost. A 5% interest rate is applied, and 15% of the initial investment is added to the 20 years of plant operation for inverter replacement [34]. Following that, the actual price of 40 Thai Baht/kW for solar installation and 5.66 Thai Baht/kWh for energy feed are used as the major input parameters for the economic analysis [35].
2.4.2. Mathematical Modeling
To reduce the complexity of solar PV system integration at Thailand’s airport, a simplified mathematical modeling is developed for calculating the economic feasibility of the proposed systems. In this case, the total energy generation of the solar PV systems is evaluated using the PVsyst program for each commissioned solar site. Further, to estimate the economic feasibility of the proposed system, total energy generation and the abovementioned assumptions are computed with Equations (1), (2), and (3).
3. Results and Discussions
3.1. Glare Results
3.1.1. Khon Kaen Floating System
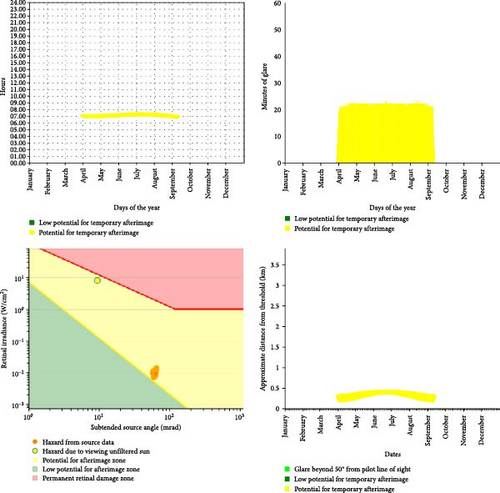
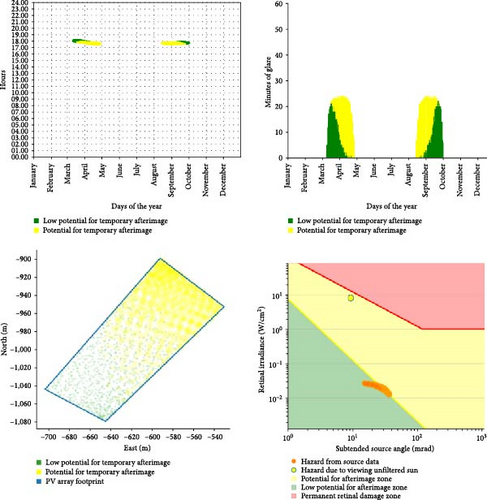
In total, 13 solar sites are configured for Khon Kaen International Airport. Among them, two are floating, and 11 sites are ground mounted with fixed tilt. The first floating solar PV system with a rated power of 1,000 kW is commissioned as per the FAA regulation to avoid the solar glare and glint effect. To attain higher accuracy in glare effect, the entire area of the solar PV system commissioning is drawn over the inbuilt map. All corners are inputted with their exact latitude, longitude, and elevations from both ground and height above the ground. Both FPR and ATC are free from low and potential for temporary afterimage, and following that, RR1 and RR2 attained no glare. But RR3 attained 1 min of low potential for temporary afterimage during April, as shown in Table 6. Applying the glare conditions of FPR to RR3 makes KKC-PV-F1 have no restriction to install the solar PV systems, and it can contribute 28459.2 MWh to the grid. KKC-PV-F2 achieved a glare-free status for FPR1, ATC, and RR. Unexpectedly, FPR2 experienced 3,564 min of potential for temporary afterimage from late March to mid-September, as depicted in Figure 2 (top left image). The potential for temporary afterimage occurs between 06:30 and 07:30, a daily average of 23 min (Figure 2 top right image). Notably, the total glare of the FPR2 is high, which cannot be compensated by changing the flight route as the glare occurred in the peak period of the landing and takeoff. In Figure 2, the bottom left image shows the hazardous plot of FPR2; viewing an unfiltered sun has the potential for temporary afterimage. It could flash the vision for 4–12 s as the retinal irradiance and subtended source angle are ca.9 W/cm2 and 9.3 mrad, respectively. As mentioned earlier, red glare is not suitable for solar PV systems, whereas this study focused on low and potential for temporary afterimage. The low potential for temporary afterimage effect rate does not only depend on the retinal irradiance. A decrease in subtended source angle can withstand the low potential for temporary afterimage for a maximum of ca.9 W/cm2. On the other hand, a higher subtended source angle with lower retinal irradiance can cause low potential for temporary afterimage which is suitable for FPR. There is no glare beyond 50° from the pilot line of sight recorded; however, the potential for temporary afterimage occurred within 0.5 km from the threshold as shown in Figure 2 bottom right image. This potential for temporary afterimage for FPR2 makes KKC-PV-F2 not suitable for real-time application. A detailed explanation of figure captions is mentioned in Table 5.
| Site name | Tilt (θ) | Orientation (θ) | Low potential for temporary afterimage (min) | Potential for temporary afterimage (min) | PV capacity (kWp) | Energy production (MWh) |
|---|---|---|---|---|---|---|
| KKC-PV-F1 | 16 | 180 | 1 | 0 | 1,000 | 28,459.2 |
| KKC-PV-F2 | 16 | 180 | 0 | 3,564 | 1,500 | 42,670.32 |
| KKC-PV-G1 | 16 | 180 | 0 | 0 | 8,500 | 241,847.76 |
| KKC-PV-G2 | 16 | 180 | 0 | 0 | 3,500 | 99,588.72 |
| KKC-PV-G3 | 16 | 180 | 0 | 2,233 | 2,500 | 71,129.52 |
| KKC-PV-G4 | 16 | 180 | 2,597 | 1,218 | 1,000 | 28,163.52 |
| KKC-PV-G5 | 16 | 180 | 440 | 1 | 2,500 | 71,129.52 |
| KKC-PV-G6 | 16 | 180 | 0 | 4 | 1,500 | 42,226.8 |
| KKC-PV-G7 | 16 | 180 | 8,626 | 5,850 | 2,500 | 71,129.52 |
| KKC-PV-G8 | 16 | 180 | 0 | 59 | 1,500 | 42,226.8 |
| KKC-PV-G9 | 16 | 180 | 0 | 28 | 4,000 | 112,617.12 |
| KKC-PV-G10 | 16 | 180 | 1,743 | 214 | 4,000 | 112,617.12 |
| KKC-PV-G11 | 16 | 180 | 0 | 15,483 | 9,500 | 267,479.52 |
3.1.2. Khon Kaen Ground Mounting System
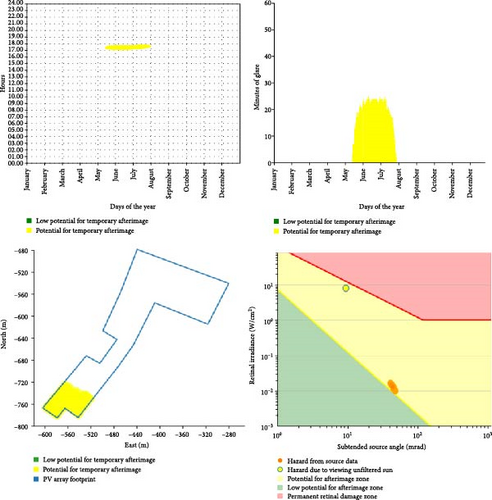
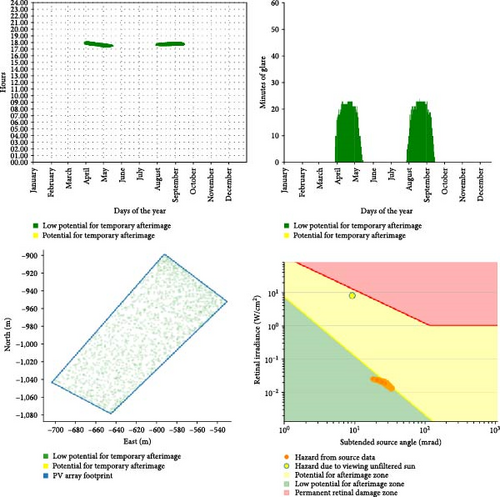
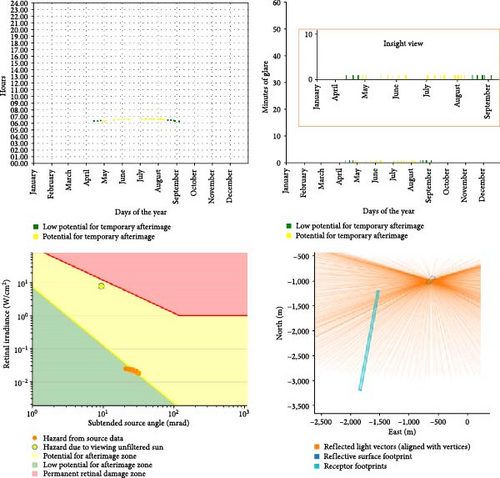
KKC-PV-G1 and KKC-PV-G2 achieved a glare-free status for all FPR, ATC, and RR throughout the year. This makes these sites potentially suitable for commercial purposes and recommended for installation. Beneficially, they can contribute 241,847.76 and 99,588.72 MWh energy production to the grid, respectively. Following that, KKC-PV-G3 to KKC-PV-G11 shows the potential for temporary afterimage. The total potential for temporary afterimage of KKC-PV-G3 is 2,233 min. ATC1 and ATC2 alone attained the higher glare period of 1,511 min and 695 min from the middle of May to the end of July as shown in Figures 3(a) and 3(b), respectively. Potential for temporary afterimage occurred during the end of the day and sustained ca. 25 min in a day. The glare reflection on the PV footprint clearly shows that the area from the east (−500) and north (−720) is vulnerable to delivering the potential for temporary afterimage (ATC1). To obtain the potential for temporary afterimage free from KKC-PV-G3, avoiding the mentioned area for PV module mounting is necessary. Comparatively, ATC2 received less potential for temporary afterimage than ATC1, which is 695 min. The footprint of the potential for temporary afterimage shared the same region of the PV module locations. Beneficially, the glare period is less than 20 min from late June to mid-July. Apart from ATC glare, KKC-PV-G3 faced glare issues with RR3. However, it is in the morning between 06:00 and 07:00, less than 2 min daily. Month-wise, it followed a similar pattern to ATC1 and ATC2, but the glare time was different. Figure 3(c) shows the simplified annual glare emanations of RR3, and 85% of the RR3 faces the potential for temporary afterimage. However, the short duration of potential for temporary afterimage can be avoided by rerouting the vehicles from May to July. The RRs are outside the airport boundary, and it does not require to qualify the FAA regulations.
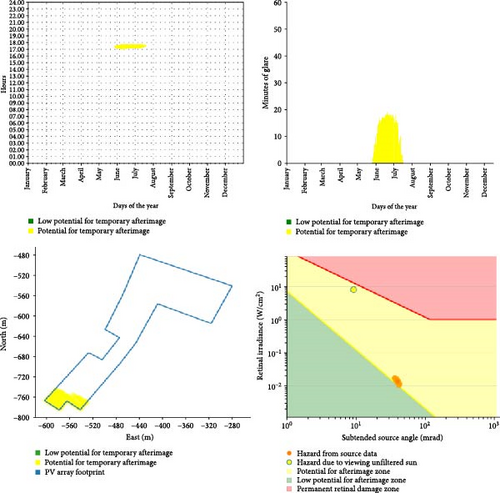
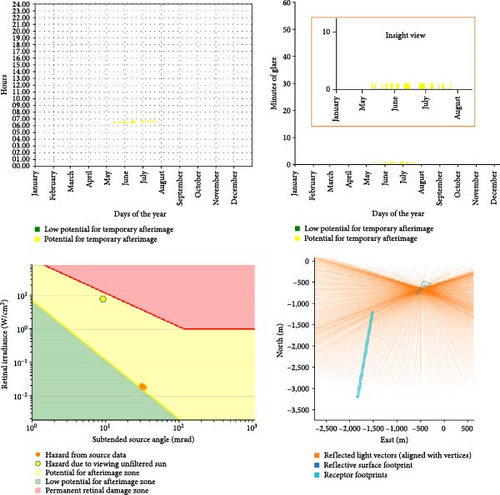
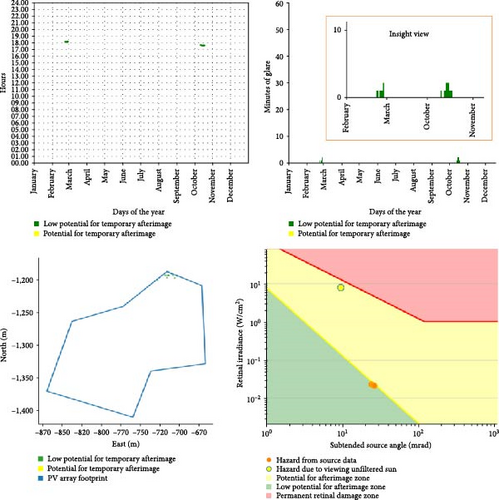
The FPR1 and FPR2 of KKC-PV-G4 are free from both low and potential for temporary afterimage. Notably, ATC1 is severely affected by low and potential for temporary afterimage, with an annual duration of 834 and 1,199 min as shown in Figure 4(a), respectively. As per FAA regulations, a low potential for temporary afterimage is allowable for FPR, but ATC is required to gain zero glare from both low and potential for temporary afterimage. The glare period differs from the abovementioned KKC solar sites because the glare occurred discontinuously. The first glare was sustained between March and April and the second glare mid-August to early October. However, both periods, low and potential, for temporary afterimage occurred for ATC1 with an overall average of 22 min, as shown in Figure 4(a). The glare reflection of the PV footprint shows nearly the entire configured area; therefore, it is difficult to restructure the configured solar site. Notably, ATC2 faced a similar glare reflection from the configured site, although it has a low potential for temporary afterimage, not permissible for ATC as shown in Figure 4(b). Following ATC1 and ATC2, low and potential for temporary afterimage were noted for RR3 with an annual duration of 8 and 19 min, respectively. The daily duration of glare is similar to KKC-PV-G3, and the length of the glare was found to be mid-April to early September, which is higher than ATC1 and ATC2. Annual glare emanations for RR3 are shown in Figure 4(c), and above 85% of RR3 received low and potential for temporary afterimage. Overall, KKC-PV-G4 is not recommended for operation as per the FAA regulation. The seventh solar PV site KKC-PV-G5 is commissioned with a rated capacity of 2,500 kWp. On this site, ATC and FPR are free from the potential for temporary afterimage. However, ATC1 and ATC2 were exposed to the low potential for temporary afterimage for 14 and 424 min. RR3 received 2 and 1 min of low and potential for temporary afterimage, respectively, as listed in Table S1. For ATC1, leaving the north side above −1,200 m could be an option for glare-free, but ATC2 attained glare above −1,330 m, which makes KKC-PV-G5 a problem for ATC2 (Figures 5(a) and 5(b)).
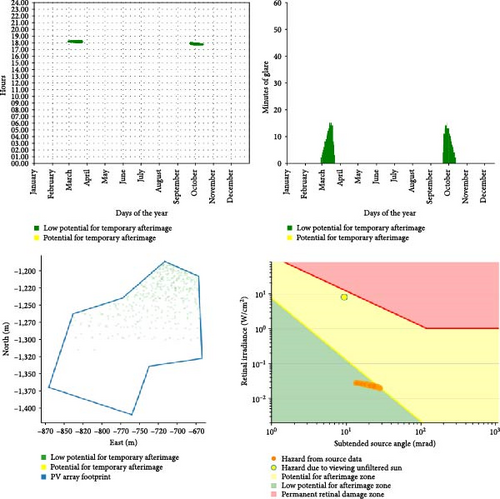
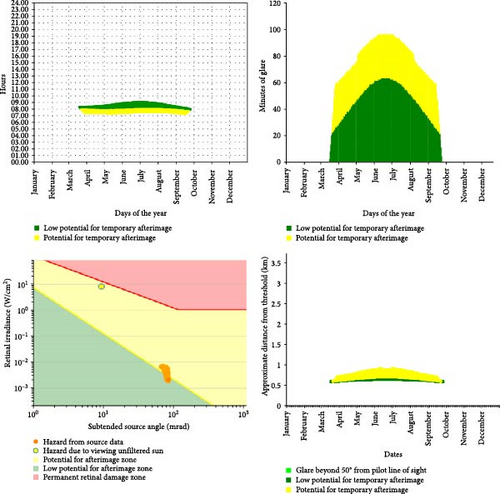
KKC-PV-G6 is glare-free for FPR, ATC, RR1, and RR2, but RR3 received 4 min of potential for temporary afterimage during April and August with a maximum daily duration of 1 min. This makes KKC-PV-G6 suitable for real-time application and expected to produce a total energy of 42,226.8 MWh as listed in Table 6. KKC-PV-G7 shows a low and potential for temporary afterimage for FPR2 higher than the site mentioned above. Beneficially, FPR1, ATC, and RR are free from low and potential for temporary afterimage, although KKC-PV-G7 is unsuitable. This is because KKC-PV-G7 exhibited a continuous mixed low level and potential for temporary afterimages between March and September. On the other hand, the daily peak duration of potential for temporary afterimage reached 97 min, as shown in Figure 5(c), and it is higher than other configured sites. The glare is less than 1 km from the FPR2 and cannot be rerouted like other sites considering the daily duration of the glare. KKC-PV-G8 to KKC-PV-G11 solar site passed the regulation of FAA as the potential for temporary afterimage does not occur for FPR1 and FPR2. Moreover, ATC1 and ATC2 are free from the potential and low potential for temporary afterimage, making these solar sites a potential site for implementation.
KKC-PV-G8 and KKC-PV-G9 exhibit only potential for temporary afterimage for RR3, which is not in consideration as per the FAA regulation. The annual glare duration is 59 and 28 min, which can be avoided by rerouting the glare period, as listed in Table S1. Notably, KKC-PV-G10 provides 214 min of potential for temporary afterimage for RR3, which is higher than KKC-PV-G8 and KKC-PV-G9. Notably, FPR and ATC glares are considered a potential threat to the airport staff, pilots, and passengers. In such a case, RR3 potential for temporary afterimage can be negligible if it can be rerouted. Moreover, it is not difficult considering the length of the glare between March and September. The average daily glare is 3 min; as mentioned earlier, RR does not follow the FAA regulations, which add-on KKC-PV-G10 is possible for commercialization. On the other hand, KKC-PV-G10 exhibits low potential for temporary afterimage to FPR2, which can be negligible according to FAA regulations. The final site, KKC-PV-G11, achieved free from low and potential for temporary afterimage for FPR and ATC. However, RR3 experienced 15,483 min of potential for temporary afterimage, which could potentially cause vision loss. Annual glare prediction shows that the potential for temporary afterimage occurs every day in RR3, and the peak duration is 60 min. This makes the RR3 need to shut the operation between 06:00 and 08:00 to implement the KKC-PV-G11 in the commercial.
From the above 13 solar PV sites, it is found that RR3 received 9 min of low potential for temporary afterimage which is negligible. However, 15,835 min of potential for temporary afterimage was recorded. On the other hand, most of the potential for temporary afterimage incidents for RR3 occur between 06:00 and 08:00. This suggests that rerouting or suspending RR3 operations during these hours could facilitate the implementation of KKC-PV-G6, KKC-PV-G8, KKC-PV-G9, KKC-PV-G10, and KKC-PV-G11 for commercial purposes. However, these sites do not require approval from the FAA as RR is not included for aviation safety. RR3 is not within the boundary of KKC. Considering civilian safety, it is necessary to act against the potential for temporary afterimage that occurred on RR3. According to the Thailand Transportation Corporation, RR3 is not a high-traffic region. Rerouting/shutting the RR3 for a specific period (between 06:00 and 08:00) can greatly impact the glare effect, and the temporary vision loss for civilians can be avoided. Naturally, KKC-PV-F1, KKC-PV-G1, and KKC-PV-G2 are free from glare effects, which can produce 369895.68 MWh annually. With the help of RR3 rerouting/shutting for the specific period, the total annual energy production will be 947,063.04 MWh.
3.1.3. Phuket Ground and Rooftop Mounting System
In Phuket International Airport, five ground-mounted and three rooftops solar PV sites are commissioned with a total capacity of 13,850 kW. The expected total energy production is 367,253 MWh to reduce conventional power consumption. Glare analysis is evaluated for two flight paths, one ATC, and two receptor routes. Table 7 shows the overall energy production and glare duration for the eight sites. HKT-PV-G1, HKT-PV-G3, and HKT-PV-G4 sites obtained low and potential for temporary afterimage for ATC. Comparatively, HKT has less potential for temporary afterimage than KKC. The total rated PV capacity for HKT-PV-G1 is 1,200 kW, and the expected energy generation is 197,126.16 MWh. FPR2 gained 309 and 837 min of low and potential for temporary afterimage, and ATC1 received 290 min of potential for temporary afterimage, as listed in Table S1. The potential for temporary afterimage distance from the FPR2 is less than 1 km. However, the low potential for temporary afterimage is recorded to be ca. 3.5 km which makes the entire solar site unstable for power generation as per FAA. Overall, ground-mounted solar sites HKT-PV-G2 and HKT-PV-G5 and rooftop-mounted solar sites HKT-PV-R1 and HKT-PV-R2 are qualified for the FAA regulation for commercialization.
| Site name | Tilt (θ) | Orientation (θ) | Low potential for temporary afterimage (min) | Potential for temporary afterimage (min) | PV capacity (kWp) | Energy production (MWh) |
|---|---|---|---|---|---|---|
| HKT-PV-G1 | 10 | 180 | 309 | 1,127 | 7,400 | 197,126.16 |
| HKT-PV-G2 | 10 | 180 | 1,652 | 0 | 1,200 | 31,970.4 |
| HKT-PV-G3 | 10 | 180 | 469 | 627 | 1,200 | 31,970.4 |
| HKT-PV-G4 | 10 | 180 | 1,621 | 68 | 450 | 11,993.52 |
| HKT-PV-G5 | 10 | 180 | 1,719 | 0 | 2,500 | 66,601.92 |
| HKT-PV-R1 | 10 | 285 | 388 | 0 | 500 | 12,307.68 |
| HKT-PV-R2 | 10 | 285 | 177 | 0 | 100 | 2,531.76 |
| HKT-PV-R3 | 10 | 105 | 663 | 0 | 500 | 12,751.2 |
3.2. Performance Analysis
Table 8 represents the annual glare and glare-free solar sites for both KKC and HKT International Airports. A total of nine commissioned solar sites attained the glare effect which is not permitted for installing the system as per FAA regulations. It is found that a 7 W/m2 reflection from the PV module can cause temporary visual impairment for 4–12 s. The angle of the incident is directly proportional to the glare reflection such as an increase in the angle of incident reflecting the solar irradiance to the sky. Sandia National Laboratory found that the glare effects are high during the sunshine and sunset period due to an increase in the angle of incident between the sun and PV module [36]. Notably, examined solar sites exhibit a similar pattern of glare due to the fixed tilt and orientation of the PV module.
| Site name | Low potential for temporary afterimage (min) | Potential for temporary afterimage (min) | Description | FAA approval |
|---|---|---|---|---|
| KKC-PV-F1 | 1 (RR3) | 0 | Low potential for temporary afterimage, however, RR3 doesn’t require FAA approval | Pass |
| KKC-PV-F2 | 0 | 3,564 (ATC1) | Potential for temporary after image (06:30–07:30), ATC requires glare-free | Fail |
| KKC-PV-G1 | 0 | 0 | No glare occurred | Pass |
| KKC-PV-G2 | 0 | 0 | No glare occurred | Pass |
| KKC-PV-G3 | 0 | 2,233 (ATC1, 1,511; ATC2, 695; RR3, 27) | Though the RR3 does not require FAA approval but the ATC1 and ATC2 (17:00–18:00) require glare-free | Fail |
| KKC-PV-G4 | 2,597 (ATC1, 834; ATC2, 1,755; RR3, 8)) | 1,218 (ATC1, 1,199; RR3, 19) | ATC obtained low and potential for temporary afterimage (17:30–18:30) | Fail |
| KKC-PV-G5 | 440 (ATC1, 14; ATC2, 424; RR3, 2) | 1 (RR3) | ATC obtained low potential for temporary afterimage (17:30–18:30) | Fail |
| KKC-PV-G6 | 0 | 4 (RR3) | RR3 does not require FAA approval | Pass |
| KKC-PV-G7 | 8,626 (FPR2) | 5,850 (FPR2) | FPR can pass low potential for temporary afterimage, but the potential for temporary afterimage occurred for 5,850 min (07:00–09:30) | Fail |
| KKC-PV-G8 | 0 | 59 (RR3) | RR3 does not require FAA approval | Pass |
| KKC-PV-G9 | 0 | 28 (RR3) | RR3 does not require FAA approval | Pass |
| KKC-PV-G10 | 1,743 (FPR2) | 214 (RR3) | FPR2 attained low potential for temporary afterimage and RR3 attained potential for temporary afterimage | Pass |
| KKC-PV-G11 | 0 | 15,483 (RR3) | RR3 does not require FAA approval | Pass |
| HKT-PV-G1 | 309 (FPR2) | 1,127 (FPR2, 837; ATC1, 290) | FPR2 (06:30–07:30) and ATC1 (17:30–18:30) attained potential for temporary afterimage | Fail |
| HKT-PV-G2 | 1,652 (FPR2) | 0 | FPR2 (06:30–07:30) attained low potential for temporary afterimage | Pass |
| HKT-PV-G3 | 469 (FPR1, 292; FPR2, 177) | 627 (FPR1, 551; RR2, 76) | FPR2 (06:30–07:30) attained low potential for temporary afterimage, and FPR1 (17:30–18:30) attained potential for temporary afterimage | Fail |
| HKT-PV-G4 | 1,621 (FPR1, 686; FPR2, 935) | 68 (FPR1) | FPR2 attained a low potential for a temporary afterimage (06:30–07:30); FPR1 attained a low and potential for temporary afterimage (17:30–18:30) | Fail |
| HKT-PV-G5 | 1,719 (FPR1, 1,530; RR3, 189) | 0 | FPR1 and RR3 attained low potential for temporary afterimage | Pass |
| HKT-PV-R1 | 388 (FPR2, 338) | 0 | FPR2 attained low potential for temporary afterimage | Pass |
| HKT-PV-R2 | 177 (FPR2) | 0 | FPR2 attained low potential for temporary afterimage | Pass |
| HKT-PV-R3 | 663 (FPR1, 334; ATC, 329) | 0 | ATC attained low potential for temporary afterimage | Fail |
3.3. Economic Analysis
According to the Thailand grid integrity regulation, 20 years of plant operation based on the feed-in tariff rates are considered for the solar farm, and other input parameters are listed in Table 9. KKC International Airport’s expected 20 years of generation is set to be 1,231,285 MWh from the two floating and 11 ground-mounted solar systems. After neglecting the glare sites, a total of 947,063.04 MWh is attributed to reducing the conventional power consumption. This study mainly focused on determining glare-free sites without negotiating the standards of solar PV system installation in Thailand. Several studies show that changing the PV module orientation could avoid or reduce the glare effect for ATC and FPR, but it could increase the PP and reduce the overall benefits of the solar farm [12, 28]. NPV is considered one of the major parameters in estimating the performance of solar farms. An increase in NPV represents the amount of cash flow after deducting its initial investment. If the NPV is negative, the solar farm PP period is higher than the plant operation. Beneficially, in this study, NPV is positive for both KKC and HKT International Airport solar sites resulting in the payback being less than 9 years excluding HKT-PV-R1, HKT-PV-R2, and HKT-PV-R3. This study does not include land rental for solar systems as there are no clear regulations for renting land for solar farms in Thailand. PI higher than 1 shows the attractive PP, and in this case, PI lies between 1.03 and 1.28 other than HKT-PV-R1 for all the commissioned KKC and HKT International Airport solar sites. The profit of the solar sites is attractive after deducting the initial investment and O&M cost as listed in Table 10. This attractive economic benefit of the solar site could lead the airports to utilize carbon-free energy.
| Parameters | Range |
|---|---|
| Solar system cost | 40 ฿/W |
| Feed-in tariff (FIT) | 5.66 ฿/kWh |
| Operation and maintenance (O&M) | 1% of initial investment |
| Power degradation | 0.8%/year |
| Inverter cost | 15% of the initial investment |
| Interest rate | 5% |
| Plant operation | 20 years based in Thailand FIT |
| Location | Site name | Energy (MWh) | NPV | PI | PP | Profit (M฿) |
|---|---|---|---|---|---|---|
| KKC airport | KKC-PV-F1 | 28,459.2 | 86,208,640 | 1.28 | 8.34 | 93.88 |
| KKC-PV-F2 | 42,670.32 | 129,213,344 | 1.28 | 8.35 | 140.71 | |
| KKC-PV-G1 | 241,847.76 | 732,474,592 | 1.28 | 8.35 | 797.66 | |
| KKC-PV-G2 | 99,588.72 | 301,630,624 | 1.28 | 8.35 | 328.47 | |
| KKC-PV-G3 | 71,129.52 | 215,421,984 | 1.28 | 8.35 | 234.59 | |
| KKC-PV-G4 | 28,163.52 | 84,614,784 | 1.26 | 8.43 | 92.21 | |
| KKC-PV-G5 | 71,129.52 | 215,421,984 | 1.28 | 8.35 | 234.59 | |
| KKC-PV-G6 | 42,226.8 | 126,822,560 | 1.26 | 8.44 | 138.20 | |
| KKC-PV-G7 | 71,129.52 | 215,421,984 | 1.28 | 8.35 | 234.59 | |
| KKC-PV-G8 | 42,226.8 | 126,822,560 | 1.26 | 8.44 | 138.20 | |
| KKC-PV-G9 | 112,617.12 | 338,259,904 | 1.26 | 8.43 | 368.61 | |
| KKC-PV-G10 | 112,617.12 | 338,259,904 | 1.26 | 8.43 | 368.61 | |
| KKC-PV-G11 | 267,479.52 | 803,441,984 | 1.26 | 8.43 | 875.53 | |
| Phuket International Airport (HKT) | HKT-PV-G1 | 197,126.16 | 565,323,872 | 1.14 | 8.91 | 618.45 |
| HKT-PV-G2 | 31,970.4 | 91,695,680 | 1.14 | 8.91 | 100.31 | |
| HKT-PV-G3 | 31,970.4 | 91,695,680 | 1.14 | 8.91 | 100.31 | |
| HKT-PV-G4 | 11,993.52 | 34,410,784 | 1.14 | 8.91 | 37.64 | |
| HKT-PV-G5 | 66,601.92 | 191,016,064 | 1.14 | 8.91 | 208.97 | |
| HKT-PV-R1 | 12,307.68 | 32,744,256 | 0.97 | 9.65 | 36.06 | |
| HKT-PV-R2 | 2,531.76 | 6,927,392 | 1.03 | 9.38 | 7.61 | |
| HKT-PV-R3 | 12,751.2 | 35,135,040 | 1.05 | 9.31 | 38.57 | |
3.4. Comparative Analysis
Table 11 depicts the comparative study of different airport’s glare effects. Varying the PV module orientation and tilt angle reduced the glare effect though it is not viable in terms of economic aspect. It is found that no studies have been performed on economic analysis by knowing the impact of solar PV system return on investment. The main novelty of the study indicates that the selected locations are new for glare studies, and the largest solar site is commissioned as far as the author’s knowledge. Following that, a reliable economic analysis is performed which could be easy for real-time implementations.
| Airport location | Total site | Glare effect (min) | Glare-free site | Economic analysis | References |
|---|---|---|---|---|---|
| Malaysia | 20.71 MWp | Potential for temporary after image, 4,552 | 20 MWp | ✗ | [26] |
| Malaysia | 37,65,428.830 m2 | Low potential for temporary afterimage, 833; potential for temporary afterimage, 5,945 | — | ✗ | [25] |
| India | 80 kWp | Low potential for temporary afterimage, 480; potential for temporary afterimage, 2,122 | — | ✗ | [28] |
| India | 16,718 kWp | Low potential for temporary afterimage, 3,855; potential for temporary afterimage, 9,862 | 9,823 kWp | ✗ | [32] |
| United Kingdom | 12 MWp | — | — | ✗ | [29] |
| South Korea | 7 MWp | Glare, 41,275 | — | ✗ | [12] |
| India | 1,950 kWp | Low potential for temporary afterimage, 13; potential for temporary afterimage, 1,676 | — | ✗ | [30] |
| Thailand | 43,599 kWp (KKC), 13,850 kWp (HKT) | Low potential for temporary afterimage, 13,407 (KKC) and 6,998 (HKT); potential for temporary afterimage, 28,654 (KKC) and 1,822 (HKT) | 33,500 kWp (KKC), 4,300 (HKT) | ✓ | Present study |
4. Conclusion
- (i)
KKC-PV-F1 faced 1 min of low potential for temporary afterimage and no record of potential for temporary afterimage; however, KKC-PV-F2 attained 3,564 min potential for temporary afterimage for ATC1.
- (ii)
KKC-PV-G3 faces a higher potential for temporary afterimage on ATC1 and ATC2; following that, KKC-PV-G4 faces both low and potential for temporary afterimage. Beneficially, KKC-PV-G5 obtains only low potential for temporary afterimage. However, all three sites failed to meet the FAA regulations.
- (iii)
The last glare effect site of KKC-PV-G7 faces a low and potential for temporary afterimage with a duration of 8,626 (FPR2) and 5,850 min (FPR2), respectively.
- (iv)
Apart from the abovementioned KKC sites, KKC-PV-F1, KKC-PV-G1, KKC-PV-G2, KKC-PV-G6, KKC-PV-G8, KKC-PV-G9, KKC-PV-G10, and KKC-PV-G11 sites are free from glare for FPR and ATC and qualify the FAA regulation. Though KKC-PV-G6, KKC-PV-G8, KKC-PV-G9, KKC-PV-G10, and KKC-PV-G11 solar sites RR3 face glare effect, they are outside the airport and do not require to follow the FAA regulations.
- (v)
For HKT airport, HKT-PV-G1, HKT-PV-G3, HKT-PV-G4, and HKT-PV-R3 face glare effect. HKT-PV-G1 faces 309 min of low potential for temporary afterimage for FPR2. Unfortunately, 837 and 290 min of potential for temporary afterimage were observed for FPR2 and ATC1, respectively. Similar glare effects are observed for HKT-PV-G3 and HKT-PV-G4.
- (vi)
The final glare effect site of HKT-PV-R3 faced only a low potential for temporary afterimage, but 329 min of ATC failed to meet the FAA regulations. Apart from that, HKT-PV-G2, HKT-PV-G5, HKT-PV-R1, and HKT-PV-R2 are glare-free solar PV sites.
- (vii)
The overall energy generation including glare and nonglare solar sites for KKC is 1,231,285.44 and 947,063.04 MWh, and for HKT, it is 367,253.04 and 113,411.76 MWh, respectively.
- (viii)
The economic analysis shows an attractive PP with 8.34–9.65 years and an overall benefit of 3,462.11 M฿.
- (ix)
This study exhibits the necessity of solar glare analysis within a 30 km radius of KKC and HKT International Airport. FAA’s regulation applies to the solar farms around the airport to protect the aviation industry. In general, solar sites outside the 30 km radius of the airport zone also exhibit glares; however, they do not require to undergo any approval process, but they are affecting civilians, particularly from the ground-mounted and floating-type PV system.
- (x)
To overcome these issues, it is recommended to implement glare analysis as a standard procedure to follow for every solar installation site. Particularly those near parks, hospitals, and other major places where people generally gather or use for their day-to-day routines should be carefully monitored to avoid unnecessary temporary vision loss for civilians.
Nomenclature
-
- ATC:
-
- Air traffic control
-
- DNI:
-
- Direct normal irradiance
-
- EVA:
-
- Ethyl vinyl acetate
-
- F:
-
- Floating PV
-
- FAA:
-
- Federal Aviation Administration
-
- FPR:
-
- Flight path receptors
-
- G:
-
- Ground-mounted PV
-
- FTT:
-
- Feed-in tariff
-
- HKT:
-
- Phuket International Airport
-
- HKT-PV-G:
-
- Ground-mounted photovoltaic system at Phuket International Airport
-
- HKT-PV-R:
-
- Rooftop-mounted photovoltaic system at Phuket International Airport
-
- Km:
-
- kilometer
-
- kWp:
-
- Kilowatt peak
-
- kWh:
-
- Kilowatt-hour
-
- KKC:
-
- Khon Kaen International Airport
-
- KKC-PV-F:
-
- Floating-type photovoltaic system at Khon Kaen International Airport
-
- KKC-PV-G:
-
- Ground-mounted photovoltaic system at Khon Kaen International Airport
-
- MWp:
-
- Megawatt peak
-
- MWh:
-
- Megawatt-hour
-
- M฿:
-
- Million Thai baht
-
- NPV:
-
- Net present value
-
- PI:
-
- Profitability index
-
- PP:
-
- Payback period
-
- PV:
-
- Photovoltaic
-
- RR:
-
- Route receptor
Conflicts of Interest
The authors declare that they have no conflicts of interest.
Authors’ Contributions
Chattariya Sirisamphanwong contributed to visualization, investigation, methodology, and writing–original draft. Karthikeyan Velmurugan contributed to investigation, methodology, and writing–original draft. Rattaporn Ngoenmeesri contributed to resource, conceptualization, and methodology. Buntoon Wiengmoon contributed to visualization, conceptualization, and investigation. Sirinuch Chindaruksa contributed to visualization and investigation. Tholkappiyan Ramachandran contributed to investigation, methodology, and writing–review and editing. Madhan Kuppusamy contributed to investigation, methodology, and writing–review and editing. Chatchai Sirisamphanwong contributed to project administration, methodology, resources, validation, and supervision. Chattariya Sirisamphanwong and Karthikeyan Velmurugan have contributed equally.
Acknowledgments
The authors would like to thank the Smart Energy System Integration Research Unit, Department of Physics, Faculty of Science, Naresuan University, for providing the facility to fulfill the experiment’s needs.
Open Research
Data Availability
The data used to support the findings of this study are included within the article.


