Collaborative Attack Sequence Generation Model Based on Multiagent Reinforcement Learning for Intelligent Traffic Signal System
Abstract
Intelligent traffic signal systems, crucial for intelligent transportation systems, have been widely studied and deployed to enhance vehicle traffic efficiency and reduce air pollution. Unfortunately, intelligent traffic signal systems are at risk of data spoofing attack, causing traffic delays, congestion, and even paralysis. In this paper, we reveal a multivehicle collaborative data spoofing attack to intelligent traffic signal systems and propose a collaborative attack sequence generation model based on multiagent reinforcement learning (RL), aiming to explore efficient and stealthy attacks. Specifically, we first model the spoofing attack based on Partially Observable Markov Decision Process (POMDP) at single and multiple intersections. This involves constructing the state space, action space, and defining a reward function for the attack. Then, based on the attack modeling, we propose an automated approach for generating collaborative attack sequences using the Multi-Actor-Attention-Critic (MAAC) algorithm, a mainstream multiagent RL algorithm. Experiments conducted on the multimodal traffic simulation (VISSIM) platform demonstrate a 15% increase in delay time (DT) and a 40% reduction in attack ratio (AR) compared to the single-vehicle attack, confirming the effectiveness and stealthiness of our collaborative attack.
1. Introduction
In recent years, emerging technologies such as 5G, artificial intelligence (AI), and autonomous driving have accelerated the development of intelligent transportation systems (ITSs) [1–3]. ITSs have been widely studied and applied because they can improve safety, efficiency, the environment, and energy savings. Certain nations, including the United States, Japan, and China, have accelerated the creation of new infrastructure to support the technology-based end of ITS deployment. As an integral component of ITSs, intelligent traffic signal (I-SIG) systems, which are responsible for conducting dynamic and optimum signal control, have also been investigated and deployed. In New York, California, and Florida, for instance, the United States Department of Transportation has been testing the I-SIG system [4] since September 2016. The Ministry of Transport of China has depended on Huawei and Didi to test out the I-SIG systems at intersections in some cities, like Jinan, Shandong Province, and Shenzhen, since 2018. In general, the majority of I-SIG systems are built on collaborative vehicle infrastructure technology, which uses emerging connected vehicle (CV) technology [5, 6] to enable vehicles to communicate with their surroundings, including traffic signal control infrastructure, other vehicles, and roadside units (RSUs). Inevitably, increased connectivity in traffic control systems also provides a new channel for cyber threats.
Previous research [7–9] has found that traffic control systems are not secure and could be a target of spoofing attacks. In [7], attackers manipulate vehicle data like position, speed, direction, and acceleration to influence the decisions made by the traffic signal planning algorithm, the Controlled Optimization of Phases (COP) algorithm [10, 11], causing unexpectedly heavy traffic congestion. Research [8, 9] has also confirmed that data spoofing attacks can cause severe traffic congestion [8] or collisions [9]. However, research like [12, 13] proposed effective methods for detecting and predicting spoofing-related traffic congestion. Other studies, such as [14–17], focus primarily on approaches for authentication and privacy protection for the connected vehicular cloud service. Single-vehicle attacks require continuous attacks to cause severe congestion, making them easily detectable and removable.
In this paper, we reveal a multivehicle multistep collaborative attack against I-SIG systems. A collaborative attack is launched at an irregular location with a varying attack frequency (AF) using a variable number of attack vehicles, causing more severe and widespread congestion more stealthily. Meanwhile, we propose a collaborative attack sequence generation model aiming to explore efficient and stealthy multivehicle multistep collaborative attack sequences in the I-SIG system. The multivehicle multistep collaborative attack is a sequential optimization decision in which attack actions consist of whether or not to launch an attack, the attack type, and the attack location, and the intersection situation will change after a specific time interval after the attack action occurs. There are several key issues as follows. (1) How to model multivehicle multistep collaborative attacks? This includes the fine-grained modeling of the action space of the attack behavior and the state space of the intersection. (2) How to perform automatic generation of collaborative attack sequences to be able to explore the strategy of learning optimal attack behavior in a large-scale state space? (3) How to evaluate the effectiveness and stealthiness of the attack sequences? Effectiveness is used to measure the effect of congestion caused by congestion attacks. Stealthiness is the extent to which the attacker avoids detection as much as possible.
To overcome the mentioned challenges, we propose a collaborative attack sequence generation model based on multiagent reinforcement learning (RL) for the I-SIG system to explore the efficient and stealthy collaborative attack sequences. The agent is an entity that learns to make sequential decisions in an environment to maximize its cumulative reward. In this paper, the agent interacts with the intersection environment through a series of actions and receives feedback in the form of rewards or penalties based on its actions and eventually learns a policy that can generate collaborative attack sequences. Fine-grained modeling of collaborative attacks based on Partially Observable Markov Decision Process (POMDP) investigates the construction of action space and state space. Based on the attack modeling, the mainstream RL algorithm Soft Actor-Critic (SAC) [18] is used to study the generation of collaborative attack sequences at single intersections. Then, we study the generation of multi-intersection collaborative attack sequences based on the mainstream multiagent RL method Multi-Actor-Attention-Critic (MAAC) [19]. In addition, we propose a hierarchical architecture that develops independent single-intersection collaborative attack models at the lower level and expands those models to multi-intersection collaborative attacks at the higher level to more quickly expand the collaborative attack to a larger region.
- 1.
We propose a hierarchical architecture to quickly expand the single-intersection collaborative attack (low level) to the multi-intersection collaborative attack (high level) with a larger region.
- 2.
We implement an automatic collaborative attack sequence generation model based on multiagent RL for generating effective multivehicle multistep collaborative attack sequences to support the security of developing I-SIG systems.
- 3.
We define the attack ratio (AR) and AF to measure the attack stealthiness. The results on the VISSIM [20] platform show that the proposed approach has an improvement in attack effectiveness and stealthiness, demonstrating the superiority of the collaborative attack compared with the single-vehicle attack.
2. Background
2.1. Preliminary
- 1.
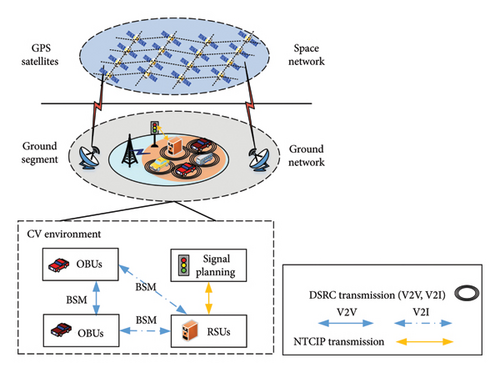
Infrastructure of I-SIG: As shown in Figure 1, the I-SIG with the CV environment is contained in the network-based ground segment. RSUs, signal planning units (SPUs), and on-board units (OBUs) are deployed in roadside servers, traffic lights, and vehicles, respectively. Both vehicle-to-infrastructure (V2I, e.g., roadside servers) [21] and vehicle-to-vehicle (V2V) [22] communications utilize the dedicated short-range communications (DSRC) [23] transmission protocol to establish a channel and allow for high-speed direct interaction. Every CV broadcasts Basic Safety Messages (BSMs) anonymously, and vehicles nearby receive messages. The size, position, speed, heading, acceleration, and brake system condition of the vehicle are among the essential data items contained in BSMs. Unlike DSRC, US National Transportation Communications for Intelligent Transportation System Protocol (NTCIP) [24] is adopted for communication between the RSU and the SPU.
- 2.
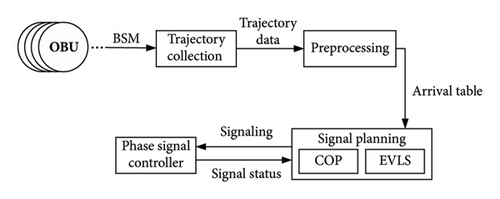
I-SIG data flow: Figure 2(a) illustrates the I-SIG system’s data flow. BSMs are sent to the RSU by each OBU of a vehicle for real-time trajectory gathering. After that, the information is preprocessed to form an arrival table (Table 1) that will be utilized as input for the signal planning algorithm, which includes the COP and the Estimation of Vehicle Location and Speed (EVLS) algorithms. If the penetration rate (PR) of OBUs is below 95%, the arrival table will be updated with the EVLS algorithm. If not, the COP algorithm will get the arrival table straight and begin planning. The phase signal controller will receive a downward signaling command in accordance with the output of the COP algorithm. The signal status will be supplied as feedback for continuous COP planning at the end of each stage of signal control.
-
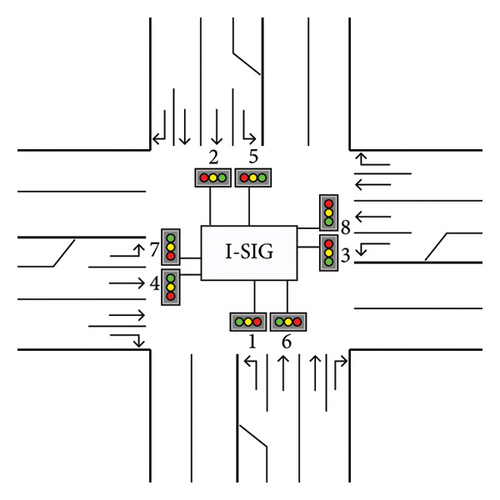
As seen in Figure 2(b), I-SIG has eight traffic signals, as well as phases. The amount of time required from the present location to reach the stop bar is shown in Table 1 as Ti = i(0 ≤ i ≤ M). In order to cover a BSM statistic of more than two minutes, I-SIG sets M = 130 s. Nij(i ∈ [0, M], j ∈ [1, 8]) denotes that Nij vehicles may arrive at the stop bar of phase j in less than Ti seconds.
- 3.
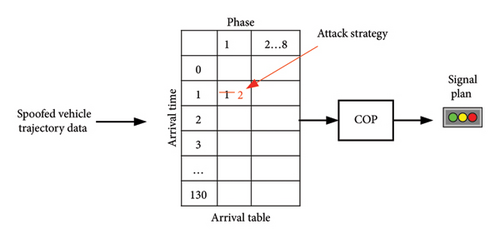
Spoofing attack: The spoofing attack strategy is depicted in Figure 3. A vehicle’s requested signal phase and arrival time are changed by the attacker by altering the speed and location information. As a result, the associated arrival table items are modified. The COP algorithm will execute improper planning and output the incorrect signal scheme as a result of the vehicles’ erroneous trajectory data being supplied to the algorithm. The queuing length is longer when attack vehicles are present, and then the COP algorithm extends the time allotted for the current phase’s green light, delaying the beginning of all subsequent phases and lengthening the time it takes for vehicles to pass.
2.2. Related Work
Several recent research [7–9] studies have shown the security issues with the I-SIG system based on CV technology. For instance, Chen et al. [7] found that data spoofing might be used to attack the I-SIG system. One attack vehicle could significantly clog up traffic by using the data spoofing. Jeske [8] showed how hackers can really take over navigation systems to trick navigational systems and clog up traffic. The authors of [9] examined vehicle stream security attacks. These attacks might affect the vehicle stream via message falsification (modification), replay attack, or spoofing (masquerading) attack; in extreme circumstances, these attacks can result in rear-end collisions.
| Phase | 1 | 2 | … | 8 |
|---|---|---|---|---|
| T0 | N01 | N02 | … | N08 |
| T1 | N11 | N12 | … | N18 |
| T2 | N21 | N22 | … | N28 |
| … | … | … | … | … |
| TM | NM1 | NM2 | … | NM8 |
- Note: 1 to 8 are the phase numbers and T0 to TM indicate the remaining arrival time of the vehicle.
As for the detection and prediction of spoofing attacks, in certain research, as [12, 13], to identify or predict the spoofing attack, the faked traffic flow information was studied. Using characteristics from traffic image data, Li et al. [12] suggested a CycleGAN-based prediction method that takes into account the connection between an attack and the congestion it causes. The authors of [13] proposed an explainable congestion attack prediction approach employing a deep learning model, namely, the tree-regularized gated recurrent unit (TGRU), to explain the relation between the traffic flow characteristics and the phases in which the attack vehicle is located.
There are authentication and information-preservation measures to prevent attack automobiles from connecting to CV networks and altering data. For CVs, Gupta and Sandhu [14] presented an extended access control-oriented architecture as an authorization framework to safeguard the Internet of Vehicles (IoV). An anonymous, lightweight authentication system for distributed vehicular fog services was suggested by the authors in [17], which uses blockchain technology and can allow flexible cross-data center authentication for connected automobiles. In order to guarantee the integrity of transmission data, the authors of [15] combined the fundamental ideas of game theory and information theory to provide a secure and effective transmission system. A ciphertext-based search system that can prevent information from being altered while it is being retrieved was proposed by Fan et al. [16]. Additionally, some recent research, such [25, 26], has concentrated on trustworthy blockchain-based signature and authentication for edge computing systems.
As shown in Table 2, in summary, existing data spoofing attacks against I-SIG systems are single-vehicle attacks that are launched continuously to cause cumulative congestion and are not well concealed. The existing spoofing attack detection methods are for single-vehicle spoofing attacks, while the attack vehicles used in this study are real-world CVs, which can bypass defense mechanisms such as authentication. Few studies have investigated multivehicle collaborative attacks against I-SIG systems. Our proposed collaborative attack model based on multiagent RL can generate highly effective and stealthy collaborative attack sequences. Meanwhile, the proposed hierarchical learning architecture can improve the scalability of the collaborative attack, causing large-scale congestion.
| Related works | Strengths | Weaknesses |
|---|---|---|
| [7–9] | Security issues with the ITS, such as single-vehicle data spoofing attack to traffic signal systems, single-vehicle spoofing to navigation systems, and replay attacks | Single-vehicle attacks are not well concealed |
| [12, 13] | Detection and prediction of spoofing attack | Detection and prediction of single-vehicle data spoofing attacks |
| [14–17, 25–27] | Authentication and information preservation mechanisms to prevent attack automobiles from connecting to CV networks and altering data | Real-world connected vehicles can bypass authentication mechanisms |
| This work | Multi-vehicle collaborative attacks | Attack with effectiveness and stealthiness |
3. Framework of Automatic Collaborative Attack Sequence Generation
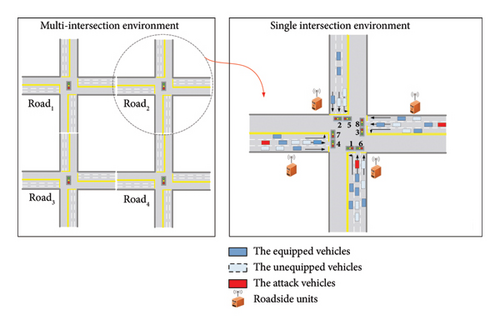
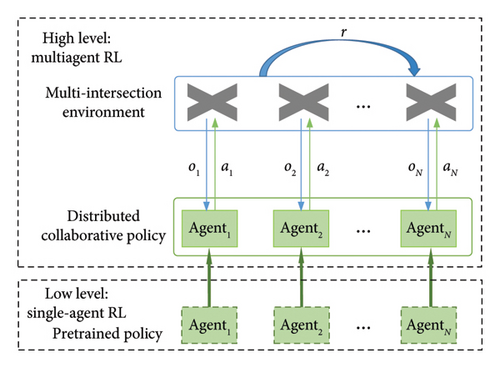
As shown in the right subfigure of Figure 4(a), there are multivehicle collaborative attacks at single intersections, and even in more severe cases, such attacks can extend to a larger region of multiple intersections. For the single intersection, we consider using a single-agent RL model to generate collaborative attacks for the single intersection. For multiple intersections, we consider using a multiagent RL model to generate collaborative attacks for multiple intersections. Since the state space of multiple intersections is several times that of a single intersection, it will lead to a reduction in the training speed of the multiagent RL. Therefore, two levels of multivehicle collaborative attacks exist in our research, as shown in Figure 4(b). For this type of problem, we think of a layered framework in which we can have the single-agent RL part and the multiagent RL part. We propose a hierarchical kind of method, where the single-agent part can be model-free learning independent of the other agents, and the multiagent part can use pretrained policies as initial policies for the multiagent RL part to perform multi-intersection collaborative attacks.
3.1. Hierarchical Framework
The hierarchical framework of automatic collaborative attack sequence generation is shown in Figure 4(b). At a low level, each attacker needs to launch attacks at their own intersections. We consider the method of single-agent RL to explore as many multivehicle and multistep data spoofing attacks as possible. Meanwhile, we introduce the experiences of single vehicle spoofing attack into single-agent RL to research the knowledge-guided collaborative attacks at single intersections, which can overcome the time consumption of exploring the collaborative attack action space. Then, we can obtain the pretrained collaborative attack policies for single intersections.
At a high level, these attackers in a multi-intersection environment need to launch a collaborative attack. Therefore, we need to perform multiagent RL over the level of how they collaborate, but we do not need to pay attention to how they launch the attack sequences at a single intersection.
Through the hierarchical framework, we can build a low-level collaborative attack to train some independent agents to launch spoofing attacks at single intersections. Then, we can perform learning at the higher-level collaborative attack over those independent single agents. The hierarchical framework can improve the learning efficiency of multiagent RL by reusing policies of single agents. At the same time, it can scale collaborative attacks to larger domains (regions with more intersections), expanding the impact range of collaborative attacks.
3.2. Objective Formulation
| Notation | Description |
|---|---|
| CD | Congestion degree of a single intersection |
| PCDk | Congestion degree at the kth phase of an intersection |
| SR | The success rate of attack |
| DT | The vehicle delay time |
| AD | The average total vehicle delay per second |
| AR | Attack ratio |
| AF | Attack frequency |
| Q(⋅) | State-action value function |
| The parameters of the policy network and the target policy network, respectively | |
| The parameters of the critic network and the target critic network, respectively | |
| ∇θJ(πθ) | The policy gradient |
| LQ(ψ) | The loss function for Q-value function |
Equation (1) is the objective of single-agent training, while equation (2) is the objective of multiagent co-training. Training a single agent is for generating collaborative attack sequences in a single intersection environment, while training multiple agents is for generating collaborative attack sequences in a multi-intersection environment. Therefore, there are correspondingly two training objectives. Meanwhile, the trained single agents are used as the initialization of the co-training to accelerate the multiagent co-training.
4. Methodology
In this section, we firstly construct the action space, the state space, and the reward function of a collaborative attack, respectively, answering the question “How to model multivehicle multistep collaborative attacks?” Then we describe the automatic generation model of collaborative attack sequences at single and multiple intersections, respectively, answering the question “How to perform automatic generation of collaborative attack sequence to be able to explore the strategy of learning optimal attack behavior in a large-scale state space?”
4.1. Collaborative Attack Modeling
4.1.1. Problem Formulation for Low Level
At the low level, we consider the problem of modeling the collaborative attack sequences at a single intersection into a POMDP model [28–30]. As shown in the right subfigure in Figure 4(a), the attacker could launch the spoofing attack by manipulating the BSMs of multiple attack vehicles. These attack vehicles could decide to alter their own BSMs, like location, speed, and acceleration at different phases and at different times.
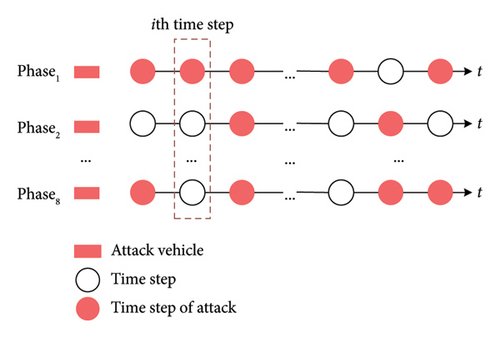
Take the standard intersection with 8 phases shown in Figure 2(b) as the attack subject. We assume that the attacker’s maximal attack capacity is to add one attack vehicle to each phase individually. The attacker could choose to launch the attack at any k ∈ [1, 8] phases. The collaborative attack sequence at a single intersection is illustrated in Figure 5. The attacker might choose to alter or not alter the information of these attack vehicles at each time step. The dashed box shows that the attacker added the attack vehicle at phase 1 at the second time step, but no attack was launched at phases 2 and 8.
The POMDP model of multivehicle collaborative attack at the single intersection is represented as a tuple M = <S, A, Ω, T, O, R, b0>. In our case, the state space of the POMDP is the product of the information of all vehicles at the intersection, which is unavailable for attackers due to the fact that the data of unconnected vehicles are not accessible, namely, S = {s1 × s2 × ⋯×sm}, where sm is the information of the mth vehicle. The POMDP’s observation space is the same as the state space, but it is inferred from the observed data. For attackers, they have the same capabilities for receiving BSMs as the RSUs at their intersections. Also, they can infer the arrival table according to the received BSM set of all CVs. Thus, we consider the arrival table as an observation of the attacker. The observation space is denoted as Ω, where ot ∈ Ω is the agent’s observation at time step t. The action that the attacker could take is to modify the BSMs of the attack vehicle and to decide at which phase to launch the attack. Thus, the action space is the product of 8 attack vehicles’ information set {location, speed, acceleration}, which is indicated as A = {{location1, speed1, acceleration1} × ⋯×{location8, speed8, acceleration8}}.
The reward function is based on state and action, and it measures the preference for certain actions in a given state. In this work, there is a delay due to the effect of the attack action acting on the intersection traffic. As a result, the reward is related to the attack effect, which is measured by computing the CD after taking an action. The reward function will then be designed in Section 4.2 with specificity. In addition, T(s, a, s′) = Pr(s′|s, a) is the transition function. The observation function is denoted as O(s′, a, o) = Pr(o|s′, a). b0 is the initial confidence level.
The problem at the low level can be defined as follows.
Problem 1. Given the observation space Ω, action space A, and the initial observation o0, learn a model to generate an observation-action sequence that can cause heavy congestion.
4.1.2. Problem Formulation for High Level
At the high level, we consider the multiagent decision of the collaborative attack at multiple intersections into a decentralized POMDP (Dec-POMDP) model [31, 32]. As Figure 4(b) shows, there will be a distributed policy to be learned for each agent at each intersection. In particular, the distributed policy is initialized as the pretrained collaborative attack policy for each intersection at lower level, which will accelerate the exploration of collaborative policies by multiple agents. Each agent takes an attack action to act on the multi-intersection environment based on its observation of the intersection where it is located. Then the multi-intersection environment returns a shared reward to all of the agents.
4.2. Collaborative Attack Sequence Generation Model at a Single Intersection
Firstly, to obtain a POMDP model, all tuple elements M = <S, A, Ω, T, O, R, b0> must be specified. For the agent, the observation space Ω and action space A are knowable. The state space S, transition function T(s, a, s′), observation function O(s′, a, o), and the initial confidence level b0 are agnostic for the agent. Therefore, in our paper, we mainly focus on designing the reward function R(s, a) according to the scenario of the collaborative attack and learning the transition function T(s, a, s′) and observation function O(s′, a, o). We use the actor critic method to evaluate the effect of the attack action.
4.2.1. Individual Reward Designing
Due to the large action space in our case and the unknown environment model, we are considering the adoption of an actor-critic method, specifically SAC [18], which is a form of maximum entropy RL. This approach can enhance exploration and prevent convergence to nonoptimal deterministic policies.
4.2.2. SAC Model [18]
4.2.3. Rules of Spoofing Attack
- 1.
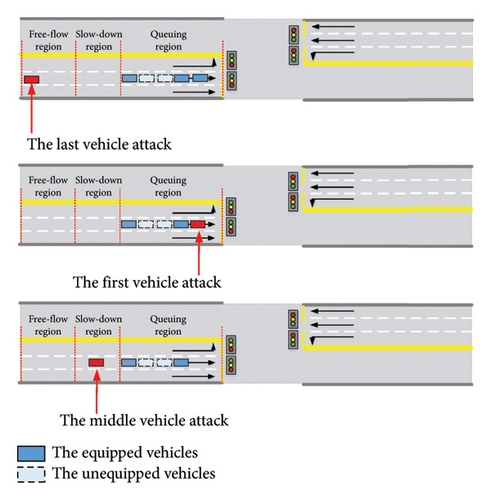
Last vehicle attack T1: An attacker modifies the BSM information of a spoofed vehicle with zero speed and adds it as a late arrived vehicle at any location in the free-flow region, leading to an increase in the queue length in the requested phase.
- 2.
First vehicle attack T2: An attacker adds a spoofed vehicle with a nonzero speed at any location in queuing region as a queuing one, resulting in a decreased queue length in the requested phase.
- 3.
Middle vehicle attack T3: An attacker adds a spoofed vehicle at any location in the slow-down region, resulting in the decrements of vehicle number for the requested phase.
- •
Rule 1: When types of spoofed vehicles are the same type, these vehicles must be at the phases in the same stage.
- •
Rule 2: When types of spoofed vehicles are different, these vehicles must be at the phases in different stages.
When RL agents choose an attack action, they are bound by the above rules.
4.3. Collaborative Attack Sequence Generation Model at Multiple Intersections
4.3.1. Global Reward Designing
4.3.2. MAAC Model [19]
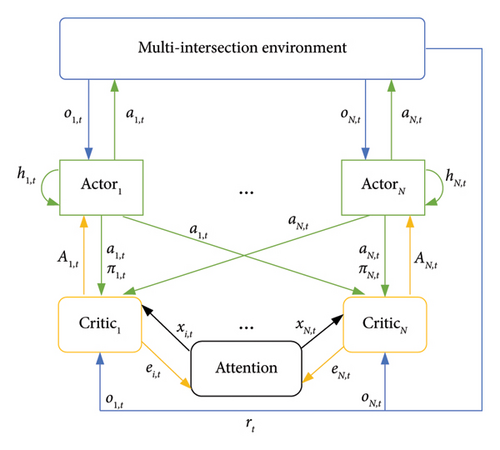
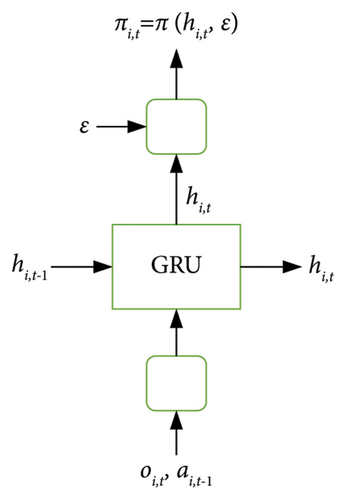
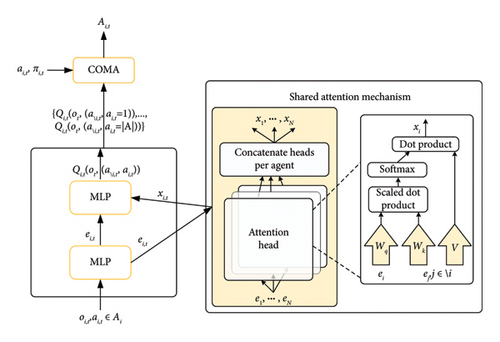
The framework of the multiagent collaborative attack based on the MAAC model is shown in Figure 7. Figure 7(a) shows the multiagent RL architecture with centralized Q-value learning (critic in the yellow box) and distributed policy execution (actor in the green box), where Q-values obtain observations Ω and actions A for all agents and policy π based on the observation data of single agent to output the respective attack actions. Figure 7(b) shows the policy network (actor) that comprises a gated recurrent unit (GRU), and Figure 7(c) illustrates the value network (critic) that is a multilayer perceptron (MLP) with an attention mechanism.
4.3.2.1. Attention
4.3.2.2. Learning With Attentive Critics
4.3.2.3. Multiagent Advantage Function
5. Experiments
In this section, we first provide a detailed introduction to the experimental preparations, including the setup of the experimental environment, intersection settings, RL model setup, and evaluation metrics. We then present and analyze the experimental results, which are divided into three main parts: analysis of attack effectiveness, analysis of attack stealthiness, and analysis of different evaluation metrics for each intersection.
5.1. Experiment Setup
5.1.1. Experiment Environment
First, we use the VISSIM [20] platform for traffic simulation and the COP algorithm for real-time planning and control of signals on a PC, and the COP interacts with VISSIM for simulation of the I-SIG system. Then we employ another GPU server to train both SAC and MAAC models, which are implemented using Python 3.5. During the training, the SAC and MAAC models will interact with the I-SIG environment to generate effective attack sequences. We conducted a 3600-second simulation experiment and collected traffic flow data to compare the performance of multivehicle collaborative attack, single-vehicle attack, and no attack under different attack effectiveness evaluation metrics and the performance of multivehicle collaborative attack and single-vehicle attack under different attack stealthiness evaluation metrics.
5.1.2. Intersection Settings
We employ generic intersection settings to ensure universality. All of these intersections have the same structure and phase configuration as shown in Figure 2(b). According to the DSRC communication range [34], each intersection arm is set at a distance of roughly 300 m from the intersection center. The traffic demand level taken into account is 0.7 v/c (vehicle per capacity), which equates to the medium level of the traffic demand. The PR is set as 75%.
5.1.3. RL Model Setup
At the lower level, for a single agent, we set each vehicle’s attack action as location in [0, 10, 20, 30, …, 300], speed in [0, 5, 10, 15, …, 60], and acceleration in [−10, −9, −8, −7, …, 10]. The observation is the arrival table (as shown in Table 1) evaluated by the attacker from the information of all CVs at the intersection. For example, when the data in the arrival table are presented as shown in Figure 8, then the observation of the attacker can be denoted as {[8, 4, 3, 1, 5, 47, 1, 1], [0, 0, 0, 1, 0, 0, 0, 0], …, [0, 0, 0, 0, 0, 1, 0, 0]}. At the high level, we set the number of collaborative intersections as 4. Each agent at the high level has the same observation and action spaces as those of the single agent at the low level.

5.1.4. Evaluation Metrics
- 1.
Success rate of attack (SR) is the percentage of snapshots with a higher total vehicle delay, denoted as SR = Ndc/Ns × 100%, where Ndc is the number of snapshots with total delay increased and Ns is the number of total snapshots.
- 2.
DT denotes the vehicle delay time, which is calculated by deducting the free-flow travel time FT from the actual time AT that the vehicle spent passing through the intersection. Thus, DT = AT-FT.
- 3.
CD is the maximum value of 8 phase congestion degrees in an intersection, denoted as CD = max{PCDk|k∈[1, 8]}. PCDk = qk/qnormal is the degree of congestion in the kth phase, where qk is the number of vehicles in the queue and qnormal is the constant number of vehicles in the regular queue.
- 4.
AR is the ratio of the number of attacking vehicles Nav to the number of all vehicles Nv at the intersection. Thus, AR can be denoted as AR = Nav/Nv.
- 5.
AF is the frequency of attacks launched by the attacker. It is the amount of attacks that take place per minute, denoted as AF = Nattack/60s.
| Metrics | Definition | Calculation |
|---|---|---|
| Success rate of attack (SR) | The percentage of snapshots with a higher total vehicle delay | SR = Ndc/Ns × 100% |
| Delay time (DT) | The vehicle delay time | DT = AT − FT |
| Congestion degree (CD) | The maximum value of 8 phase congestion degrees in an intersection | CD = max{PCDk|k∈[1, 8]} |
| Attack ratio (AR) | The ratio of the number of attacking vehicles to the number of all other vehicles at the intersection | AR = Nav/Nv |
| Attack frequency (AF) | The frequency of attacks launched by the attacker | AF = Nattack/60s |
Notice that attack effectiveness is measured using SR, DT, and CD, and attack stealthiness is measured using AR and AF. The higher the value of SR, DT, and CD, the stronger the attack effectiveness. The more variable the AR and AF are, the better the attack stealthiness is. The metrics SR and DT refer to the congestion attack evaluation metrics defined in the work of Chen et al. [7]. In contrast, CD, AR, and AF are the evaluation metrics defined in our current work.
5.2. Experimental Results and Analysis
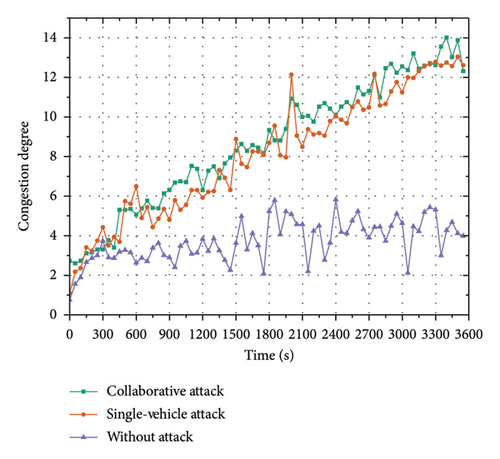
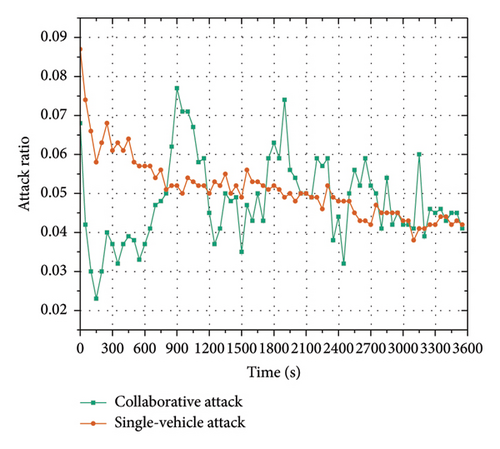
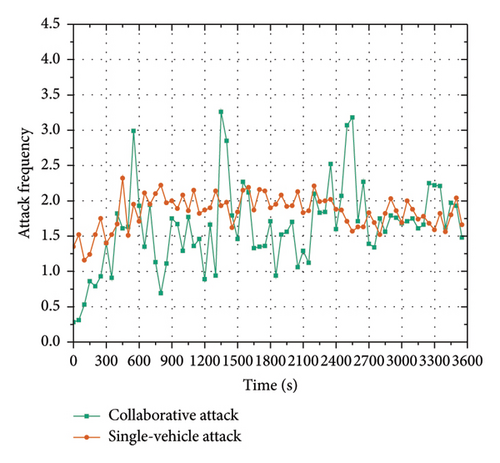
The effectiveness and stealthiness of the collaborative attack model were evaluated first. Here, we compare the attack effectiveness and stealthiness at four intersections under three attack sets. We compare the collaborative attacks that are generated by our collaborative attack model with the single-vehicle attack and without attack, in terms of attack effectiveness and stealthiness. The results are shown in Table 4 and Figures 9(a), 9(b), 10(a), and 10(b).
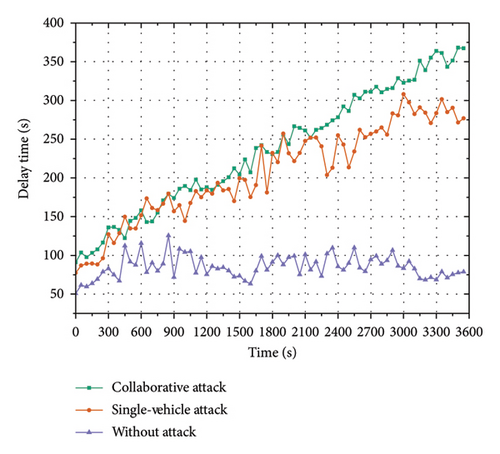
As shown in Table 5, in terms of attack effectiveness, compared to single-vehicle attack, the multivehicle collaborative attack has a higher attack success rate, greater total delay for all vehicles, greater increase in delay, and a higher percentage increase in delay, which indicates that our collaborative attack model is able to generate effective attack sequences. Meanwhile, in terms of the attack stealthiness, the AR and AF of the multivehicle collaborative attack decreased compared to the single-vehicle attack; the AR decreased from 0.087 to 0.063 and the AF decreased from 10 to 6, which is 40% lower and improves the attack stealthiness. This indicates that the collaborative attack generated by our approach can improve the attack stealthiness while ensuring similar attack effectiveness, thus ensuring that the collaborative attack is not easily detected.
| Attack set | Effectiveness | Stealthiness | ||||
|---|---|---|---|---|---|---|
| SR | Total delay | Delay inc. (s) | Delay inc. (%) | AR | AF | |
| Without attack | — | 678.7 | — | — | — | — |
| Single-vehicle attack | 91.0% | 1082.2 | 403.5 | 59 | 0.087 | 10 |
| Multivehicle collaborative attack | 93.2% | 1201.3 | 522.6 | 77 | 0.063 | 6 |
Figure 9 shows the graphs of different attack effectiveness evaluation metrics (average delay (AD) in Figure 9(a) and CD in Figure 9(b)) over time with different attack settings. Figure 10 shows the graphs of different attack stealthiness evaluation metrics (AR in Figure 10(a) and AF in Figure 10(b)) over time with different attack settings. Since the I-SIG system is performed in seconds, we present the experimental results over seconds. The AD in Figure 9(a) represents the average total vehicle delay per second; the intersection CD in Figure 9(b) represents the intersection CD per second; the AR in Figure 10(a) represents the proportion of attack vehicles to the number of all other vehicles at the intersection per time step; and the AF in Figure 10(b) is the number of attacks calculated with a time window of one minute and a sliding step of one second.
5.2.1. Analysis of Attack Effectiveness
Figures 9(a) and 9(b) depict the results of the attack effectiveness. The trends of AD and CD on the time axis under no attack, single-vehicle attack, and multivehicle collaborative attack are compared, respectively. Figures 9(a) and 9(b) show that, in the case of no attack, the global trend of vehicle delay and CD is smooth, whereas, in the case of the single-vehicle attack and the multivehicle collaborative attack, the vehicle delay and CD fluctuate up and down over time and exhibit an increasing trend. Meanwhile, the AD and CD values of the intersection under the multivehicle collaborative attack and the single-vehicle attack are close to each other, and the fluctuation of AD and CD values is smaller for the multivehicle collaborative attack. These experimental results show that the multivehicle collaborative attack has similar attack effectiveness as the single-vehicle attack while causing smoother congestion effects. This is because the single-vehicle attack only launches a continuous attack on one phase (e.g., Phase 6), causing congestion on other phases (Phases 3, 4, 7, and 8) in another stage. In contrast, the multivehicle collaborative attack will attack in multiple phases in concert, causing congestion in all phases of the entire intersection, so it causes less fluctuation in vehicle delay and congestion.
5.2.2. Analysis of Attack Stealthiness
In terms of attack stealthiness, the trends of AR and AF under the single-vehicle attack and the multivehicle collaborative attack are compared, as illustrated in Figures 10(a) and 10(b). From Figure 10(a), we can see that the AR trend for the single-vehicle attack is opposite to the congestion trend and shows a decreasing trend over time. This is because there is only one attack vehicle, and the AR is low when there are more vehicles. The AR trend of the multivehicle collaborative attack fluctuates greatly up and down without any obvious up or down trend, which is because adding attack vehicles will not cause obvious congestion in the case of low traffic flow. In this case, the collaborative attack model will not launch attacks, and thus the AR is 0, whereas in the case of medium traffic flow, the collaborative attack model will add multiple attack vehicles at the same time to cause large congestion. In addition, the AF trend in Figure 10(b) shows that the AF trend is smooth because the single-vehicle attack will continuously launch attacks, while the multivehicle collaborative attack does not launch attacks regularly, so the AF shows irregular fluctuations. In summary, compared with single-vehicle attacks, multivehicle collaborative attacks have irregular and fluctuating ARs and AFs, which are more likely to bypass the congestion attack detection mechanism and thus cause intersection congestion more stealthily.
5.2.3. Analysis of Different Metrics for Each Intersection
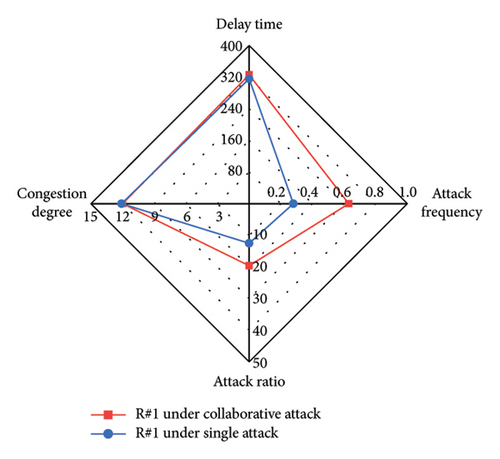
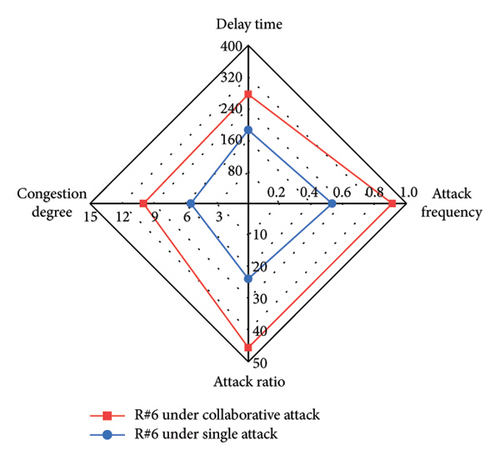
We compare different attack evaluation metrics for each intersection under single-vehicle attack and multivehicle collaborative attack in a radar diagram, as shown in Figure 11. For comparison, we use the inverses of AR and AF, so that larger values of the four metrics indicate better attack performance. The comparison shows that the DT, CD, AR, and AF values are larger for each intersection under the collaborative attack compared to the single-vehicle attack. This indicates that the collaborative attack can achieve good attack effectiveness and ensure better stealthiness. Table 6 shows the mean value and standard deviation value of DT and CD at six intersections under different attacks. By comparison, we can see that the mean values of DT and CD under the collaborative attack are larger than those under single-vehicle attack, and the standard deviation of DT and CD under the collaborative attack is smaller than that under single-vehicle attack. This indicates that the collaborative attack can cause congestion at all intersections in the area evenly.
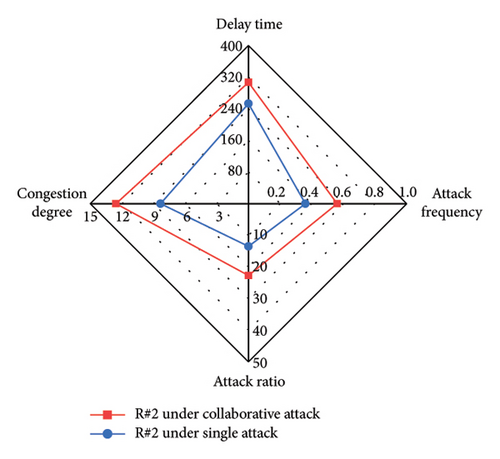
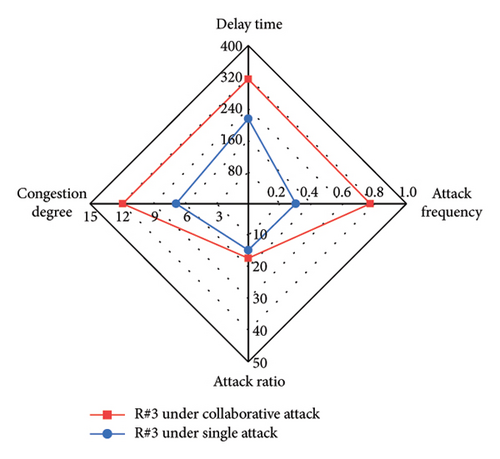
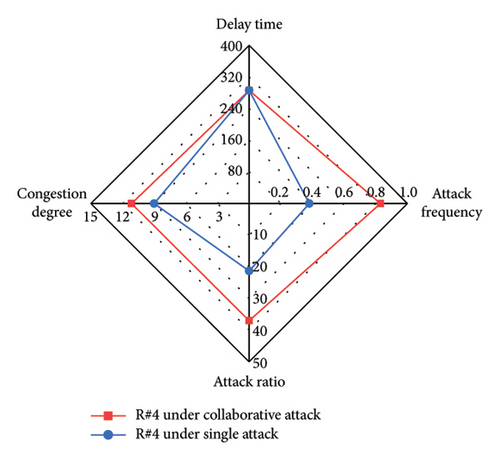
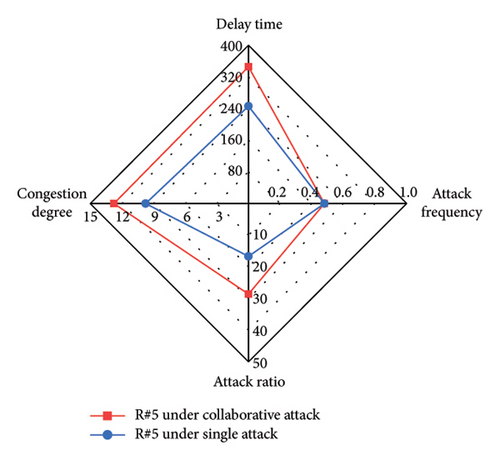
| Type of attack | Delay time | Congestion degree | ||
|---|---|---|---|---|
| Mean | Standard deviation | Mean | Standard deviation | |
| Single-vehicle attack | 250.3 | 42.8 | 9.15 | 2.26 |
| Collaborative attack | 309.3 | 23.5 | 12.5 | 1.01 |
6. Defense Discussion
This section will discuss the direction of defense against the collaborative attack, which is characterized by high attack effectiveness and high attack stealthiness. For the collaborative attack studied in this paper, the data spoofing attack needs to be detected first. The traffic flow features under the collaborative attack can be extracted, and further, the collaborative attack can be detected based on the deep learning attack detection model. In addition, based on the attack detection, the attack can be located and filtered. In the I-SIG system, attackers can not only modify their CV information to launch spoofing attacks but also launch remote springboard attacks through the network to tamper with the information of other vehicles to launch spoofing attacks. Therefore, data spoofing attacks can be localized and filtered at the same time, and then the data of the arriving table can be corrected, so as to achieve security protection for the I-SIG system.
7. Conclusion and Future Work
In this paper, we reveal a multivehicle collaborative data spoofing attack against I-SIG systems. Also, in order to explore complex multivehicle multistep collaborative attacks, we propose an automatic collaborative attack sequence generation model based on multiagent RL to generate collaborative attack sequences. We first propose a hierarchical kind of approach to train an independent single-intersection collaborative attack model at the low level and then train a multi-intersection collaborative attack model at the high level based on the pretrained single-intersection collaborative attack model. Then POMDP-based modeling is performed for multivehicle multistep attacks. Finally, the mainstream multiagent RL method, MAAC, is proposed to train the collaborative attack model based on it, so as to realize the automatic generation of collaborative attack sequences. We conducted experiments on the attack effectiveness and attack stealthiness of the collaborative attack model on the VISSIM simulation platform. The experimental results show that the collaborative attack can have good attack effectiveness and, at the same time, good stealthiness compared with single-vehicle attacks. In the future, we will explore the automatic generation model of multi-intersection collaborative attacks with different topologies so as to provide better security protection for data contamination attacks.
Conflicts of Interest
The authors declare no conflicts of interest.
Author Contributions
Yalun Wu and Yingxiao Xiang contributed equally to this work.
Funding
This research was supported by Central Funds Guiding the Local Science and Technology Development (236Z0806G), Fundamental Research Funds for the Central Universities (10.13039/501100012226) (2023JBMC055), National Natural Science Foundation of China (10.13039/501100001809) (62372021), Natural Science Foundation of Hebei Province (10.13039/501100003787) (F2023105005), and Open Competition Mechanism to Select the Best Candidates.
Acknowledgments
This work was supported by the Central Funds Guiding the Local Science and Technology Development under Grant No. 236Z0806G, the Fundamental Research Funds for the Central Universities under Grant No. 2023JBMC055, the National Natural Science Foundation of China under Grant No. 62372021, the Hebei Natural Science Foundation under Grant No. F2023105005, and the Open Competition Mechanism to Select the Best Candidates in Shijiazhuang, Hebei Province, China.
Open Research
Data Availability Statement
The data that support the findings of this study are available from the corresponding author upon reasonable request.


