Enhancing Lithium-Ion Battery Performance with Ni1−xFexS-Biocarbon Composites: Improving Cycle Stability and Rate Capability through Multilayered Biocarbon Nanosheet Formation and Fe Doping
Abstract
Given the growing demand for high-performance, stable, eco-friendly, and cheap lithium-ion batteries (LIBs), the development of affordable and environmentally friendly high-performance anode materials for LIBs has garnered considerable attention. Herein, to address this need, NiS (known for its high theoretical capacity) was grown on a porous biocarbon (BC) matrix to afford a highly conductive LIB anode material capable of accommodating the charge/discharge-induced volume changes and thus ensuring cycle stability. The cycling performance of this material (NiS–BC) was further enhanced by doping with Fe. The best-performing (Ni0.8Fe0.2S–BC) anode demonstrated an initial discharge capacity of 1,374.4 mAh g−1 at 0.5 A g−1, which further increased to 1,796.4 mAh g−1 after 100 cycles, and the origins of this high performance were probed by instrumental analysis. The results contribute to the development of next-generation LIBs for applications requiring high capacity, high output, and long-term cycle stability, such as electronic devices, electric vehicles, and energy storage systems. Moreover, the use of BC aligns with a prominent trend in modern battery research, namely, the development of secondary batteries simultaneously exhibiting high performance and sustainability.
1. Introduction
Lithium-ion batteries (LIBs) are extensively employed to power portable electronics owing to their high energy density, stable cycle life, and environmental friendliness and typically contain graphite anodes. Graphite exhibits excellent cycling performance; however, its theoretical specific capacity is extremely low (372 mAh g−1) [1], and it features a lithium-ion intercalation voltage close to the deposition potential of lithium metal, thus posing the risk of short-circuiting due to lithium dendrite formation [2]. Moreover, with the emergence of electric vehicles and large-scale energy storage systems, focus has shifted to searching other suitable materials owing to graphite’s inability to provide the gravimetric and volumetric energy/power densities required for operating such systems.
Silicon and transition metal oxides/sulfides have been widely studied as potential replacements for graphite in LIB anode materials [3]. In particular, NiS offers the advantages of a high theoretical capacity (591 mAh g−1) and rate capability, eco-friendliness, abundant resource availability, and low costs [4]. However, this material, similar to other nickel sulfides (e.g., NiS2 and Ni2S3), exhibits several drawbacks. The mechanical disintegration and pulverization of NiS due to volume expansion during cycling and polysulfide formation at high current densities can lead to irreversible capacity loss. Additionally, the low cycle stability and electrical conductivity of existing metal sulfide electrodes limit the commercialization of nickel sulfide as an anode material for large-scale energy storage and other applications [5, 6]. Therefore, diverse material engineering strategies, such as nanostructure design and manufacturing, hybridization, heterometal doping, and coating or compositing with carbon-based materials, have been devised to improve the electrochemical performance of NiS and other metal sulfides. For example, the cycling stability and conductivity of transition metal sulfide-based electrodes can be increased by hybridization with graphene, reduced graphene oxide, carbon nanotubes (CNTs), conductive polymers, and other conductive materials [7, 8, 9]. The diverse structures, high elasticity, and high mechanical strength of carbon-based materials allow them to act as buffers alleviating volume expansion and thereby increasing electrode stability. In addition, carbon-based materials provide numerous active sites for lithium-ion accommodation and conductive pathways for electron and lithium-ion transport, thereby improving the electrode kinetics/reversibility and helping suppress side reactions [4, 10, 11, 12]. Xia et al. [4] tackled the excessive volume expansion and polysulfide dissolution during the cycling of nickel sulfide anodes by hybridization with chestnut shell fluff-derived biochar (CSF), which acted as an effective electron transmission channel and inhibited polysulfide dissolution. The best-performing CSF-NiS/C anode prepared using a glucose-assisted hydrothermal method and annealing featured specific capacities of 1,522.8 and 295 mAh g−1 at current densities of 0.1 and 3 A g−1, respectively, that is, exhibited a high-rate capability. Fan et al. [12] used a two-step solvothermal method to synthesize a NiCo2S4@CNTs composite with a three-dimensional network structure featuring NiCo2S4 nanoflakes anchored onto the CNT surface via electrostatic adsorption. This composite structure helped mitigate the volume expansion of NiCo2S4 and increase electrode conductivity, resulting in good cycle stability (783 mAh g−1 after 80 cycles at 0.1 A g−1) and rate performance (517 mAh g−1 at 1 A g−1). Specifically, recent studies have reported improvement in electrochemical performance of battery materials, such as enhancement of electrical conductivity, structural stability, and lithium-ion diffusion, which have been achieved through doping of a small amount of cost-effective Fe. Thus, Fe doping has proven to be an effective method for enhancing battery material performance, contributing significantly to the advancement of battery technology. For example, Fe doping in LiMnPO4/C leads to a high energy density and good discharge capacity retention, and that in anode materials like Li4Ti5O12 results in conductivity and long-term cycle stability improvement [13, 14]. Guo et al. [15] synthesized Fe-doped NiSe2@porous graphene and reported that Fe doping improved the material’s electrical conductivity, structural stability, and lithium-ion diffusion, thereby enhancing its electrochemical performance. The combination of Fe doping with porous graphene further amplified these properties, resulting in good cycle stability, high capacity retention, and an overall improved battery performance.
Carbon-based synthetic nanomaterials that are commonly used as electrode components are mostly manufactured from nonrenewable fossil resources and cannot be easily commercialized because of the low yields and complexity of the corresponding production processes, high raw material and processing costs, and challenging synthesis conditions [16]. With the progress in energy storage technologies, LIB research has increasingly focused not only on improving performance and stability but also on enhancing eco-friendliness and cost efficiency. The above goals can be realized using electrodes containing sustainable biomass-derived biocarbon (BC), an environmentally friendly and cheap porous material that is typically obtained from cellulose, hemicellulose, and lignin and exhibits a large specific surface area and easily modifiable surface properties. Moreover, BC contains small amounts of oxygen, hydrogen, nitrogen, and sulfur, which enhance its physical adsorption characteristics, electrical conductivity, and chemical stability. The availability of various precursors and ease of processing result in a multitude of BC applications [17, 18, 19], for example, the use of BC as an energy source helps reduce carbon emissions and pollution, offering significant environmental and cost benefits [19]. However, the impact of BC on lithium-ion storage mechanisms has not been explored, and BC performance is broadly variable and often limited by low efficiency and poor cycling stability. Consequently, various strategies have been proposed to enhance the performance of porous BC-based electrodes and address these challenges [20, 21].
Herein, the capacity and rate performance of a porous BC matrix manufactured from hard kraft pulp using the oxidative pretreatment of cellulose with 2,2,6,6-tetramethylpiperidine-1-oxyl (TEMPO) were improved by surface decoration with hydrothermally grown NiS. The NiS–BC anode not only exhibited high conductivity, but also tolerated cycling-induced volume changes because of the multilayered porous structure of BC. Furthermore, the Ni1−xFexS–BC (x = 0.1, 0.2, and 0.3) composites prepared by doping NiS with Fe exhibited further enhanced high-rate performance and cycle stability and therefore concluded to be promising LIB anode materials.
2. Materials and Methods
2.1. Materials
Dried hardwood kraft pulp was obtained from the M Company (Republic of Korea). NaBr (99%), FeCl3·6H2O (97%), and ethylene glycol (99.9%) were purchased formfrom Samchun Chemicals (Republic of Korea). TEMPO (≥98%) and L-cysteine (97%) were used from Sigma-Aldrich (Germany). NiCl2·6H2O (99.95%) was purchased formfrom Alfa Aesar. NaClO (11%–15% available chlorine) and KOH were purchased from Alfa Aesar (USA), Sungju Industrial (Republic of Korea), and Showa Chemical Co., Ltd. (Japan). NaCl (99%) and CaCl2 (97%) were purchased from Junsei Chemical Co., Ltd. (Japan).
2.2. Preparation of TEMPO-Oxidized Cellulose Nanosheet
TEMPO oxidation was performed as described elsewhere [22]. Dried hardwood kraft pulp (300 g) was dispersed in distilled water containing TEMPO (1.5 g) and NaBr (2.5 g), and the suspension was stirred for 10 min, supplemented with a 5.4% NaClO solution to initiate oxidation, stirred for 10 min, supplemented with 1 M KOH, and stirred until the pH reached 10. After oxidation for 2 hr, the dispersion was neutralized with distilled water and freeze-dried to obtain a TEMPO-oxidized cellulose nanosheet. Subsequently, to achieve complete cellulose carbonization, the nanosheet was stabilized at 250°C at a heating rate of 10°C min−1 under N2, held at this temperature for 2 hr, and then carbonized in the same atmosphere at 700°C for 5 hr to obtain a BC powder.
2.3. Preparation of Ni1−xFexS–BC Anode Materials
The Ni1−xFexS–BC (x = 0, 0.1, 0.2, and 0.3) composites were prepared via a simple one-step hydrothermal reaction. BC (30 mg) was dispersed in ethylene glycol (35 mL) by stirring for 24 hr, and the dispersion was supplemented with NiCl2·6H2O (2 mmol), stirred for 30 min, supplemented with L-cysteine (2 mmol), stirred for 2 hr, transferred to a 100 mL autoclave, and heated at 200°C for 24 hr for sulfurization. The resulting precipitate of NiS–BC (x = 0) was washed five times with ethanol and distilled water through centrifugation and then dried in a vacuum oven at 70°C for 12 hr. The production of pure NiS follows the same manufacturing process as NiS–BC, except for the step of adding BC. The Ni1−xFexS–BC (x = 0.1, 0.2, 0.3) composites were synthesized similar to NiS–BC. After L-cysteine addition and stirring for 1.5 hr, FeCl3·6H2O (0.1–0.3 mmol) was added, and the mixture was stirred for an additional 30 min. The total stirring time after L-cysteine addition was fixed at 2 hr. The synthesis of NiS nanoparticles on the BC surface requires it to feature an appropriate density of oxygenated groups, which facilitate the dispersal of these nanoparticles and prevent their agglomeration. However, overly high densities of oxygenated functional groups decrease the thermal stability of BC and may cause structural collapse during battery operation. Therefore, to achieve an optimal oxygenation degree, an oxidation time of 2 hr was used [23].
2.4. Material Characterization
Crystal structures were probed by X-ray diffraction (XRD; Bruker AXS, D8 Discover with GADDS) using Cu Kα radiation (wavelength = 1.54 Å) and Raman spectroscopy (excitation at 532 nm, RAMANtouch, Nanophoton, Japan). Morphologies were analyzed using field emission scanning electron microscopy (FESEM; Carl Zeiss, LEO-1530), energy-dispersive X-ray spectroscopy (EDS; Carl Zeiss, Oberkochen, Germany), field emission transmission electron microscopy (TEM; 200 kV, JEM 2100 F, JEOL, Japan), and selected area electron diffraction (SAED) analysis. The identities and chemical states of surface elements were analyzed using X-ray photoelectron spectroscopy (XPS; Ulvac-PHI, PHI Quantera-II) and Fourier transform infrared spectroscopy (Thermo Fisher Scientific, Nicolet Summit, USA). For thermogravimetric analysis (KEP Technologies, LABSYS evo, France), the sample was heated to 800°C at a heating rate of 10°C min−1 in a flow of air or N2. N2 adsorption–desorption isotherms were recorded using a Micromeritics ASAP 2420 instrument.
2.5. Battery Assembly and Characterization
A CR2032 coin-type half-cell was assembled for LIB testing using Li foil as a counter electrode, a polypropylene membrane (Celgard 2400) as a separator, and 1.15 M LiPF6 in ethylene carbonate:dimethyl carbonate (3 : 7, v/v) containing 10% fluorinated ethylene carbonate as an electrolyte. For anode fabrication, a slurry prepared by mixing 80 wt% Ni1−xFexS–BC with 10 wt% poly (acrylic) acid (Mw ≈ 250,000, 35 wt% in H2O, Aldrich) and 10 wt% Super P carbon black (99+%, Alfa Aesar) in distilled water was coated on copper foil, dried, and pressed. Thereafter, the electrodes were cut into 2 cm2 disks and assembled in an Ar-filled glove box with oxygen and moisture levels below 1 ppm.
Cyclic voltammetry (CV; WBCS 3000 L, WonATech) measurements were performed at a scan rate of 0.1 mV s−1 within a voltage range of 0.05–3.0 V. Galvanostatic charge–discharge testing (WBCS 3000 L, WonATech) was conducted within a cutoff voltage range of 0.01–3.0 V (versus Li+/Li) at a current density of 0.5 A g−1, with the first five cycles performed at 0.1 A g−1 and rate capability testing conducted at 0.1, 0.2, 0.5, 1, and 2 A g−1. All the electrochemical tests were conducted at 25°C. Electrochemical impedance spectra (EIS) were recorded using an Autolab electrochemical workstation (PGSTAT 302N, Netherlands) in a frequency range of 0.01 MHz–100 kHz at an amplitude of 10 mV.
3. Results and Discussion
3.1. Characterization of Biocarbon Nanosheet
Figures 1(a) and 1(b) show the FESEM micrographs of the TEMPO-oxidized cellulose and BC nanosheets. The former sample exhibited a porous surface structure, whereas the latter featured a surface with densely packed wrinkles, which was ascribed to shrinkage caused by polymer decomposition during carbonization. According to a previous report [23], materials with rough surface textures are advantageous for the attachment and capture of metallic substances.
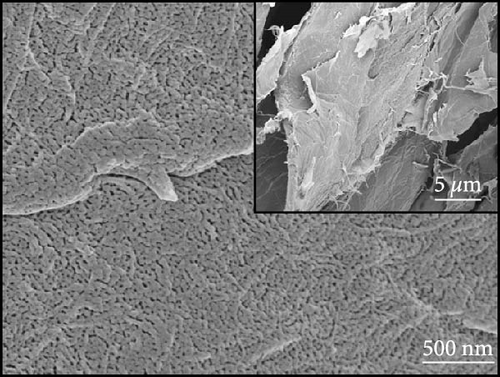
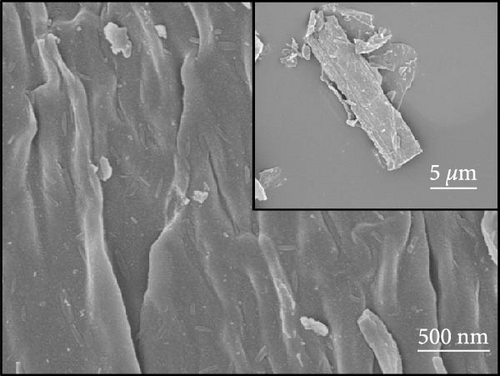
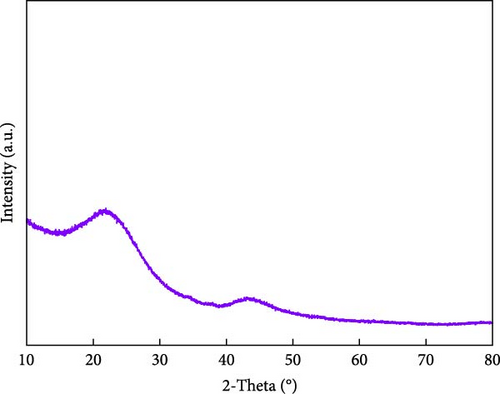
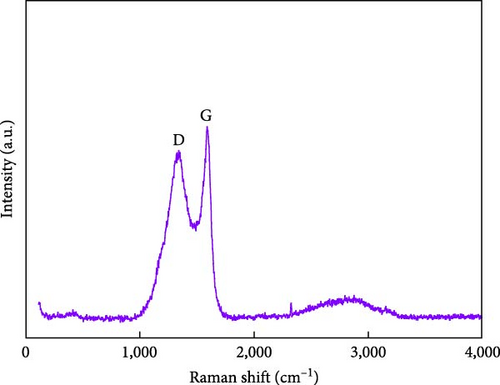


Figures 1(c) and 1(d) show the XRD pattern and Raman spectrum of the BC nanosheets. The two broad diffraction peaks at 2θ = 23° and 44° correspond to reflections from the (002) and (100) planes of graphite and indicate a very low degree of crystallinity. The Raman spectra of carbonaceous materials typically exhibit two major peaks, namely, the G and D bands at 1,580 and 1,350 cm−1, respectively, which can be used to assess the degree of graphitization and structural disorder. The G band corresponds to well-aligned graphite crystals with Csp2─Csp2 bonds, which appear in all graphitic materials, whereas the D band is linked to structural defects or amorphous carbon present in disordered BC structures [24]. Additionally, the crystallinity or disorder degree of carbon materials can be determined from the D-to-G band intensity ratio [25]. For BC, this ratio was 0.88, indicating a graphitization degree higher than that of amorphous carbon. The surface chemical composition of BC was analyzed using XPS (Figures 1(e) and 1(f)). The C 1s spectrum (Figure 1(e)) was deconvoluted into signals of C─C/C─H (284.4 eV), C─O (285.3 eV), C─O (286.0 eV), C═O (286.7 eV), and C═O/C─O─C (288.0 eV) groups [26, 27, 28, 29, 30], revealing that oxygenated functional groups remained on the BC surface even after oxidation followed by thermal treatment. The deconvoluted O 1s spectrum (Figure 1(f)) featured the peaks of C═O, COOH, C─O─C, O═C─O groups and oxygen atoms in adsorbed water at 531.1, 532.2, 533.4, 534.7, and 536.1 eV, respectively [27]. The formation of functional groups, such as COOH, O─H, O─C, and O═C, on the BC surface affects the chemical bonds and reaction pathways of the material. This modification of the surface physicochemical properties can enhance performance in applications such as catalysis, energy storage, and sensors [4, 10, 17, 18, 23]. Consequently, BC was used as a conductive material, and NiS and a small amount of Fe-doped Ni1−xFexS, were synthesized on the surface of BC. This step was processed with the aim to use Ni1−xFexS as an anode material for high-capacity LIBs.
3.2. Characterization of Ni1−xFexS–BC (x = 0, 0.1, 0.2, and 0.3) Anode Materials
The XRD patterns of NiS and Ni1−xFexS–BC (x = 0, 0.1, 0.2, and 0.3) featured NiS peaks at 30.1°, 34.6°, 45.9°, 53.5°, and 73.1°, corresponding to the (100), (101), (102), (110), and (202) crystal planes, respectively (Figure 2(a)). The structure of crystalline NiS is similar to that of the molybdenum carbide MAX phase and belongs to the hexagonal P63/mmc space group. In this structure, each Ni2+ ion is bonded to six equivalent S2− ions to form a mixture of corner-, edge-, and face-sharing NiS6 octahedra, and each S2− ion is bonded to six equivalent Ni2+ ions [31]. The incorporation of Fe did not result in crystal structure changes, and no diffraction peaks due to impurities were observed, which suggested that the Fe atoms either occupied substitutional sites in the NiS lattice or were in an amorphous state that did not participate in X-ray scattering [32]. Fe doping decreased the XRD peak intensity without affecting the crystal structure, which was ascribed to the atomic radius of Fe exceeding that of Ni. Fe doping causes lattice distortion and may create lattice defects, disrupting lattice regularity and affecting the intensity and position of XRD peaks [33]. Additionally, the crystal peak intensities of NiS–BC and Ni1−xFexS–BC were lower than those of pure NiS owing to the low content of NiS in the NiS–BC and Ni1−xFexS–BC materials [34]. Based on Bragg’s equation, the interplanar distances (d-spacings) of the (102) crystal plane for NiS, NiS–BC, Ni0.9Fe0.1S–BC, Ni0.8Fe0.2S–BC, and Ni0.7Fe0.3S–BC were calculated as 0.1981, 0.1981, 0.1982, 0.1982, and 0.1983 nm, respectively, decreasing with the increasing Fe content. Figures 2(b), 2(c), 2(d), and 2(e) show the FESEM images of NiS–BC and Fe-doped Ni1−xFexS–BC. The particles remained uniformly distributed on the BC surface and decreased in size with increasing Fe content. In the case of Ni0.8Fe0.2S–BC (Figure 2(d)), ~50-nm Ni0.8Fe0.2S particles were uniformly distributed on the BC surface. Each element was clearly and distinguishably identified in the EDS mappings of NiS–BC (Figures 2(f)) and Ni0.8Fe0.2S–BC (Figures 2(g)). The uniform distribution of nanoparticles on the BC surface facilitated electron transfer and rapid diffusion within the electrode, ultimately enhancing the capacity of LIBs. Furthermore, these nanoparticles can effectively accommodate volume changes during charge–discharge processes, thereby extending the cycle life of LIBs [35].
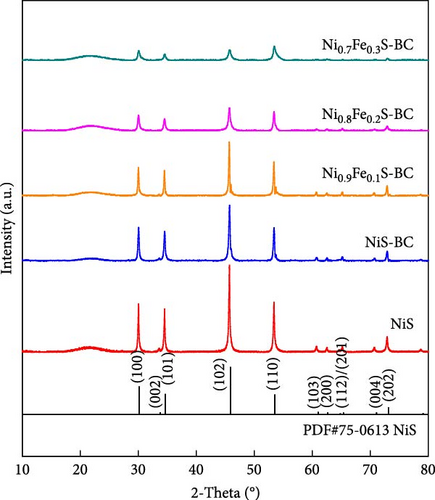

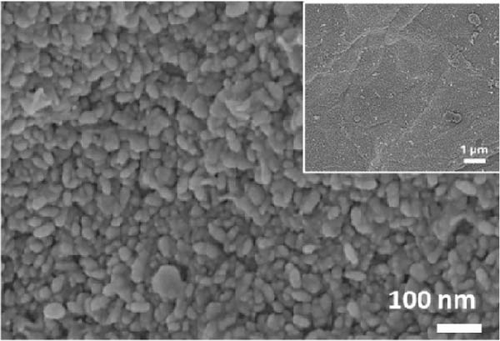
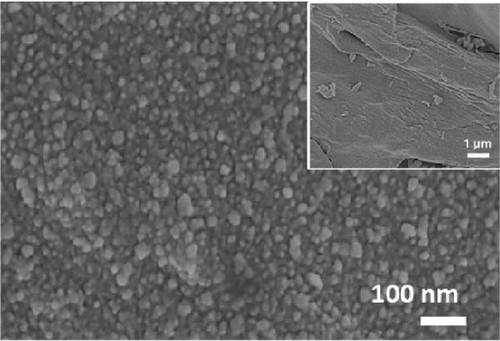
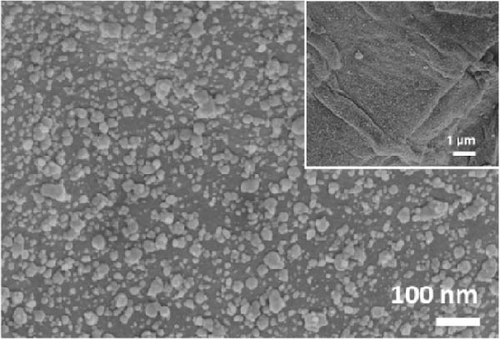
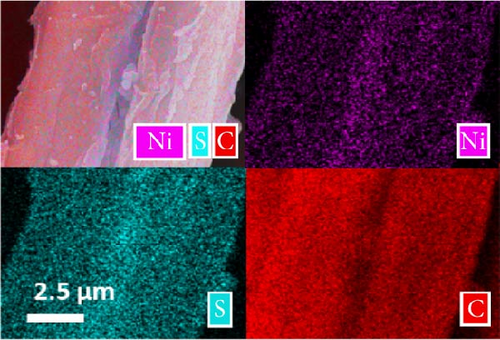

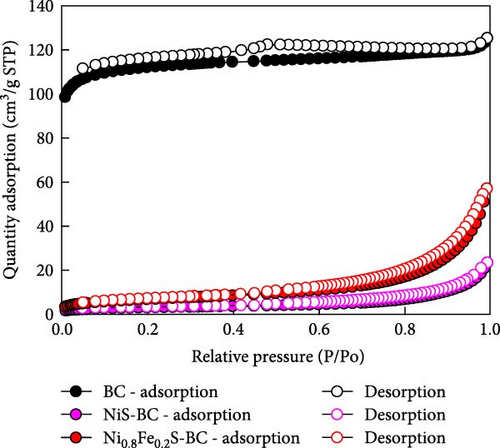
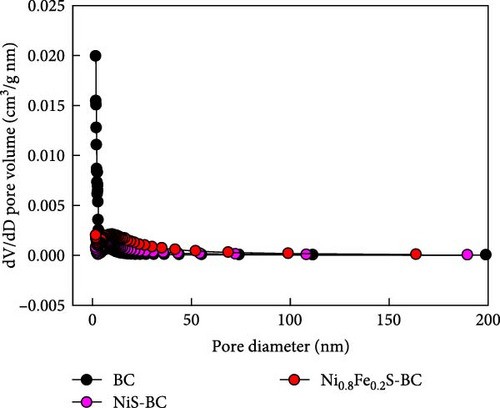
Figure 3 displays the nitrogen adsorption–desorption isotherm and Barrett–Joyner–Halenda (BJH) pore size distribution of the BC, NiS–BC, and Ni0.8Fe0.2S–BC anode materials. The adsorption and desorption curves of BC (Figure 3(a)) show a relatively flat region between the relative pressure range of about 0.0–0.8, followed by a slight increase. This pattern is characteristic of the international union of pure and applied chemistry (IUPAC) Type II adsorption isotherm. The graph suggests that the biochar has strong macroporous properties, indicating that it likely has a relatively small pore structure or that adsorption primarily occurs on the surface. The shape of the graphs for the NiS–BC and Ni0.8Fe0.2S–BC anode materials are generally classified as Type IV adsorption isotherms according to the IUPAC definition. This indicates adsorption behavior in materials with a porous structure, particularly characteristic of mesoporous or macroporous materials. Additionally, the specific surface areas of NiS–BC and Ni0.8Fe0.2S–BC both decreased compared to BC, while the specific surface area of Fe-doped Ni0.8Fe0.2S–BC was slightly higher than that of NiS–BC. This suggests that the decrease in the specific surface area is due to the growth of NiS on the surface of BC, and the increase in the specific surface area of Ni0.8Fe0.2S–BC compared to NiS–BC indicates that Fe doping contributes to enhancing the specific surface area. The largest specific surface area was recorded for BC (445.8 m2 g−1), which was followed by those of NiS–BC (10.3 m2 g−1) and Ni0.8Fe0.2S–BC (23.9 m2 g−1). Figure 3(b) shows the pore size distribution curves of BC, NiS–BC, and Ni0.8Fe0.2S–BC anode materials. The pore size distribution of the three samples is centered around 10 nm, indicating the presence of mesopores (2–50 nm) [36]. Additionally, the total pore volume of Ni0.8Fe0.2S–BC is larger than that of NiS–BC, suggesting that Fe doping plays a significant role in increasing pore density. Therefore, the Ni0.8Fe0.2S–BC electrode, with its abundant mesopores and high specific surface area, is likely to facilitate the diffusion of electrolyte ions, which, in turn, could enhance capacitance.
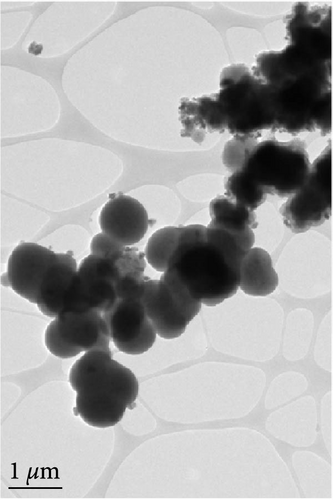
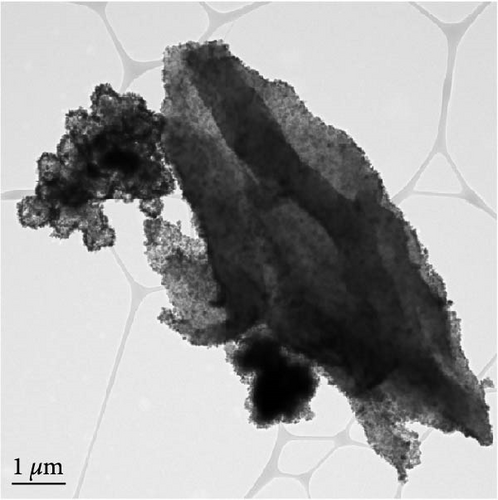
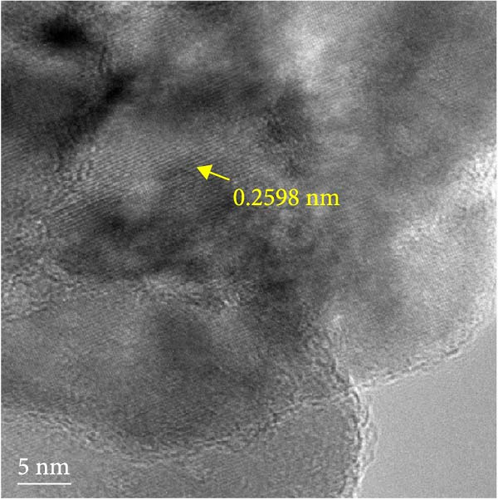
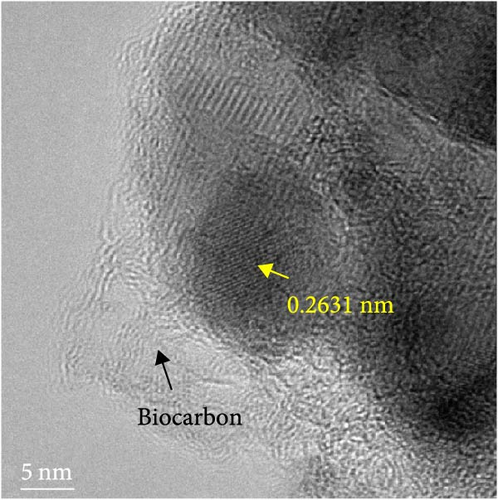
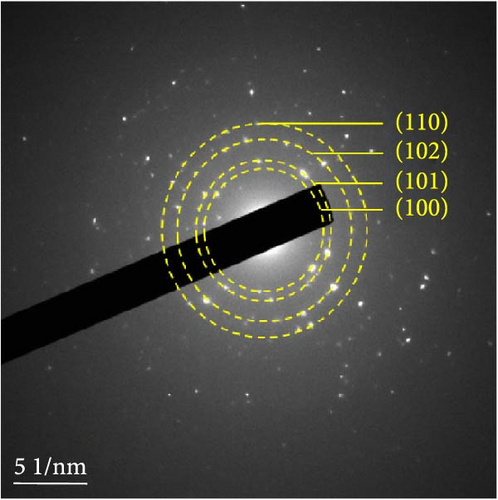
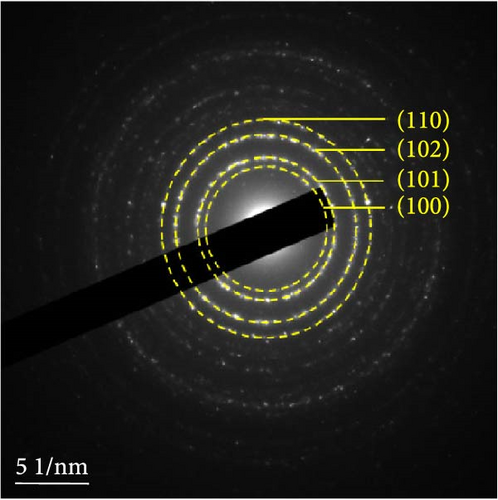
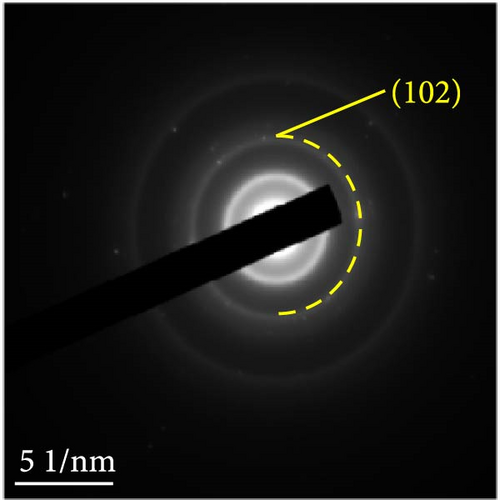
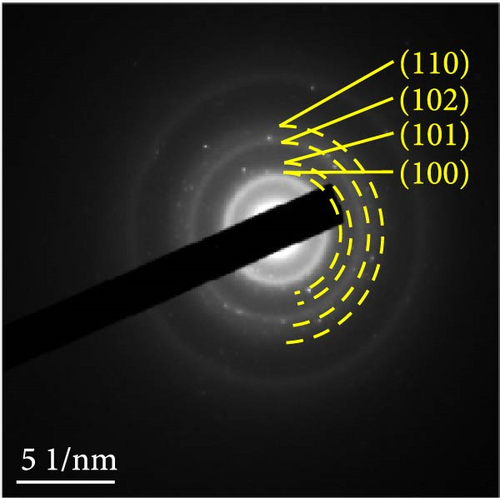
The detailed morphological features, elemental distributions, and crystalline phases of NiS and Ni0.8Fe0.2S–BC were probed by TEM, high-resolution TEM (HRTEM), and SAED analysis. The TEM imaging and EDS mapping of NiS (Figures 4(a) and 4(g), respectively) showed that the NiS particle size ranged from a few tens of nanometers to 300 nm and that Ni and S were evenly distributed, indicating the successful synthesis of NiS. The Ni0.8Fe0.2S particles, which were significantly smaller than the NiS particles, were successfully deposited onto the surface of the BC nanosheet (Figure 4(b)). EDS mapping results (Figure 4(h)) showed a uniform distribution of each element in Ni0.8Fe0.2S–BC. The uniform distribution of Ni0.8Fe0.2S on the BC surface enabled high electrical conductivity and, hence, high electrochemical performance during charge–discharge. The HRTEM images of NiS (Figure 4(c)) and Ni0.8Fe0.2S–BC (Figure 4(d)) revealed lattice fringes of 0.2598 and 0.2631 nm, respectively, corresponding to the crystalline (101) plane. The SAED patterns of NiS (Figure 4(e)) and Ni0.8Fe0.2S–BC (Figure 4(f)) featured several concentric rings corresponding to the (100), (101), (102), and (110) crystalline planes of NiS (inside to outside). The d-spacings calculated from these patterns were 0.2971, 0.2592, 0.1980, and 0.1712 nm for NiS and 0.2979, 0.2598, 0.1988, and 0.1722 nm for Ni0.8Fe0.2S–BC, corresponding to the (100), (101), (102), and (110) interplanar spacings of NiS, respectively. This result was consistent with that of XRD analysis (d-spacings obtained by both methods are listed in Table 1). Interestingly, the lattice spacing of Ni0.8Fe0.2S–BC exceeded that of NiS across all crystallographic planes, which was ascribed to the substitution of Ni for Fe and enabled the accommodation of more lithium ions and facilitated their smoother diffusion, thus allowing rapid charging and discharging [37]. Additionally, the smooth movement of lithium ions within the electrode material maintained the stability of the crystal structure of the electrode, ultimately extending battery life and improving capacity [38, 39].
| Samples | (hkl) | d-spacing (Ǻ) | |
|---|---|---|---|
| Experimental values of XRD | Calculate from HRTEM | ||
| NiS | (100) | 2.9711 | 2.9797 |
| (101) | 2.5923 | 2.5984 | |
| (102) | 1.9805 | 1.9885 | |
| (110) | 1.7120 | 1.722 | |
| Ni0.8Fe0.2S–BC | (100) | 2.9720 | 2.9985 |
| (101) | 2.5930 | 2.6319 | |
| (102) | 1.9820 | 1.9920 | |
| (110) | 1.7138 | 1.7237 | |


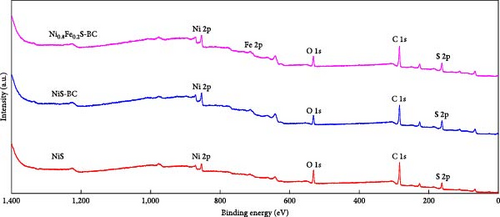
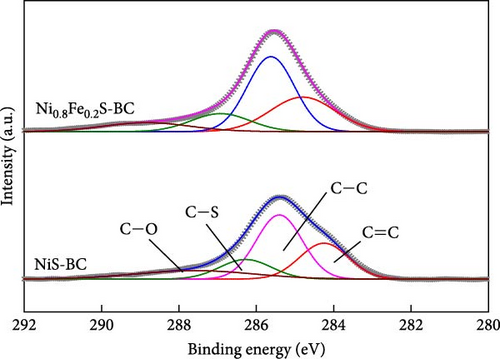
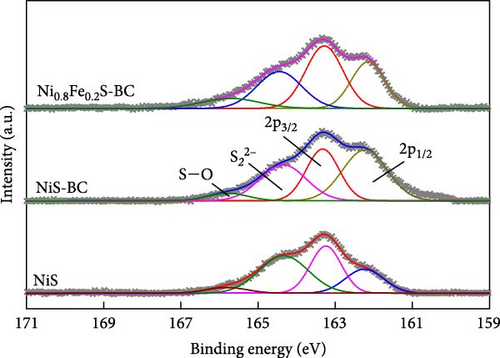
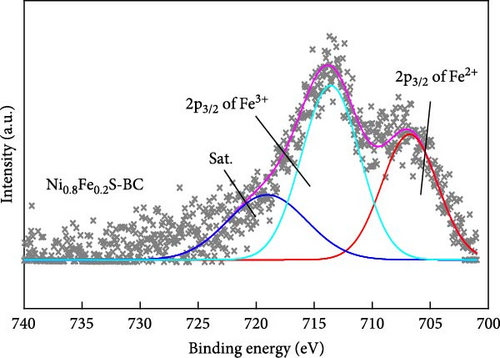
The valence states of the elements within NiS, NiS–BC, and Ni0.8Fe0.2S–BC were probed by XPS. The survey spectra (Figure 5(a)) of all three samples exhibited Ni 2p, S 1s, and C 1s peaks, whereas the spectrum of Ni0.8Fe0.2S–BC also exhibited Fe 2p peaks, confirming the successful introduction of Fe. Figures 5(b), 5(c), 5(d), and 5(e) show the C 1s, Ni 2p, S 2p, and Fe 2p spectra of NiS–BC and Ni0.8Fe0.2S–BC. The C 1s spectra of NiS–BC and Ni0.8Fe0.2S–BC (Figure 5(b)) were deconvoluted into the peaks of sp2-bonded carbon (C═C, 284.6 eV), epoxy and alkoxy groups (C─O, 285.6 eV), and carbonyl and carboxylic groups (C═O, 288.1 eV) [29]. The Ni 2p spectrum of NiS (Figure 5(c)) featured Ni2+ 2p3/2 and Ni3+ 2p1/2 peaks at 854.5 and 871.8 eV, respectively; Ni3+ 2p3/2 and Ni2+ 2p1/2 peaks at 856.5 and 874.4 eV, respectively; and satellite peaks at 860.9 and 878.6 eV [40]. Ni3+ can be formed by the adsorption of negatively charged oxygen onto NiS surface and/or negatively charged interstitial oxygen. The introduction of Fe resulted in Ni3+ peak weakening and was therefore concluded to reduce Ni3+ and thus increase structural stability [40], which was expected to improve cycling performance. Additionally, the two satellite Ni peaks (860.9 and 878.6 eV) indicated a mixed valence state of Ni [41, 42]. The Ni3+/Ni2+ ratio of Ni0.8Fe0.2S–BC was estimated as 37.2%, exceeding that of NiS–BC (40.3%) and indicating an enhanced electron transport capability [42]. The S 2p spectra (Figure 5(d)) of NiS, NiS–BC, and Ni0.8Fe0.2S–BC featured the peaks of metal–sulfur bonds (161.6 and 162.4 eV), S22− (164.3 eV), and sulfate species produced by surface oxidation (165.6 eV) [43]. The Fe 2p spectra (Figure 5(e)) featured peaks at 706.8 and 713.6 eV, which were attributed to 2 p3/2 of Fe2+ and 2 p3/2 of Fe3+, respectively, and a satellite peak at 718.9 eV [44]. These XPS results indicate that all samples were synthesized as intended.

3.3. Electrochemical Performance of Ni1−xFexS–BC Anodes
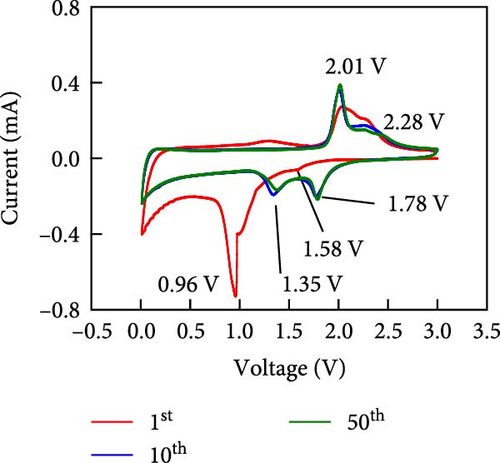

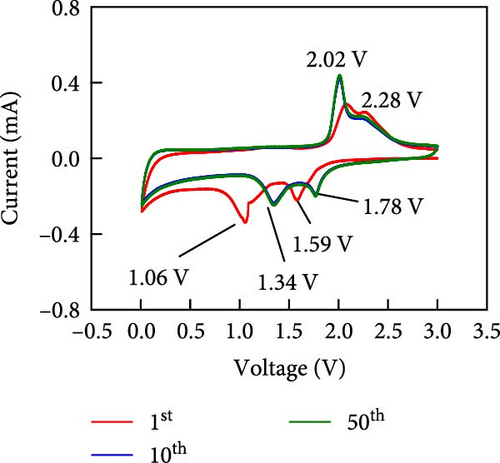
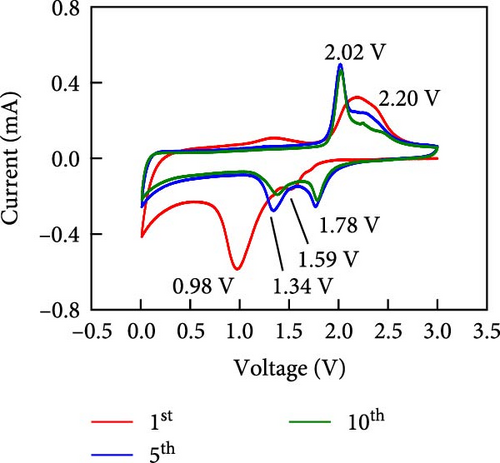
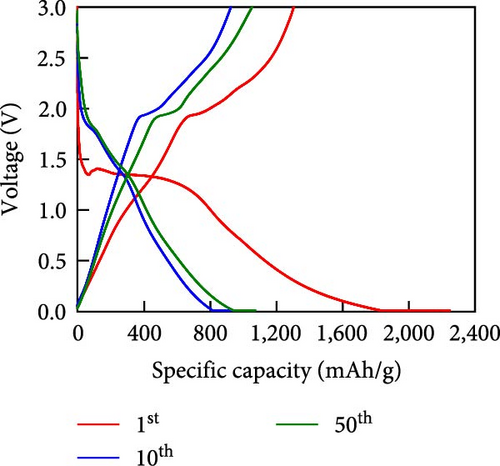
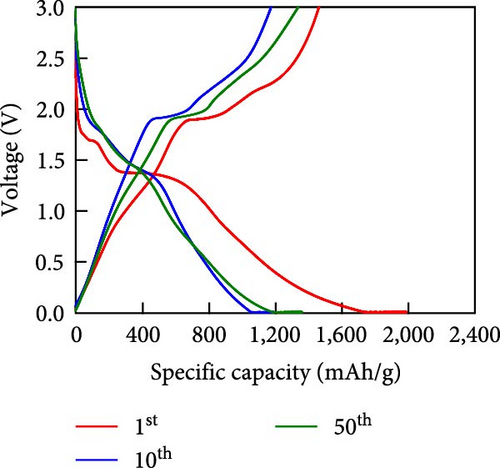
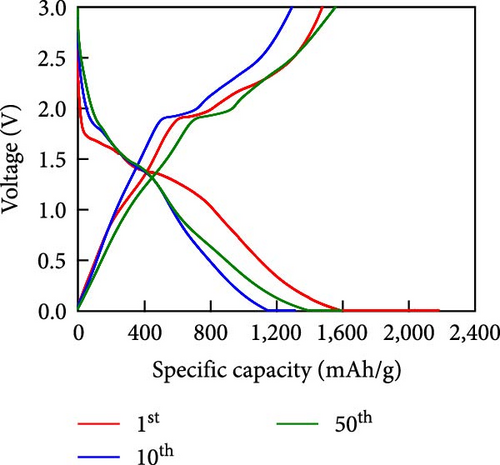
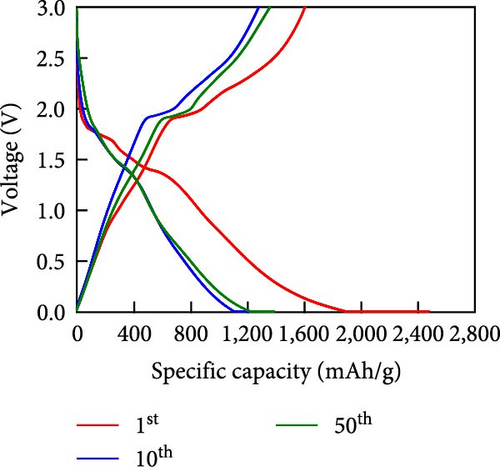
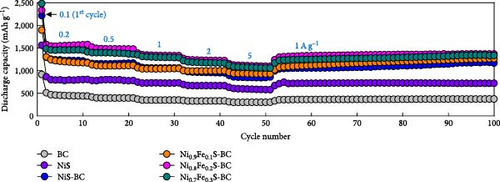
Other anodes such as Ni1−xFexS–BC anodes exhibited redox behaviors similar to that of the NiS–BC anode owing to their similar elemental composition and identical sulfidation strategies. The CV curve of Ni1−xFexS–BC (Figures 6(b), 6(c), and 6(d)), recorded during the first anodic scan, featured two irreversible cathodic peaks at ~1.0 and 1.58 V, corresponding to Li+ intercalation into the Ni1−xFexS–BC interlayer and electrolyte decomposition caused by the formation of an SEI layer, respectively [45, 46, 47]. In the anodic process during the initial cycle, Li+ extraction occurred at 2.08 and 2.28 V. The strong overlap of the peaks appeared at 2.01 and 2.28 V in the 5th- and 10th-cycle CV curves of the Ni0.8Fe0.2S–BC anode, compared to the Ni0.9Fe0.1S–BC and Ni0.7Fe0.3S–BC anodes, indicating the high electrochemical reversibility of the Ni0.8Fe0.2S–BC anode. Figures 6(e), 6(f), 6(g), and 6(h) display the charge–discharge profiles of the NiS–BC and Ni1−xFexS–BC anodes. The first cycle of these profiles was measured at 0.1 A g−1, and the subsequent cycles were recorded at 0.5 A g−1. The NiS–BC exhibited two voltage plateaus (at ~1.35 and 0.9 V) during the first discharge, in agreement with the results of CV measurements. In subsequent cycles (0.5 A g−1), both electrodes exhibited relatively stable voltage plateaus at ~1.78 and 1.35 V, which were more extended in the case of Ni1−xFexS–BC. This behavior indicated that the capacity characteristics of Ni1−xFexS–BC were superior to those of NiS–BC. The initial discharge capacities of the NiS–BC and Ni0.8Fe0.2S–BC electrodes at 0.1 A g−1 were 2,248.6 and 2,179.4 mAh g−1, respectively. As cycling progressed, both electrodes showed discharge capacity increases relative to the 10th cycle (0.5 A g−1), and by the 50th cycle, the discharge capacities of NiS–BC and Ni0.8Fe0.2S–BC reached 944 and 1,388 mAh g−1, respectively. These capacities are considerably higher than the theoretical capacity of NiS. The discharge capacity exceeding the theoretical capacity of NiS can be attributed to the LiOH film formed at the interfaces of metallic Ni particles generated after discharge. This LiOH film participates in the lithium storage reaction, contributing to the additional capacity. The main reaction contributing to this additional capacity is the conversion reaction LiOH + 2Li+ + 2e− = Li2O + LiH [48, 49].
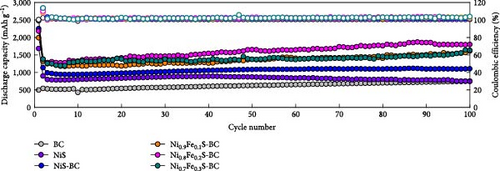
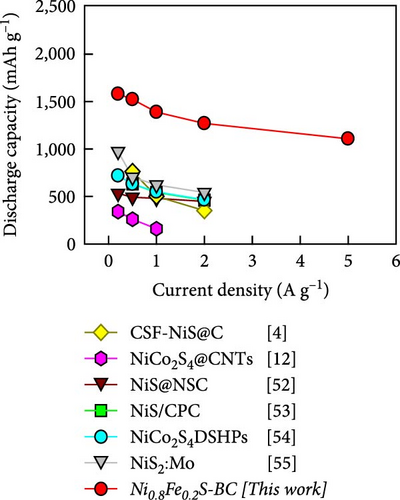
Figure 6(i) shows the rate performances of the electrodes over a current density range of 0.2–5.0 A g−1. The capacity of both the electrodes decreased as the current density increased owing to the limited diffusion-driven reactions at high discharge currents. The Ni0.8Fe0.2S–BC electrode demonstrated a high discharge capacity and the best rate performance across various current densities, retaining ~72.1% of its initial capacity as the current density increased from 0.2 to 5.0 A g−1. Conversely, the corresponding values for the BC, NiS, NiS–BC, Ni0.9Fe0.1S–BC, and Ni0.7Fe0.3S–BC electrodes were 58.5%, 68.5%, 69.1%, 71.6%, and 69.9%, respectively. The superior high-rate performance and capacity of the Ni0.8Fe0.2S–BC electrode were attributed to the rapid diffusion of lithium ions and effective electron transfer caused by the fine dispersion of the Ni0.8Fe0.2S nanoparticles on the BC surface and the optimal Fe doping. Additionally, after measuring the cycles at various current densities and returning to a current density of 1 A g−1, the Ni0.8Fe0.2S–BC anode demonstrated discharge capacities of ~1,327 and 1,363 mAh g−1 after the 60th and 100th cycles, respectively. These values confirmed that this anode showed excellent cycling stability even when the current density was returned to 1 A g−1. Figure 6(j) shows the electrode cycling performances at 0.5 A g−1, revealing that the Ni0.8Fe0.2S–BC electrode exhibited the best characteristics, maintaining a discharge capacity of 1,796.4 mAh g−1 after 100 cycles, which corresponded to a capacity retention of 130.7%. The increase in the anode capacity during cycling was attributed to the (trans)formation of phases within the active materials and resulting interlayer spacing expansion, which facilitated ion insertion and enhanced electrical conductivity. These structural changes improved the mobility of ions, such as Li+, leading to increased capacity over repeated cycles [50, 51]. Figure 6(k) presents the specific capacities of different NiS-based anodes at various current densities. The specific capacity of the Ni0.8Fe0.2S–BC anode drastically exceeded the values reported elsewhere and did not considerably change with the increasing current density, indicating good high-rate characteristics [4, 12, 52, 53, 54, 55]. The Ni0.8Fe0.2S–BC anode retained ~70% of its capacity as the current density increased from 0.2 to 5.0 A g−1. The good high-rate performance, capacity, and cycle durability of the Ni0.8Fe0.2S–BC anode were attributed to its superior conductivity, multilayer structure, and structural stability provided by Fe doping, which facilitated rapid diffusion of Li+ and efficient electron transfer. These results indicate that Ni0.8Fe0.2S–BC is a promising material for the fabrication of next-generation high-performance LIBs.
3.4. Kinetic Properties of Ni0.8Fe0.2S–BC Anode

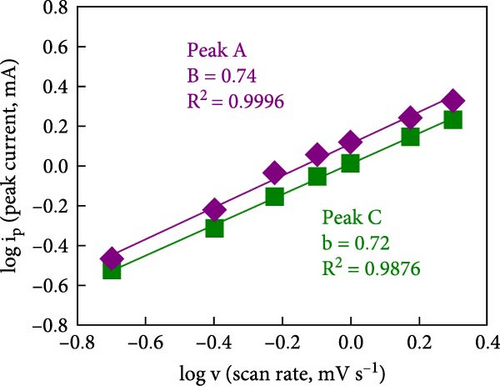
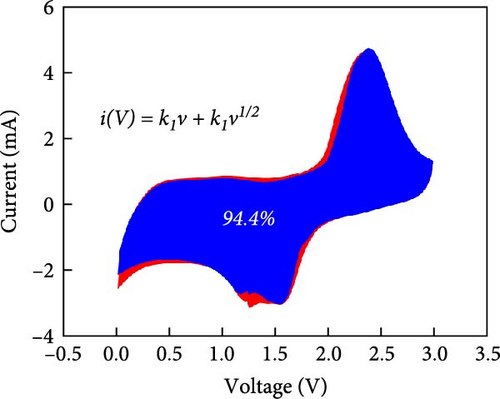
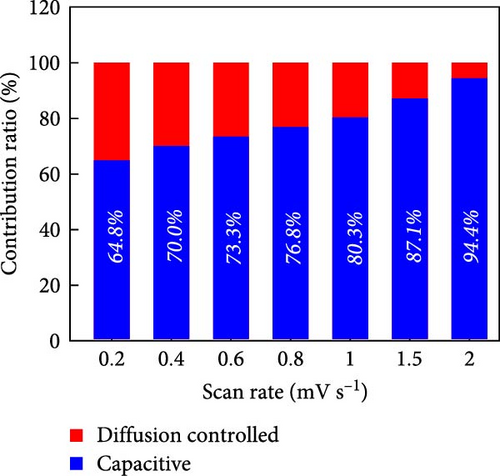
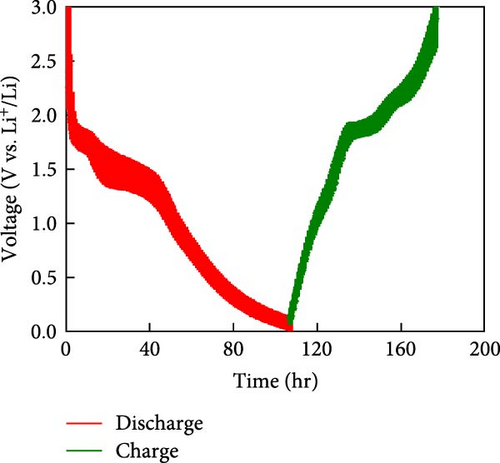
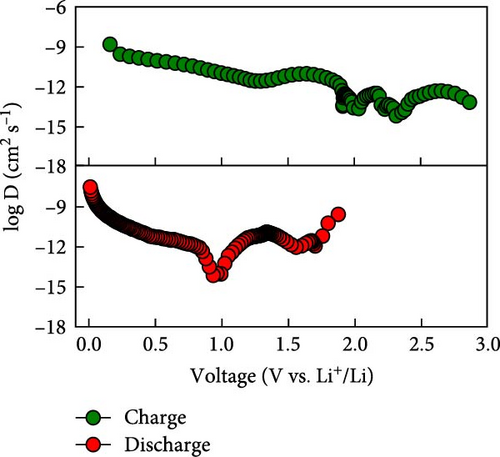
To rationalize the high-rate performance of the Ni0.8Fe0.2S–BC anode, we calculated Li+ diffusion coefficients (DLi+) using the galvanostatic intermittent titration technique. The corresponding curves for lithiation and delithiation were recorded at voltages of 0.01–3.0 V at 0.1 A g−1 and used to determine DLi+ according to Fick’s second law (Figures 7(e) and 7(f)) [61, 62]. During lithiation, DLi+ decreased and exhibited a sharp decline at a reduction potential of ~1.35 V. The values observed during delithiation exceeded those observed during lithiation and decreased near a reduction potential of 1.84 V (Figure 7(f)). The calculated average DLi+ values during lithiation and delithiation were 6.4192 × 10⁻¹⁰ and 2.7777 × 10⁻¹¹ cm2 s−1, respectively. These values are greater than those reported for nickel sulfide-based anodes [7, 48]. These excellent results of the Ni0.8Fe0.2S–BC anode are attributed to the acceleration of lithium-ion (Li+) diffusion due to the inclusion of porous BC and the abundant oxygen vacancies provided by doped Fe, which facilitated the formation of trivalent ions during charging and discharging [63].
3.5. Analysis of the Material and Electrode after Cycling
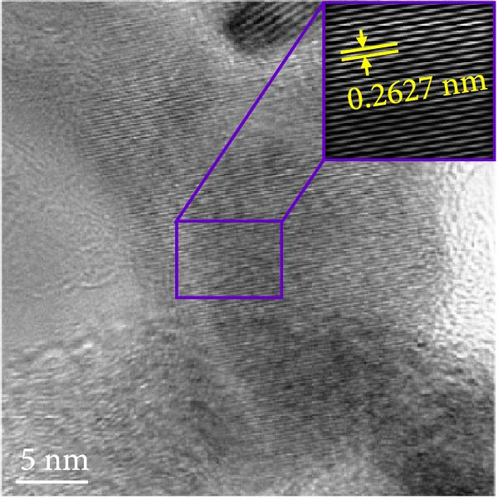
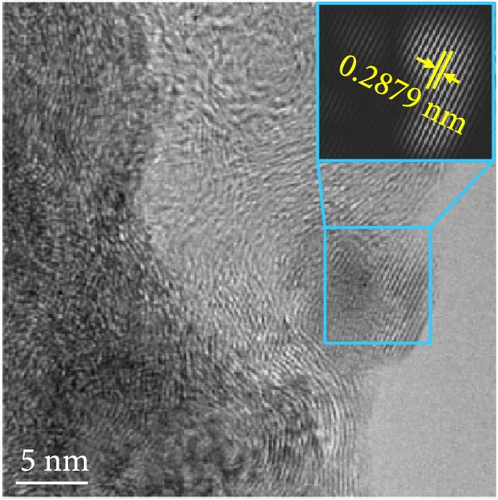
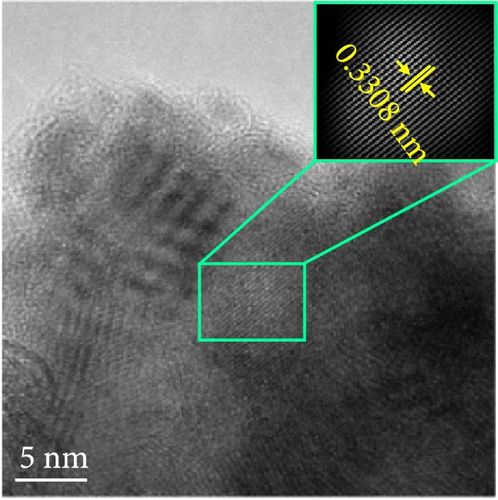
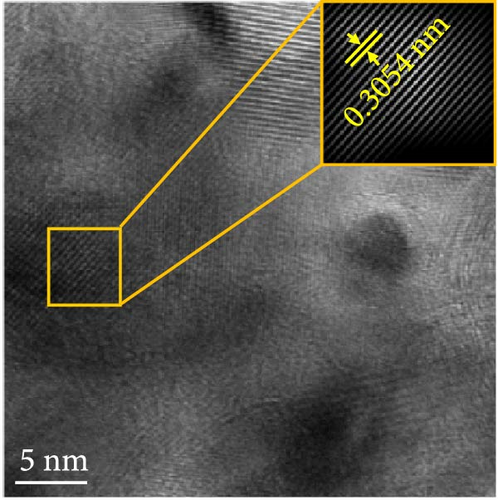
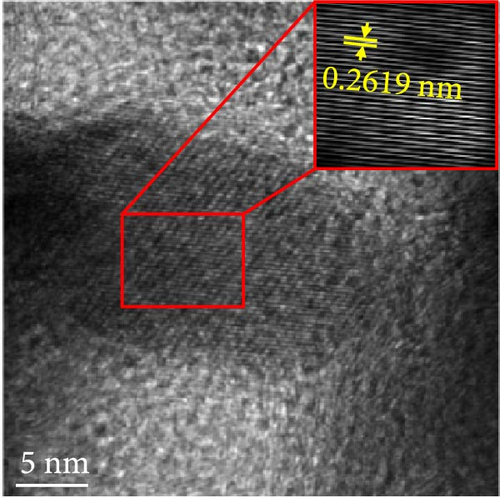
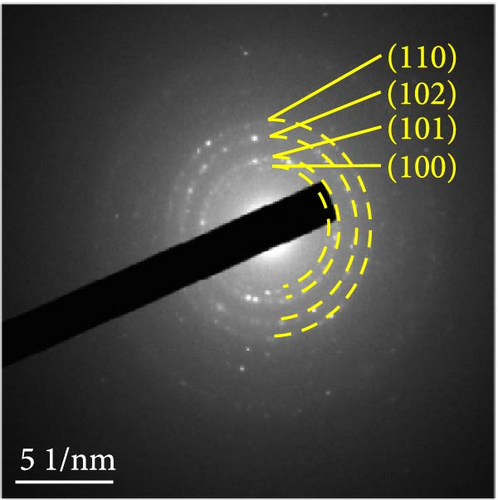
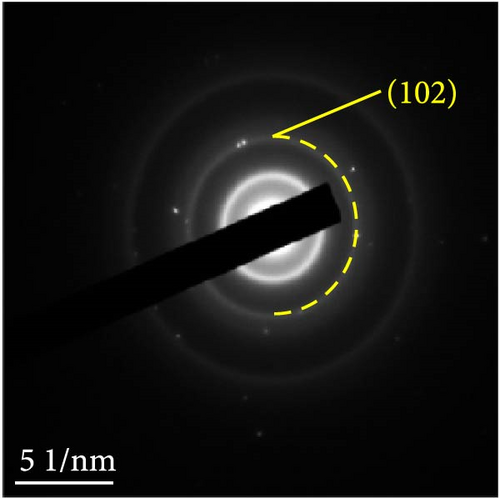
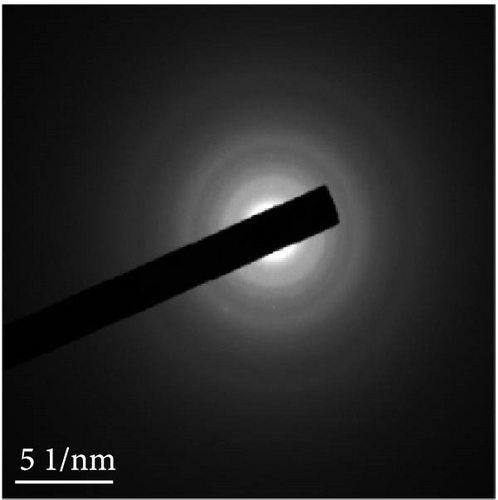
The changes in the crystal structure of the Ni0.8Fe0.2S–BC anode during cycling were probed by subjecting samples tested at various charge and discharge voltages during the initial cycles to ex situ XRD analysis. After discharge to 1.35 V (Dis.1) and 0.01 V (Dis.2), the cells were charged to 1.98 V (Ch.1) and 3.0 V (Ch.2), respectively, and disassembled (Figure 8(a)). The XRD pattern of the pristine electrode displayed peaks corresponding to the (100), (101), (102), and (110) crystal planes of NiS. Upon discharge to 0.01 V, these peaks disappeared, and new peaks at ~26.9° and 31.2° emerged, corresponding to Li2S and indicating conversion from NiS. In addition, no Ni signals were observed after discharge to 0.01 V, which suggested that Ni may have transitioned to a low-crystallinity or amorphous state after the initial discharge. As charging progressed to 3.0 V, the intensity of the NiS peaks increased; however, they were not as distinct as those observed for the pristine electrode (P), indicating that the amorphous structure was maintained even after charging. This amorphous structure reportedly aids in accommodating the volume change of transition metal–oxide anodes and provides more reaction sites for Li storage, thus enhancing the electrochemical performance of the electrode material [64]. To validate the results of the ex situ XRD measurements, we conducted ex situ HRTEM and SAED analyses. Figures 8(b), 8(c), 8(d), 8(e), and 8(f) show the HRTEM images of the Ni0.8Fe0.2S–BC anode in the pristine state (P), after discharge to 1.35 V (Dis.1) and 0.01 V (Dis.2), and after charge to 1.98 V (Ch.1) and 3.0 V (Ch.2). The interplanar distances in these electrodes were determined as 0.2627, 0.2879, 0.3308, 0.2854, and 0.2619 nm, respectively, and attributed to the NiS (100), Ni3S2 (110), Li2S (111), Ni3S2 (110), and NiS (100) crystal planes, respectively. SAED analysis (Figures 8(g), 8(h), 8(i), 8(j), and 8(k)) revealed a transition to an amorphous state upon discharge and the reestablishment of crystallinity upon charge. After charging to 3.0 V, the crystallinity of the pristine (P) state was not fully regained, which agreed with the results of ex situ XRD analysis. This finding demonstrated that Ni0.8Fe0.2S–BC could maintain its crystal structure even after the initial lithiation and delithiation, indicating that the introduction of Fe and resulting lattice distortion prevented cation aggregation and phase separation.

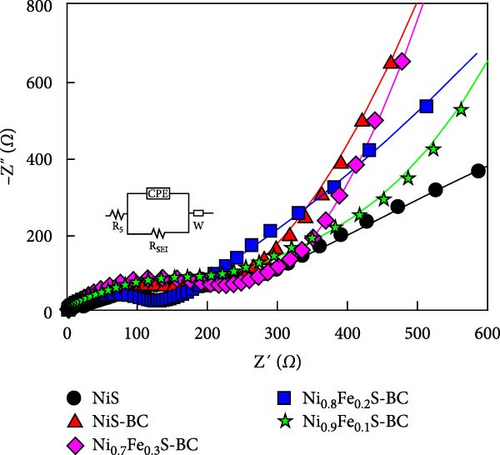
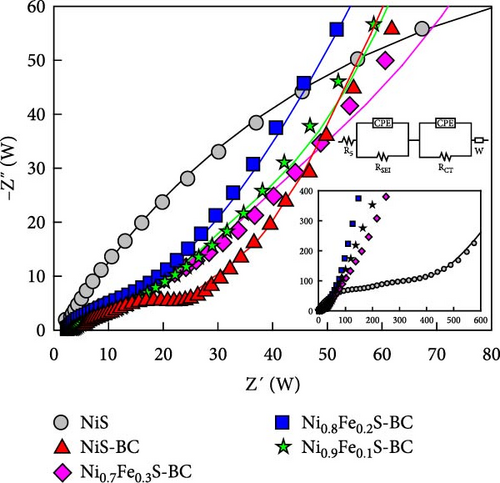
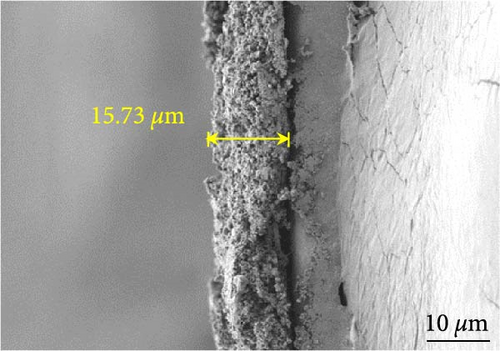
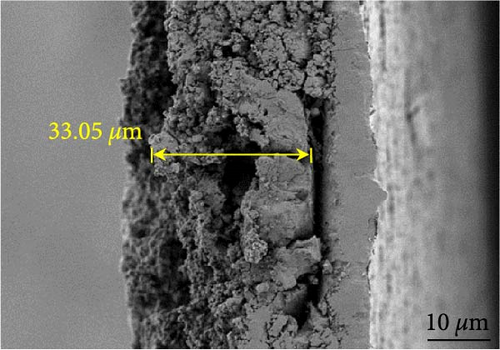
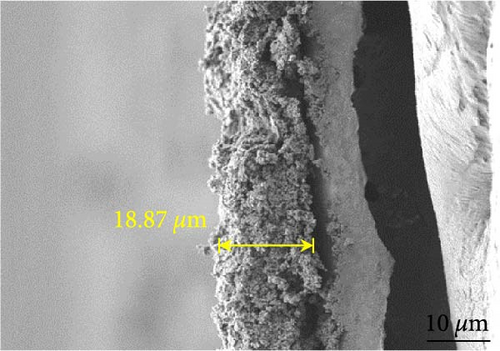
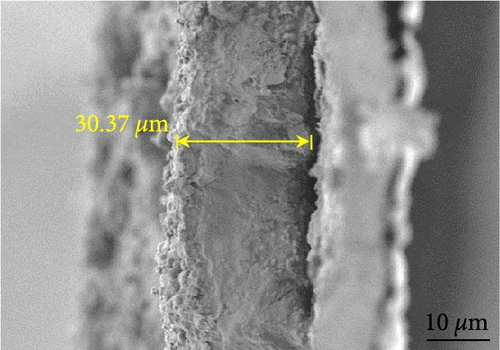
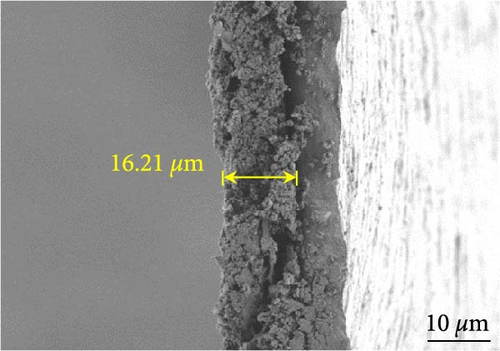
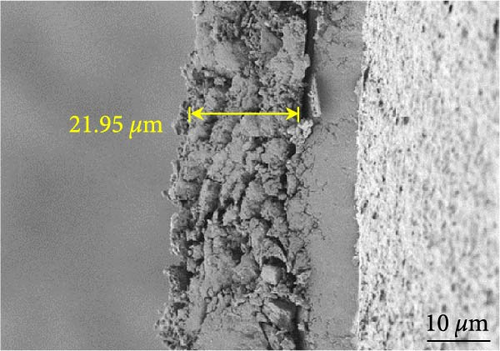
Figures 9(a) and 9(b) show the Nyquist plots of the NiS, NiS–BC, and Ni1−xFexS–BC anodes in the pristine state and after three cycles. The plots of pristine samples comprised a semicircle (charge transfer resistance, Rct) and a straight line segment tilted at 45° (related to Warburg impedance (W) associated with Li+ diffusion) [65]. The diameters of the semicircles (Rct) for the NiS–BC and Ni0.8Fe0.2S–BC electrodes were smaller than those of NiS owing to the the porous structure and conductivity of BC. After three cycles, the plots of all the electrodes showed two overlapping semicircles, indicating SEI formation during the charge–discharge process (represented as RSEI). For all the electrodes, the semicircle diameter decreased upon cycling because of the penetration of the electrolyte into the electrode surface after cycling and the resulting changes in ion concentration. The Nyquist plots were fitted using the NOVA program (version 1.10.4, Metrohm Autolab B.V.) and the equivalent circuit shown in Figures 9(a) and 9(b), with the results listed in Table 2. To evaluate the volume expansion of the electrodes during cycling, we subjected fresh and 100-fold cycled NiS, NiS–BC, and Ni0.8Fe0.2S–BC electrodes to cross-sectional FESEM imaging (Figures 9(c), 9(d), 9(e), and 9(f)). After 100 cycles, the NiS electrode exhibited a significant volume expansion of ~110%, whereas the NiS–BC and Ni0.8Fe0.2S–BC electrodes showed a volume expansion of only 60.9% and 35.4%, respectively. The introduction of BC created a multilayer structure within the anode material, and the pores in this structure mitigated the volume changes during charging and discharging, leading to a high capacity and cycle stability. Additionally, the volume expansion shown by the Fe-doped anode was lower than that in the undoped NiS–BC anode likely owing to the enhanced electron transport and structural stability provided by the doped Fe. These findings further support the objectives of this study.
| Samples | Before cycling | 3rd cycle | |||
|---|---|---|---|---|---|
| Rs | Rct | Rs | Rsei | Rct | |
| NiS | 3.9 | 449.1 | 2.6 | 124.7 | 428.3 |
| NiS–BC | 3.2 | 231.5 | 2.9 | 8.7 | 26.7 |
| Ni0.9Fe0.1S–BC | 4.0 | 337.9 | 3.1 | 5.8 | 19.8 |
| Ni0.8Fe0.2S–BC | 3.8 | 171.2 | 3.8 | 6.2 | 14.8 |
| Ni0.7Fe0.3S–BC | 3.7 | 268.8 | 4.1 | 6.9 | 22.3 |
4. Conclusions
Ni1−xFexS (x = 0, 0.1, 0.2, and 0.3) nanoparticles were uniformly grown on the surface of a porous BC nanosheet to synthesize a LIB anode material (Ni1−xFexS–BC) with a high capacity, cycling performance, and rate capability. In particular, porous BC, rich in functional groups such as COOH, O─H, O─C, and O═C, was synthesized by TEMPO oxidation of dried hardwood kraft pulp and used as a conductive material. These oxygen-containing functional groups facilitated uniform deposition of the active materials on the BC surface by providing chemical bonds and reaction pathways. Additionally, owing to the high conductivity and multilayered structure of BC, Ni1−xFexS–BC facilitated rapid charging and was therefore deemed suitable for high-performance energy storage solutions. Doping of a small amount of Fe in the Ni1−xFexS/BC system improved the structural stability, conductivity, and lithium-ion diffusion of this anode material, thereby enhancing its overall electrochemical performance. The capacities of the NiS, NiS–BC, and Ni0.8Fe0.2S–BC electrodes at 0.5 A g−1 were 895.2, 1,133.7, and 1,374.5 mAh g−1 at the 2nd cycle and 741.6, 1,102.4, and 1,796.4 mAh g−1 at the 100th cycle, respectively. These results demonstrate the positive effects of introducing BC as a conductive material and Fe doping, suggesting application possibilities in the field of LIBs, where high capacities, high outputs, and high cycle stability are required. In particular, the application of BC aligns with the trend in modern battery research, which aims to simultaneously achieve high performance and sustainability.
Conflicts of Interest
The authors declare no conflicts of interest.
Acknowledgments
This work was supported by the National Research Foundation of Korea (NRF) and the Commercialization Promotion Agency for R and D Outcomes (COMPA) funded by the Ministry of Science and ICT (Grant No.: RS-2023-00217581 and RS-2023-00304768). This work was also supported by the Human Resources Development of the Korea Institute of Energy Technology Evaluation and Planning (KETEP) grant funded by the Korea government. (No. 20224000000070).
Open Research
Data Availability
The data that support the findings of this study are available on request from the corresponding author. The data are not publicly available due to privacy or ethical restrictions.


