Volume 2024, Issue 1 4239046
Research Article
Open Access

Elucidating the Immune Microenvironment and Therapeutic Targets in Nasopharyngeal Carcinoma through Bioinformatics

Shasha He

Shasha He

Operation Room, West China Hospital, Sichuan University, Chengdu, China scu.edu.cn

Search for more papers by this author
Yongbo Zheng

Corresponding Author

Yongbo Zheng

Department of Otorhinolaryngology Head and Neck Surgery, West China Hospital, Sichuan University, Chengdu, China scu.edu.cn

Search for more papers by this author
First published: 05 June 2024
Academic Editor: Raza Faisal

Abstract

Background. Nasopharyngeal carcinoma (NPC), prevalent in East Asia and associated with EBV infection, poses unique challenges due to its complex immunological interactions. This study aims to dissect the molecular and immune mechanisms of NPC, providing a pathway to novel treatments. Methods. Through bioinformatics, we analyzed gene expression and immune cell infiltration in NPC tissues. Differential gene expression profiling, single-cell RNA sequencing, and gene set variation analysis (GSVA) were performed to understand the immune landscape and identify EBV-related molecular changes. Results. The differential gene expression analysis highlighted a diverse immune cell composition, suggesting an intricate immune evasion landscape. GSVA pinpointed pathways linked to tumor immunity and EBV pathogenesis. Notably, the expression of immune checkpoints, such as PD-L1, was significantly associated with NPC, offering a potential target for immunotherapy. Conclusions. Our findings underscore the potential of immunotherapeutic approaches in NPC, particularly those modulating the PD-1/PD-L1 axis. The integration of bioinformatics and immunology in NPC research provides a foundation for personalized medicine and warrants further exploration into combination therapies to enhance treatment efficacy.

1. Introduction

Nasopharyngeal carcinoma (NPC) is a unique form of head and neck cancer, predominantly arising in the epithelial lining of the nasopharynx [1]. This malignancy exhibits a striking geographical and ethnic distribution, with the highest incidence rates reported in southern China, Southeast Asia, the Middle East, and North Africa [2]. It is particularly prevalent among populations of Cantonese descent. Genetic predisposition, Epstein-Barr virus (EBV) infection, and dietary factors, especially consumption of salt-preserved foods, are widely recognized as key risk factors for NPC [3]. The management of nasopharyngeal carcinoma has evolved significantly over the past decades, primarily due to advancements in radiation therapy and chemotherapy [4]. Radiotherapy remains the cornerstone of treatment, particularly effective in early stage NPC. Intensity-modulated radiation therapy (IMRT) has emerged as a major advancement, offering better tumor control with fewer side effects compared to conventional techniques [5]. Concurrent chemoradiotherapy is the standard of care for locally advanced disease, improving survival rates significantly [6]. In addition, the role of adjuvant chemotherapy is continually being explored to further enhance treatment efficacy. Despite these advances, the treatment of NPC poses several challenges due to the tumor’s proximity to critical structures such as the brain stem and cranial nerves, leading to potential complications and a need for careful treatment planning [7]. Furthermore, research into targeted therapies and immunotherapy is ongoing, with the hope of providing more personalized and effective treatment options for patients with NPC [8].

The immune landscape of NPC is characterized by an intricate interplay between the tumor cells, EBV infection, and the host immune response [9]. NPC tumors often exhibit immune evasion strategies, including the expression of immune checkpoint molecules such as PD-L1, which can inhibit T cell activation and allow the tumor to escape immune surveillance [10]. In addition, the chronic inflammation associated with EBV infection further complicates the immune response in NPC, often leading to an immunosuppressive tumor microenvironment [11]. Immunotherapy, particularly immune checkpoint inhibitors, has emerged as a revolutionary approach in the treatment of NPC [12]. These therapies aim to reinvigorate the host immune response against the tumor by blocking the inhibitory signals on immune cells. Drugs targeting the PD-1/PD-L1 pathway have shown promising results in clinical trials, offering new hope for patients, especially those with recurrent or metastatic disease [13]. The efficacy of these agents in NPC underscores the crucial role of the immune system in controlling this malignancy. Moreover, the exploration of combination therapies, integrating immunotherapy with conventional treatments such as chemotherapy and radiotherapy, is an area of active research [14]. The synergistic potential of these combinations could enhance the overall therapeutic efficacy and potentially overcome the resistance mechanisms of NPC. The evolving landscape of immunotherapy in NPC not only offers new therapeutic avenues but also necessitates a deeper understanding of the immune contexture of this unique malignancy [15]. Research is ongoing to identify biomarkers for predicting response to immunotherapy and to tailor treatments to individual patient’s tumor characteristics and immune profiles [16].

In recent years, the field of nasopharyngeal carcinoma (NPC) research has entered a transformative phase with the integration of bioinformatics, a powerful tool that allows for the comprehensive analysis of complex biological data. Nasopharyngeal carcinoma, a distinct type of head and neck cancer, is intricately associated with both genetic and environmental factors, including the pivotal role of the Epstein–Barr virus (EBV). Understanding the molecular and immunological landscapes of NPC is crucial for the development of effective diagnostic and therapeutic strategies. Particularly, the use of bioinformatics in studying the immune landscape of NPC opens new avenues for immunotherapy research. Analyzing gene expression profiles and immune cell infiltration patterns within NPC tumors can reveal insights into the mechanisms of immune evasion and response. This is critical in the context of emerging immunotherapeutic treatments, such as checkpoint inhibitors and therapeutic vaccines targeting EBV antigens.

2. Methods

2.1. Data Acquisition

In our study, gene expression datasets specific to nasopharyngeal carcinoma were acquired from the Gene Expression Omnibus (GEO) database, a public repository hosted by the National Center for Biotechnology Information (NCBI).

2.2. Differentially Expressed Analysis and Pathway Enrichment Analysis

In this study, our bioinformatics analysis primarily focused on the differential expression of genes between various sample groups. We utilized the limma package, a powerful tool in the R programming environment, specifically designed for analyzing gene expression data obtained from microarray or RNA-seq experiments. The process started with the normalization of expression data to remove technical variation. Using the limma package, we created a linear model for each gene and applied an empirical Bayes method to obtain moderated t-statistics, log-odds of differential expression, and p-values. The resulting list of differentially expressed genes (DEGs) was then subjected to gene ontology (GO) enrichment analysis. This analysis provided insights into the biological processes, cellular components, and molecular functions significantly associated with the DEGs. Furthermore, we conducted a Kyoto Encyclopedia of Genes and Genomes (KEGG) pathway enrichment analysis to understand the involvement of DEGs in specific metabolic or signaling pathways. Like GO analysis, this involved mapping the DEGs to KEGG pathways, followed by the identification of significantly enriched pathways using statistical methods. This step was instrumental in elucidating the molecular pathways potentially impacted by the condition under study.

2.3. Immune Cell Infiltration Analysis by Using CIBERSORT

In this study, we conducted immune infiltration analysis using bioinformatics algorithms to evaluate the immune cell composition in the tumor microenvironment. The CIBERSORT algorithm was used to deconvolute the expression matrix of the tumor samples to estimate the fraction of 22 immune cell types. It uses a set of reference gene expression values that are representative of the cell types to infer the cell composition of the mixed cell populations. All computational analyses were performed using R programming languages to ensure the reproducibility and robustness of our findings.

2.4. Single-Cell RNA Sequencing Analysis

In this study, we performed a comprehensive analysis of single-cell RNA sequencing (scRNA-seq) data to explore cellular heterogeneity and gene expression dynamics at the single-cell level. Differential gene expression analysis between the identified cell clusters was performed to uncover genes that are uniquely expressed in specific cell types or states. This involved statistical testing to find genes with significant differences in expression levels across clusters.

2.5. Gene Set Enrichment Analysis (GSEA)

For in-depth functional and pathway analyses, we employed gene set enrichment analysis (GSEA) as defined by Subramanian et al. The GSEA was performed using the GSEA software (version 4.1.0) from the Broad Institute. Preprocessed gene expression data were ranked based on the correlation with the phenotypic class using the signal-to-noise ratio metric. This ranking was utilized to identify gene sets from the Molecular Signatures Database (MSigDB) that showed statistically significant concordance with the phenotype of interest. We selected gene sets from the MSigDB collections to cover a broad range of biological processes and pathways. The analysis was run with 1000 gene set permutations to estimate the enrichment score (ES) for each gene set, which reflects the degree to which a gene set is overrepresented at the top or bottom of the ranked list of genes. The ES was normalized for each gene set to account for differences in set sizes, resulting in a normalized enrichment score (NES). Statistical significance was determined using false discovery rate (FDR) q-values, with an FDR threshold of <0.25 considered significant. This threshold was chosen to balance the discovery of biologically relevant gene sets with a control for type I error rate.

2.6. Gene Set Variation Analysis (GSVA)

In this study, we employed gene set variation analysis (GSVA) to assess pathway and gene set enrichment in a nonparametric and unsupervised manner. GSVA is a gene set enrichment method that estimates variation of pathway activity over a sample population in an expression dataset. This technique is particularly advantageous for analyzing transcriptomics data, as it allows for the identification of differential pathway activity across samples. Initially, we curated gene sets from established databases such as MSigDB (Molecular Signatures Database). These gene sets encompassed various biological processes, molecular functions, and canonical pathways. Our expression data, derived from RNA sequencing or microarray experiments, were first normalized and preprocessed to ensure quality and comparability. The GSVA analysis was performed using the GSVA package in R. For each sample in our dataset, GSVA provided a score for each gene set, reflecting the degree to which the genes in the gene set were coordinately upregulated or downregulated. These scores were then used in subsequent analyses to correlate pathway activities with phenotypic traits, clinical outcomes, or other variables of interest. The statistical significance of the associations between GSVA scores and phenotypic traits was determined using appropriate statistical tests, such as linear regression or survival analysis, depending on the nature of the data.

2.7. Statistical Analysis

Statistical analyses in this study were conducted using the R programming language, which offers robust capabilities for statistical computation and graphical representation of data. Descriptive statistics, including means, medians, and standard deviations, were used to summarize the data. For comparisons of continuous variables between the two groups, the Student’s t-test was employed in cases of normal distribution, as verified by Shapiro–Wilk tests. In instances of nonnormal distribution, the Mann–Whitney U test was utilized. For comparisons involving more than two groups, one-way ANOVA was used for normally distributed data, with post hoc Tukey’s tests for multiple comparisons. The Kruskal–Wallis test followed by Dunn’s test was used for nonparametric data.

3. Results

3.1. Comparative Transcriptomic Analysis Reveals Distinct Gene Expression Alterations in Nasopharyngeal Carcinoma

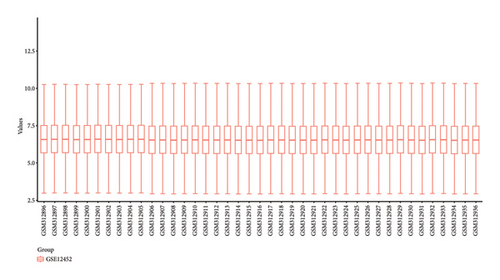
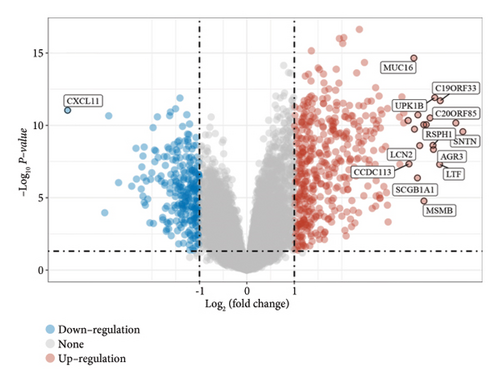
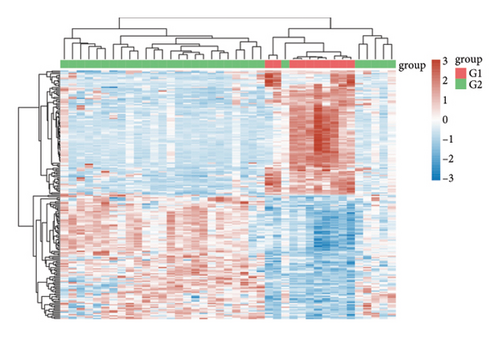
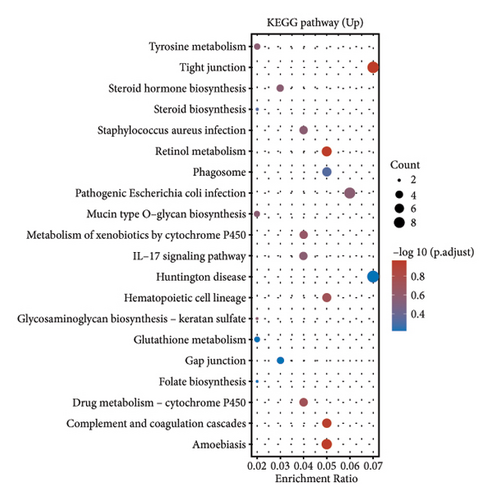
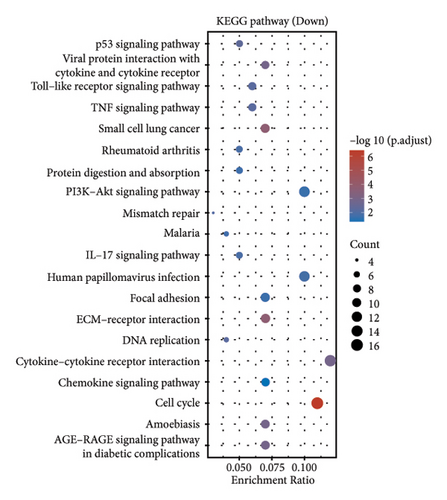
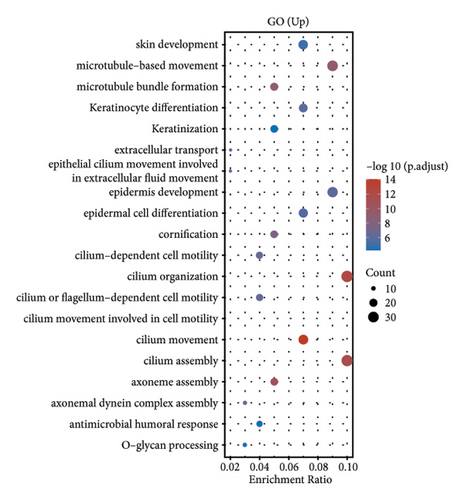
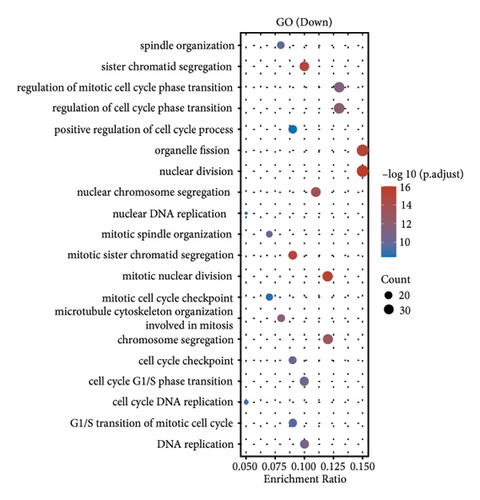
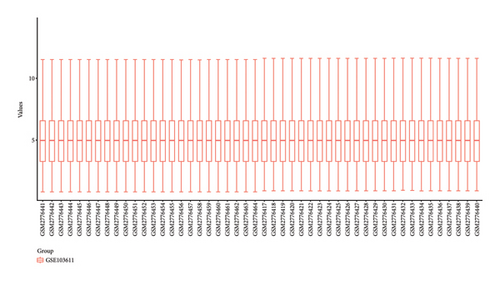
In our investigation into the differential gene expression between NPC patients and healthy individuals, we observed significant variations (Figure 1(a)). The expression levels, represented in a boxplot and measured on a log2 scale, showed a wide distribution across numerous genes in the patient cohort (group GEO12452). A volcano plot further delineated these differences, highlighting genes with substantial upregulation in red and downregulation in blue, with genes such as MUC15 and CXCL11 standing out due to their high fold-changes and statistical significance (Figure 1(b)). A heatmap with hierarchical clustering revealed distinct expression patterns between the two groups, with a color gradient signifying the expression intensity (Figure 1(c)). Pathway enrichment analysis using KEGG revealed that upregulated genes in NPC patients were significantly associated with pathways such as tyrosine metabolism and tight junctions, while downregulated genes were involved in pathways such as p53 signaling and cytokine-cytokine receptor interaction. Gene ontology (GO) analysis echoed these findings, showing upregulation in biological processes related to skin development, ciliogenesis, and keratinocyte differentiation, while downregulated genes were significantly linked to cell cycle regulation, DNA replication, and mitotic nuclear division, underlining the profound impact on cell proliferation and maintenance in NPC (Figures 1(d)1(g)).

Details are in the caption following the image
(a) Boxplot representation of gene expression levels across different genes in normal and NPC patient groups; (b) volcano plot showing differentially expressed genes, with upregulated genes in red, downregulated genes in blue, and nonsignificant genes in gray; (c) heatmap with hierarchical clustering displaying gene expression patterns across two patient groups; (d) enriched KEGG pathways in upregulated genes with bubble size indicating gene count and color intensity showing statistical significance; (e) enriched KEGG pathways in downregulated genes; (f) gene ontology (GO) terms associated with upregulated genes in bubble chart format; (g) GO terms for downregulated genes, also in bubble chart format.

3.2. Differential Gene Expression in Metastatic versus Nonmetastatic Nasopharyngeal Carcinoma

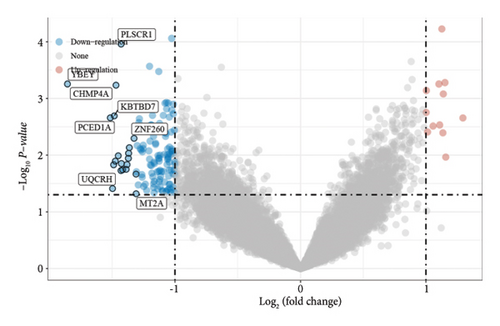
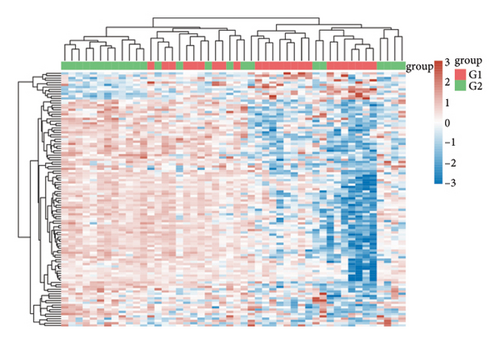
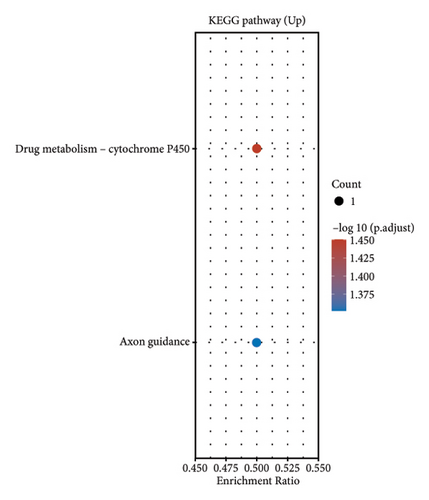
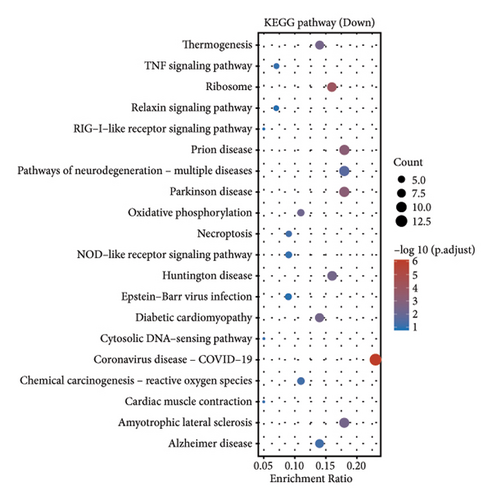
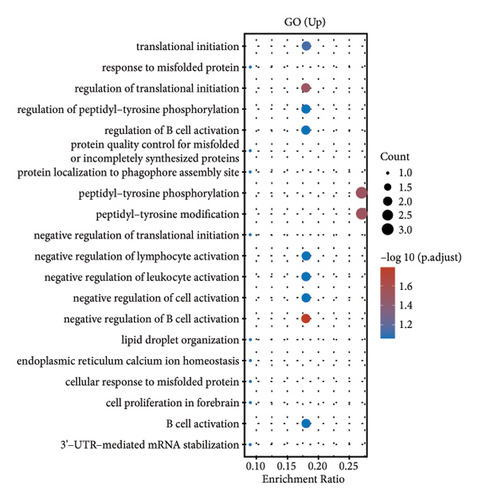
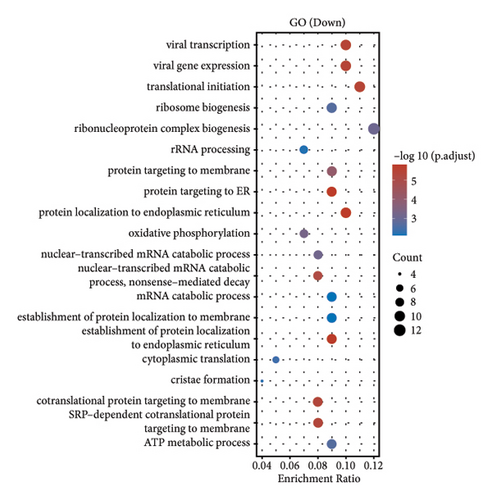
In our comprehensive gene expression analysis, we observed significant differences between metastatic and nonmetastatic nasopharyngeal carcinoma patients (Figure 2(a)). The gene expression levels, showcased in a boxplot for the cohort (group GEO196411), indicated substantial variability on a log2 scale across various genes. A volcano plot highlighted key genes that are downregulated (noted in blue), such as UQCR11 and MT2A, and others that are upregulated (noted in red), with no genes reaching a threshold of statistical significance (Figure 2(b)). Heatmap profiling with hierarchical clustering differentiated the two patient groups (G1 and G2) based on their gene expression patterns, using a color gradient from blue (low expression) to red (high expression) to visualize the data (Figure 2(c)). This method clearly segregated the metastatic from the nonmetastatic cases, underscoring the distinct expression profiles associated with metastasis. Pathway enrichment analysis underscored the divergence between the two conditions. Upregulated genes in metastatic NPC were enriched in pathways such as drug metabolism, cytochrome P450, as shown in the bubble chart where the size signifies the gene count and the color the significance. Conversely, downregulated genes were involved in pathways including thermogenesis, TNF signaling pathway, and ribosome, suggesting a complex interplay of biological processes affected by metastasis. Gene ontology (GO) enrichment analysis for upregulated genes in metastatic NPC illuminated terms related to translational initiation and response to misfolded protein, while downregulated genes were associated with cellular components and processes such as viral transcription, ribosomal biogenesis, and mRNA catabolic process. These results suggest that metastatic NPC may disrupt normal cellular and molecular functions, leading to alterations in protein synthesis and quality control mechanisms (Figures 2(d)2(g)).

Details are in the caption following the image
(a) Boxplot graph showing the distribution of gene expression levels across multiple genes within the metastatic and nonmetastatic nasopharyngeal carcinoma patient cohorts; (b) volcano plot depicting differentially expressed genes, with significantly upregulated genes highlighted in red, downregulated genes in blue, and nonsignificantly altered genes in gray, with key genes labeled; (c) heatmap with hierarchical clustering displaying the patterns of gene expression across two patient groups, illustrating differences between metastatic and nonmetastatic cases; (d) bubble chart illustrating enriched KEGG pathways among upregulated genes, with bubble size representing the number of genes and color indicating the level of significance; (e) bubble chart for enriched KEGG pathways among downregulated genes, also with bubble size for gene count and color for significance; (f) bubble chart showing upregulated gene ontology (GO) terms, with size and color coding similar to the KEGG pathway charts; (g) downregulated GO terms represented in a bubble chart, indicating potential biological processes affected by the metastatic status of the nasopharyngeal carcinoma.

3.3. Gene Expression Profiling in Nasopharyngeal Carcinoma and Its Metastasis

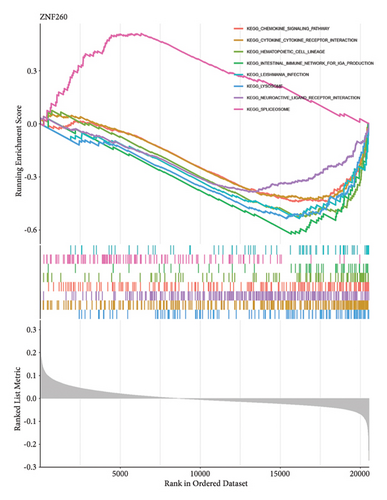
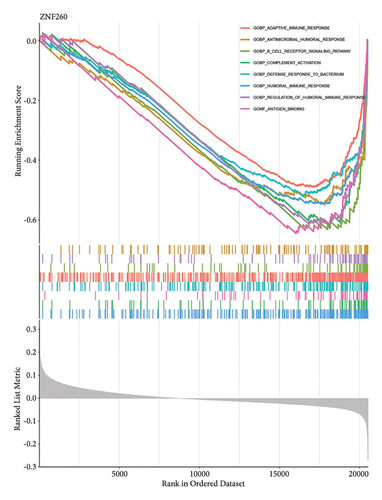
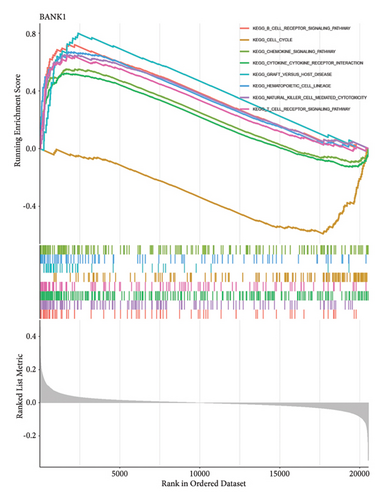
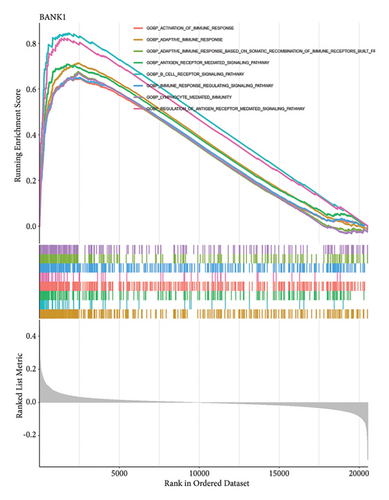
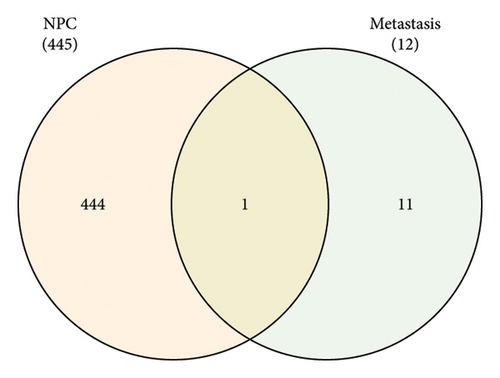
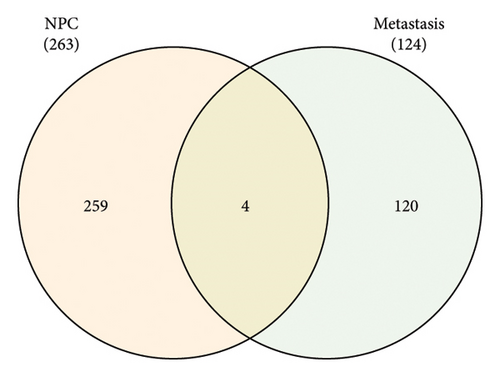
Venn diagram analysis showed that, among the genes surveyed in nasopharyngeal carcinoma (NPC) patients and healthy individuals, as well as between metastatic NPC patients and nonmetastatic counterparts, BANK1 was predominantly upregulated (Figures 3(a) and 3(b)). Specifically, it was upregulated in NPC patients compared to healthy individuals. Conversely, CXCL10, ZNF260, USP18, and C1QB were found to be downregulated. The Venn diagram illustrated that these genes were downregulated in NPC patients compared to healthy controls, with CXCL10 also being downregulated in metastatic compared to nonmetastatic NPC patients. GSEA revealed distinct pathways associated with the progression and metastasis of NPC. The analysis identified several key pathways that were differentially enriched between NPC and healthy controls as well as between metastatic and nonmetastatic NPC groups. Notably, genes involved in the immune response, such as those in the interferon-alpha/beta signaling pathway, were significantly enriched in the nonmetastatic group compared to the metastatic group. Furthermore, metabolic pathways, cell cycle control, and apoptosis-related genes appeared to be differentially regulated, suggesting a complex network of genetic interactions underlying the pathogenesis and spread of NPC (Figures 3(c)–3(f)).
Details are in the caption following the image
(a) Venn diagram showing the overlap of upregulated BANK1 gene in both NPC patients compared to normal individuals and metastatic NPC compared to nonmetastatic NPC; (b) Venn diagram displaying the overlap of downregulated genes CXCL10, ZNF260, USP18, and C1QB between NPC patients and normal individuals, and metastatic versus nonmetastatic NPC; (c–f) GSEA plots illustrating the enrichment scores of differentially expressed genes across various biological processes and pathways, with colored lines representing individual gene sets and their correlation with NPC phenotype.

3.4. Single-Cell RNA Sequencing Analysis of Nasopharyngeal Carcinoma

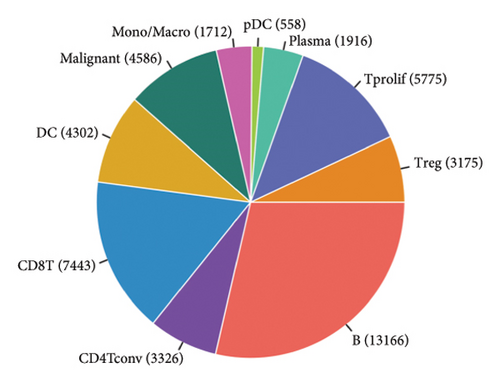
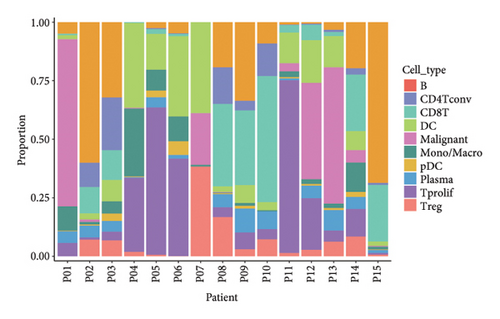
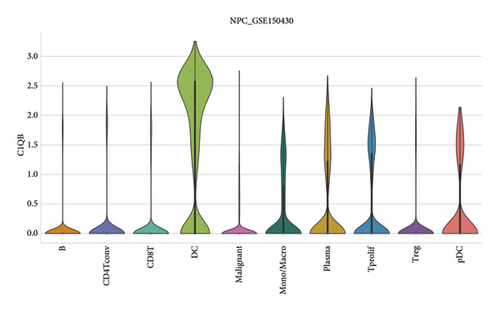
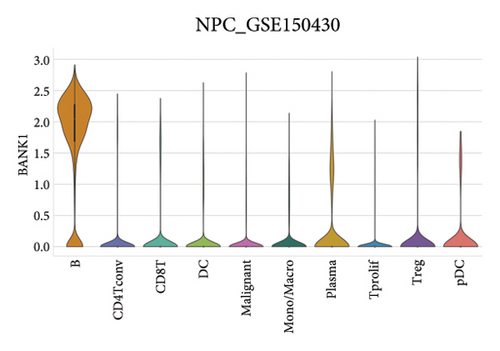
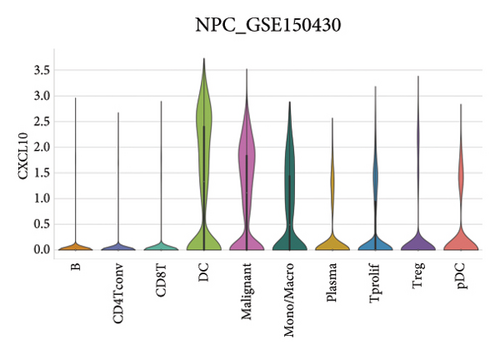
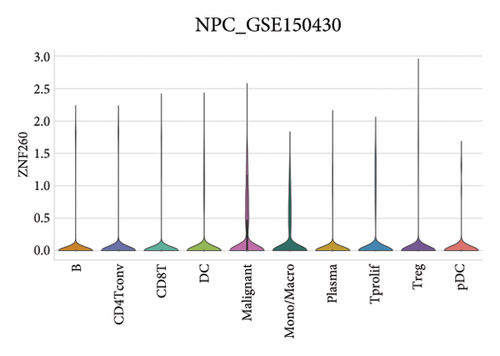
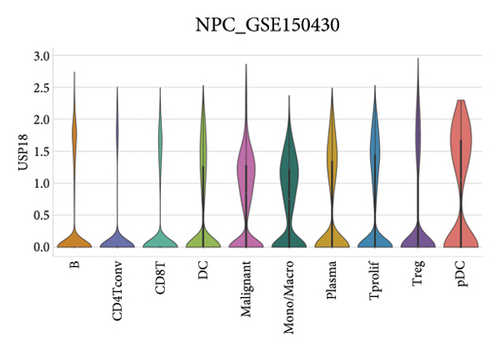
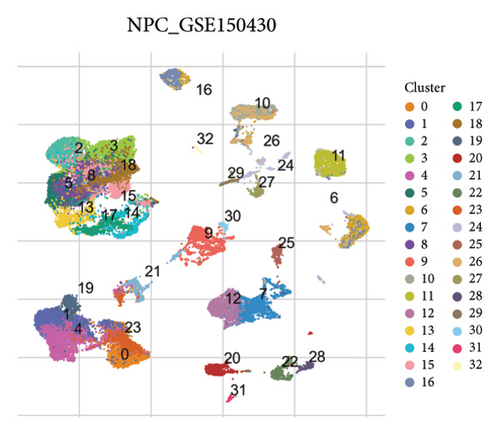
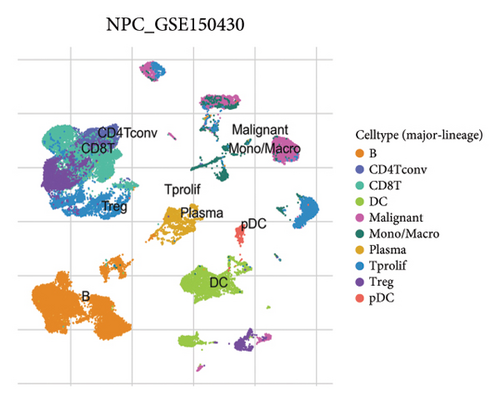
Our scRNA-seq analysis of nasopharyngeal carcinoma (NPC) revealed extensive cellular heterogeneity (Figure 4(a)). The t-SNE plot identified multiple distinct cell clusters, indicating a diverse cellular composition in NPC (Figure 4(b)). Through further analysis, we identified various cell types within the NPC tissue, including malignant, T cells, B cells, plasma cells, monocytes/macrophages, dendritic cells (DCs), and others (Figures 4(c) and 4(d)). Each cell type was annotated and visualized in a t-SNE plot, with malignant cells and T cells being the most prevalent. The cellular composition was quantified, showing a predominance of malignant cells, followed by T cells and B cells. The pie chart illustrated the proportion of each cell type, with CD8 T cells, DCs, and monocytes/macrophages also being significant components. The distribution of cell types varied across different NPC patients, as shown in the bar plot. This variation underscores the interpatient heterogeneity in the cellular landscape of NPC. Violin plots displayed the expression of key genes across different cell types. Notably, the gene C1QB was highly expressed in dendritic cells, whereas BANK1 showed variable expression across cell types. Other genes such as CXCL13, ZNF260, and USP18 displayed specific expression patterns, suggesting a cell type-specific regulation in the context of NPC-patient heterogeneity in the cellular landscape of NPC (Figures 4(e)–4(i)).
Details are in the caption following the image
(a) t-SNE plots illustrating the diverse cellular clusters identified within NPC samples; (b) annotation of t-SNE plots with identified cell types including malignant, T cells, B cells, and myeloid cells; (c) pie chart depicting the proportional representation of each cell type within the NPC samples; (d) bar plot showing the distribution of cell types across different NPC patient samples; (e) violin plots of C1QB gene expression across different cell types; (f–i) additional violin plots showing the expression of BANK1, CXCL13, ZNF260, and USP18 genes in various cell populations identified in NPC.

3.5. Immune Profiling Based on BANK1 Gene Expression Levels in Cancer Subtypes

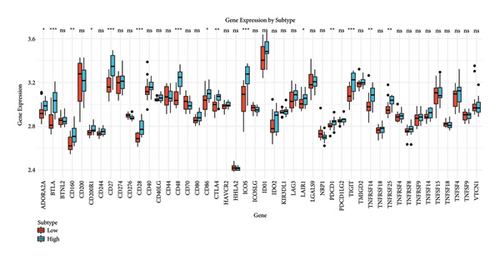
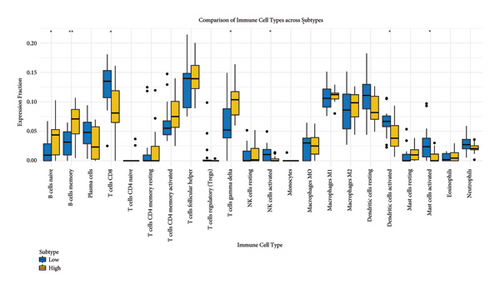
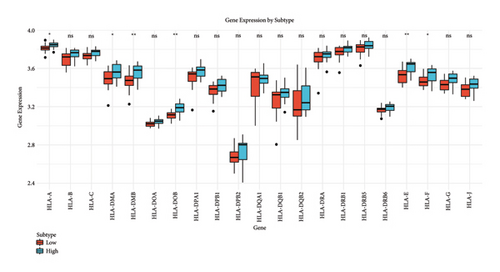
We analyzed the fraction of immune cell types across cancer subtypes stratified by low and high BANK1 gene expressions. The boxplots revealed differential expression fractions of various immune cells, such as B cells, various T cell subsets (CD8+ T cells and Tregs), NK cells, and myeloid cells. Notably, certain immune cell types such as Tregs and CD8+ T cells showed distinct expression patterns when comparing the low and high BANK1 expression subtypes (Figure 5(a)). In the comparison of gene expression by subtype, boxplots indicated that there was no significant (ns) difference in the expression levels of a panel of genes when comparing low and high BANK1 expression subtypes. The genes analyzed included multiple HLA types and other immune-related genes, suggesting that BANK1 expression levels do not significantly alter the expression of these genes across subtypes (Figure 5(b)). Further extended gene expression profiling across the same subtypes showed a similar trend, with no significant differences in expression levels for most genes. Some exceptions, however, did exhibit statistically significant differences (  or  ∗∗), suggesting a potential correlation between BANK1 expression levels and the expression of specific immune-related genes (Figure 5(c)).
Details are in the caption following the image
(a) Boxplots comparing the fraction of immune cell types across NPC subtypes with low and high BANK1 expression levels; (b) boxplots depicting gene expression levels by NPC subtype, annotated with “ns” for nonsignificant differences between low and high BANK1 expression groups; (c) boxplots of gene expression for a broader range of genes across NPC subtypes, again indicating the significance of expression level differences between the groups with labels such as “ ,” “ ∗∗,” and “ns.” ∗∗∗ means p < 0.001.

3.6. The GSVA of BANK1 in NPC Samples

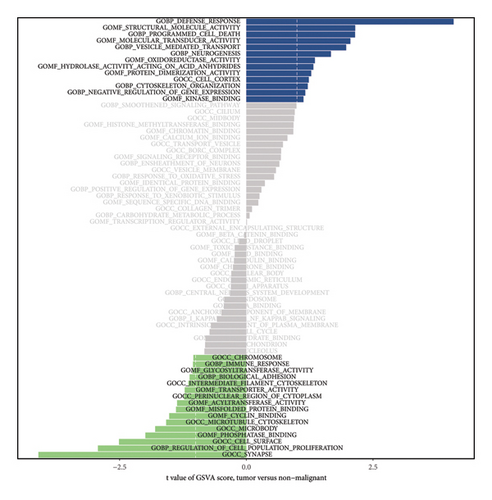
In our analysis, using gene set variation analysis (GSVA), we examined the differential activity of gene sets between tumor and nonmalignant samples to understand the underlying biological processes and molecular functions affected by cancer. The results were intriguing, revealing significant variations in gene sets related to the immune response, apoptosis, cellular transport mechanisms, and neural development. These variations, quantified statistically, offer a nuanced perspective of the molecular alterations in the tumor microenvironment compared to normal tissue. This analysis is crucial for identifying potential targets for the therapeutic intervention (Figure 6).
Details are in the caption following the image
The results of a gene set variation analysis (GSVA), showcasing the enrichment scores of various biological processes and molecular functions in tumor versus nonmalignant samples. The bar graph represents the t-values of GSVA scores, with each bar corresponding to a specific gene set category, such as immune response, cell adhesion, or metabolic processes, indicating their level of differential activity between the two conditions.

4. Discussion

Our study provides substantial insights into the pathogenesis and treatment responsiveness of nasopharyngeal carcinoma (NPC), a cancer distinctively prevalent in specific geographical and ethnic groups. Through sophisticated bioinformatics analyses, the team has delineated unique gene expression profiles that reveal the molecular complexity and diverse immune landscape of NPC, primarily influenced by Epstein–Barr virus (EBV) infection and genetic factors.

The differential gene expression analysis conducted has identified a strong immunological signature, which clearly differentiates NPC from nonmalignant tissue. This finding underscores the potential of utilizing immune cell markers as innovative therapeutic targets. The utilization of single-cell RNA sequencing has allowed for an in-depth exploration of the tumor microenvironment, revealing a rich diversity of immune cell types. This cellular heterogeneity points to the necessity for more refined and individualized immunotherapeutic approaches in treating NPC patients.

The gene set variation analysis (GSVA) provided valuable insights into the biological pathways that are altered in NPC, particularly those involving immune responses, apoptosis, and cellular transport mechanisms. These insights suggest that NPC tumorigenesis is driven by complex interactions among various cellular pathways, which could potentially be targeted for therapeutic gain. Importantly, the observed upregulation of immune checkpoint molecules such as PD-L1 in NPC tissues provides a mechanistic explanation for the tumor’s ability to evade the immune system, and it supports the current investigations into checkpoint inhibitors in clinical settings.

The prospect of integrating advanced immunotherapy with traditional treatment modalities such as intensity-modulated radiation therapy (IMRT) and chemotherapy holds promise for enhancing the overall efficacy of NPC treatments. This integrated approach aims to overcome the challenges of treatment resistance that are frequently encountered in NPC, thereby improving patient survival and quality of life. Furthermore, the pivotal role of bioinformatics in unraveling the intricate interactions between the host immune system, EBV, and NPC establishes a new paradigm in the clinical management of this complex disease.

As ongoing research continues to elucidate the genetic and immunological foundations of NPC, it becomes crucial to also identify and validate reliable biomarkers that can predict treatment response and prognosis. The considerable variability observed in the treatment responses among NPC patients advocates for a more personalized treatment strategy, leveraging the comprehensive data derived from genomic and transcriptomic analyses. In summary, this comprehensive study not only deepens our understanding of the complexities of NPC but also paves the way for novel therapeutic opportunities, highlighting the indispensable role of the immune system in controlling and potentially eradicating this challenging malignancy.

Conflicts of Interest

The authors declare that they have no conflicts of interest.

Acknowledgments

The work was sponsored by the corresponding author.

    Data Availability

    The data used to support the findings of the study are included within the article.

      The full text of this article hosted at iucr.org is unavailable due to technical difficulties.