Evaluation of Energy Density in Hexadecane Phase Change Emulsions in Comparison to Water
Abstract
The development of energy-dense, thermomechanically stable, and low-viscous phase change emulsions (PCMEs) is proposed as an alternative thermal energy storage solution for building air conditioning. A set of oil-in-water (O/W) nanoemulsions with hexadecane concentration varied between 10, 20, 25, 30, 35, and 40 wt. % is prepared and characterized with respect to their physical, thermal, and rheological properties. The storage characteristics are evaluated in terms of storage density, phase transition behaviour, supercooling, and dynamic viscosity. A systematic comparison in terms of energy density between the PCMEs and water is carried out at different temperature conditions. For this purpose, the storage break-even temperature TBE is proposed as a novel parameter to determine suitable operating temperature ranges and cycling conditions. The cycle stability is evaluated by rheological measurements, applying thermomechanical loads to the samples for a high number of cycles. According to the results, the energy density of the PCMEs is always higher than that of water, when the minimum temperature used for the cycling is below the storage break-even temperature. The emulsion with 30 wt. % hexadecane fraction is considered particularly promising, thanks to its high stability when exposed to thermomechanical stress, relatively low viscosity between 10 and 22 mPa s (0–30°C), and a storage density of 98 MJ/m3 within a cycling temperature range of 12 K.
1. Introduction
The mitigation of the impact of energy-intensive technologies on climate change is among the most important research questions that the scientific community is facing in recent decades [1]. Moreover, the enhancement of energy security policies is currently at the center of the intergovernmental discussion panels, in relation to the energy and economic outlooks arising from the new geopolitical balances.
Within this scenario, the acceleration of the energy transition and the improvements in energy efficiency are of prior importance, being at the intersection between environmental protection, long-term energy security, price stability, and national resilience [2]. The building sector is responsible for roughly one-third of the global final energy consumption and nearly 40% of the total direct and indirect CO2 emissions. In particular, the energy demand for space cooling has more than tripled since 1990, becoming the fastest-growing end-use [3].
In this study, the development of energy-dense, thermomechanically stable, and low-viscous phase change emulsions (PCMEs) is proposed as an alternative thermal storage solution for cooling applications in the building energy sector. PCMEs are two-phase functionally thermal fluids [4], which could be used as both heat carriers and storage media, and belong to the larger category of phase change slurries (PCS). The oil phase is composed of phase change material (PCM) droplets, dispersed in the water phase, and stabilized by the addition of surfactant molecules. Alike phase change materials, PCS have grabbed a lot of attention in the last decades thanks to their high heat of fusion and increased energy density per unit volume, which makes them an attractive technology for latent heat storage applications [5].
The novelty of the investigation proposed in this study is to quantitatively compare the benefit in terms of energy density derived from PCMEs with respect to water, by conducting a systematic comparison in terms of storage properties and varying the PCM fraction between 10 and 40 wt. %. Therefore, seven different PCME formulations are fabricated and characterized with respect to their thermodynamic and rheological properties, cycle stability, and compatibility to the fields of application mentioned, especially considering variations in the fraction of PCM and emulsifier. A novel formulation is developed for a hexadecane emulsion with an increased level of stability to thermomechanical stress and high energy density with respect to water. Additionally, the storage capacity of the PCMEs is evaluated at different operating temperature conditions, considering the effect of supercooling during the crystallization process. For this purpose, the storage break-even temperature TBE is proposed for the first time in this study as a novel parameter to evaluate the suitable operating temperature ranges for PCM emulsions affected by supercooling.
2. Background to the Study
Inaba [4] classifies five different types of phase change slurries (PCS): ice slurries, phase change material emulsions (PCMEs), microencapsulated phase change materials (mPCMs), clathrate hydrate PCM slurries, and shape stabilized phase change materials (ssPCMs). The main common advantage of PCS is the possibility to contemporarily use the same fluid as a heat carrier and thermal storage medium with increased storage capacity [6]. Therefore, while the dispersed phase undergoes its phase transition, the solution as a whole remains in a liquid state, with the possibility of being integrated in hydraulic systems during the entire cycling process [7, 8]. Additionally, PCS allow the physical separation between the storage tank and the heat exchange unit, making it possible to dimension the system components independently [9].
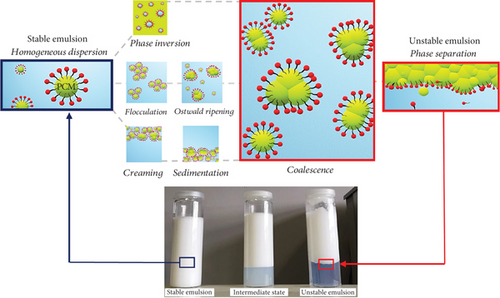
Phase change emulsions are heterogeneous solutions of two or more polar and nonpolar materials, fabricated by directly dispersing the PCM in the continuous water phase. The immiscible phases are maintained together thanks to the addition of one or more amphiphilic compounds, i.e., surfactants or emulsifiers, with the scope to reduce the interfacial surface tension between the water and oil phases. The hydrophilic to lipophilic balance (HLB) is the most used parameter to define the water-resistant (lipophilic) or water-attracting (hydrophilic) tendency of surfactants [10]. Therefore, emulsifiers are responsible for the physical stability of the emulsion and for avoiding phenomena such as coalescence [11, 12], creaming and sedimentation [13, 14], phase inversion [15], flocculation [16], and the Ostwald ripening [17]. Among all, coalescence is the most common one and occurs when oil droplets collide, eventually forming a bigger emulsion particle (Figure 1).
According to previous studies, the surfactant fraction strongly impacts not only the stability of the emulsion but also its viscosity [18]. Liu et al. [19] investigated the emulsion stability and the thermal and rheological behaviour of n-hexadecane PCMEs with different combinations of surfactant molecules and fractions. The authors found that the mass ratio and the relative content of the surfactant with respect to the PCM play a major role for the formation of stable nanoemulsions.
According to Wang et al. [20], the emulsifier fraction should be selected in accordance with the PCM content to optimize the stability of the emulsion and its viscosity. Moreover, in agreement with previous studies [21, 22], the authors verified that a greater amount of surfactant is necessary to obtain droplets of smaller size, as their surface-to-volume ratio increases with the decrease in particle diameter. On the other hand, it was found that the concentration of the dispersed phase has a strong impact on the emulsion viscosity and could lead to its rapid increase. Therefore, when the emulsion is integrated and pumped into the hydraulic system, the pressure drop increases together with the viscosity of the fluid, lowering the energy savings of the storage [7, 8, 23].
A second major disadvantage of PCMEs is the effect of their supercooling degree on the storage capacity. Supercooling is a typical behaviour of PCMs which corresponds to the temperature difference at which the crystallization process occurs when cooling down the material below its freezing point. Therefore, the PCME remains at a supercooled liquid state within a wider temperature range, and the release of its latent heat of crystallization is delayed or prevented, if the material is not further cooled down to its nucleation temperature. The nucleation theory behind this phenomenon has been extensively investigated in previous studies [6, 24, 25]. It was proved that the addition of nucleating agents in the solution, such as solid paraffin waxes, nanomaterials, and surfactants, could efficiently reduce, to a large extent, the supercooling of the emulsions [20, 26].
At present, phase change emulsions are mainly studied on a laboratory scale, where several prototypes have been developed over the last decades. The field of application ranges from air conditioning in buildings, to waste heat recovery solutions, as well as thermal energy management systems for battery cooling. Shao et al. [27] reviewed some potential applications of PCMEs based on the temperature range of their phase transition and on the operating conditions of the system. The authors outlined the huge potential of PCMEs for air conditioning applications in buildings. Here, PCM emulsions could be a valuable substitute to water as a fluid medium for cold supply networks and cooling pipe systems depending on their melting and crystallization temperatures. Moreover, the higher energy density of the PCME allows a substantial reduction of the storage size, as well as the possibility to reduce the flow rate during the circulation of the medium. This in turn lowers the pump energy consumption, whenever the viscosity of the fluid is low enough to allow it. Additionally, replacing water with PCM emulsions through capillary tubing systems for cooling of ceilings and walls is also considered an efficient solution to increase the thermal mass of building components [28]. Finally, PCMEs also showed to be good candidates for the thermal management of battery cooling systems. Wang et al. [29] conducted an experimental and numerical investigation on the enhanced thermal energy management of a lithium-ion battery pack using PCM emulsions. The authors demonstrated that the adoption of nanoemulsions boosts the energy storage capacity of the system with respect to water, reducing its maximum temperatures and therefore enhancing its thermal energy management.
The scope of this study is to assess the impact of the variation in hexadecane fraction on the thermal, physical, and rheological properties of the emulsions. The dispersed phase is overall varied between 10 and 40 wt. %. The PCMEs are characterized from a physical, thermal, and rheological point of view and compared to water in terms of storage density. The impact of the surfactant concentration on the stability of the emulsions is also investigated, with an overall emulsifier variation between 1.5 and 5.2 wt. %. Moreover, a systematic evaluation of the operating temperatures to be chosen to benefit from the storage capacity of the solution in presence of supercooling is proposed, with the definition of a novel temperature parameter, the storage break-even temperature TBE. This latter is defined as the temperature at which the energy released by the PCME during the cooling cycle equals that of water. Special attention is dedicated to the combined effect of all the system parameters in terms of storage density, phase transition behaviour, supercooling, thermomechanical stability, and dynamic viscosity. Finally, the cycle stability is evaluated by rheological measurements, applying thermomechanical loads to the samples for a high number of cycles.
3. Materials and Methods
A set of paraffin-based oil-in-water (O/W) nanoemulsions with different PCM concentrations is prepared. The hexadecane oil phase is varied between 10, 20, 25, 30, 35, and 40 wt. %, while finely dispersed in the abundant deionized water phase. The two phases are stabilized by the addition of surfactant molecules with different hydrophilic tendencies. Two ethoxylated alcohols are used for this scope and mixed in the right proportion to obtain a final HLB of 13.6. The nonionic surfactant Laureth-30 is chosen for the hydrophilic compound, while the molecule Laureth-2 is selected for the lipophilic emulsifier. Moreover, two different formulation approaches are used to assess the impact of surfactant concentrations on PCME stability, in relation to the different PCM enrichment of the emulsions. Specifically, the surfactant fraction is kept constant at 5.2 wt. % for the emulsions with PCM content equal to or higher than 30 wt. %. On the other hand, the surfactant-to-PCM ratio of the 35 wt. % PCM emulsion is taken as a reference for the PCMEs with lower hexadecane concentration. Therefore, the surfactant fraction is adjusted to the PCM concentration for emulsions with hexadecane content equal to or lower than 30 wt. %, while keeping the HLB of the mixture constant. Moreover, a constant concentration of 0.5 wt. % of polyethylene monoalcohol is chosen as a nucleating agent for the formulations. After their fabrication, the PCMEs are characterized from a physical, thermal, and rheological point of view. Afterwards, they are compared in terms of particle size, density, storage capacity, phase transition behaviour, supercooling, and dynamic and kinematic viscosity. Finally, the water storage density factor is determined for all the emulsions considered.
3.1. Fabrication
3.1.1. Material Selection
The hexadecane is chosen as the oil phase for all the emulsions produced. This organic paraffin is particularly advantageous for cooling applications in the building sector, thanks to its favorable onset melting temperature of 17.6°C and its relatively high heat of fusion of 217 kJ/kg [6]. On the other hand, the bulk material shows a supercooling degree of roughly 5 K, which is responsible for the different temperature range at which the latent heat is discharged during the cooling period. Consequently, the storage capacity of the emulsion is reduced within narrowed temperature ranges close to its phase transition, unless nucleating agents are added to the solution. In this study, the nucleating agent is added with a fixed concentration of 0.5 wt. % to all the emulsions fabricated.
3.1.2. Production Stages
After mixing the components by magnetic stirring, the emulsion is treated with a two-stage high-energy dispersion to optimally reduce the particle size of the oil phase. First, the average oil particle diameter is reduced to 10 μm, with the use of the rotor-stator dispersion machine MagicLab produced by IKA-Werke GmbH. Thus, the PCME is forced to flow through a set of different channels, which rotate at 20000 rpm for 5 minutes. Then, the emulsion particles are further disrupted using the High-Pressure Homogenizer APV 2000 produced by SPX Flow. The emulsion is pumped through a small orifice for 5 cycles at high pressure (300 bar). Thanks to this last dispersion stage, the average droplet diameter is drastically reduced to the nanometer scale, with a more homogeneous distribution of the particle size.
3.2. Characterization and Stability Assessment
The objective of the characterization of the PCMEs is the determination of their main physical, thermal, and rheological properties, as well as the assessment of their changes over time, i.e., over the number of cycles. The target of the investigation is the optimization of a PCM formulation which ensures the stability of the storage characteristics over a high number of heating and cooling cycles and under the exposure to the external stress of the hydraulic circuit. In this study, this is preliminarily demonstrated by means of rheology and in agreement with previous investigations [30]. The rheological measurements constitute a first exploratory test to assess the degradation of the stability of PCMEs in terms of dynamic viscosity, over 100 heating and cooling cycles at a constant shear rate.
3.2.1. Particle Size
According to previous studies [11, 31], smaller particle sizes increase the long-term stability of PCMEs, thanks to the decreased interfacial tension between the oil and water phase, which is directly proportional to the surface area of the droplet. As a result, the droplets show less tendency to coalescence. The Mastersizer 3000 Hydro MV machine from Malvern Panalytical is used for the scope of the investigation. The average droplet diameter is determined using the Mie and Fraunhofer theory of light scattering. Therefore, the particle size is reported as volume-equivalent sphere diameter. The measurement results include the Dx 10, Dx 50, and Dx 90 values, which refer to the average droplet diameter of 10, 50, and 90% of the particle volumetric density, respectively. The dispersion of the emulsion is considered optimal when all the particles of the Gaussian distribution fall below 1 μm and only one major peak is observed.
3.2.2. Density
The density measurement is particularly important to estimate the PCME storage density per unit volume. The measurement is carried out between 20 and 5°C and with a temperature step of 1 K. The emulsion is cooled down below its crystallization temperature, ensuring the full-phase transition of the fluid. The density meter DMA 4500 M by Anton Paar is used for the purpose of the investigation. The device registers the density at each temperature step only once stationary temperature conditions are reached. The emulsion is introduced into a U-shaped tube inside the device, which is excited to oscillate at its characteristic frequency, directly related to the density of the sample.
3.2.3. Calorimetric Determination of Storage Capacity
The thermal characterization of the PCMEs is performed via differential scanning calorimetry (DSC). The method is based on the relationship between enthalpy and temperature h(T) and consists of the calculation of the energy necessary to increase the temperature of the emulsion sample investigated, in comparison to a reference material of well-known properties, which, in the case of this study, is air. The machine DSC Q2500 produced by TA Instruments is used for the purpose of the investigation. Therefore, a small PCME sample with mass between 15 and 20 mg is placed in the DSC furnace, where it undergoes three heating and cooling cycles at a heating rate of 0.5 K/min and within a temperature range between -5 and 25°C. The temperature range is chosen in such a way to ensure the complete phase transition of the material. Moreover, isotherm periods of 5 minutes are interposed between the heating and cooling ramps, in order to reach stationary thermal conditions at the lowest and highest temperatures, before a new cycle is started.
The DSC measurements provide the normalized heat flux exchanged by the material during the heating and cooling cycles. The corresponding specific enthalpies of fusion and crystallization are determined by integration between the heat flow signal and the virtual baseline. Moreover, it is possible to determine the most relevant temperatures which mark the beginning and end of the phase change period of the PCME, as well as its phase transition behaviour, e.g., the number and type of phase transitions, the stability of the nucleating agent, and the supercooling degree of the fluid. The temperatures of main interest for this study are the beginning and the end of melting ( and ) and the beginning and end of crystallization ( and ). The ends of melting and crystallization are chosen as the points at which the enthalpy difference between the heating and cooling curves reaches its minimum. On the other hand, the beginnings of the phase change processes correspond to the heating or cooling onset temperatures from the DSC. In addition, the peak temperatures during the heating and cooling cycles are defined at and , respectively.
The storage capacity of the PCMEs is calculated as the enthalpy discharged by the emulsions within selected temperature ranges along the liquid-solid phase transition of the material. The starting temperature considered for the calculation is the end of melting , while the temperature ranges used are 6 K, 8 K, 10 K, and 12 K (Figure 2).
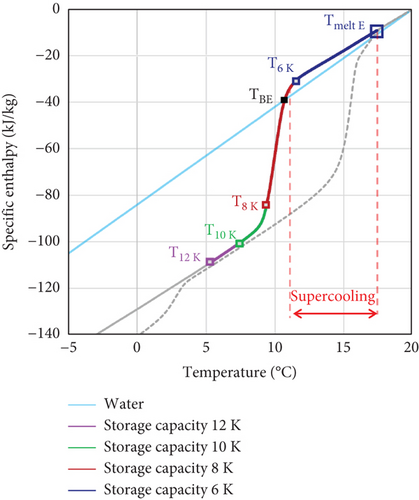
Additionally, being the specific heat capacity of water higher than that of emulsions, the operating cycling temperature range must be selected in such a way that the latent heat of fusion of the PCM is at least partially discharged. For this purpose, in this work, a novel parameter is introduced to define suitable operating temperature ranges for emulsions affected by supercooling. The storage break-even temperature TBE is defined as the temperature at which the energy released by the PCME during the cooling cycle equals that of water (Figure 2). Therefore, the TBE point defines the cycling temperature below which is possible to discharge a higher storage capacity than in conventional water storage systems, i.e., Tf should always be lower than TBE.
The thermal energy exchanged by the PCME during the cooling period is in the form of both sensible and latent heat. At the beginning of the cooling cycle, the PCME discharges sensible heat from the water and oil phase, both in liquid state due to supercooling. During the phase transition period, the water phase continues to exchange sensible heat, while the PCM droplets release the latent heat of crystallization. When all the PCM is in a solid state, the sensible heat is discharged by the liquid water phase and the solid PCM particles. For the calculation, the end of melting is chosen as the starting temperature for the cooling cycle, while the final temperature Tf is selected depending on the operating conditions and the required storage capacity. The storage capacity exchanged by the PCME within the break-even temperature range HBE is calculated as the enthalpy released between the end of melting and the storage break-even temperature.
Finally, the water storage density factor (SDF) is determined as the ratio between the storage density of the PCME and the water storage density within the same temperature ranges. Moreover, the calculation is repeated twice: first, taking the supercooling degree of the PCME into account, and then assuming it equal to zero. The aim of the comparison is to estimate the full potential of the technology in case of no supercooling. The two approaches considered the crystallization and melting DSC curves, respectively.
3.2.4. Rheological Assessment of Thermomechanical Stability
Emulsions are naturally unstable systems which tend to collapse over time, due to the natural segregation between the water and oil phases. Additionally, in the case of emulsions used for energy applications, the fluid is continuously exposed to thermal and mechanical loads during its operation. For instance, when the PCME is pumped into heat exchange systems, the PCM oil phase also undergoes its phase transition. The combination of these factors could increase the instability of the PCMEs and their degradation rate, especially when coupled to suboptimal formulations, e.g., wrong selection of emulsifiers, surfactant concentration, or HLB value.
Despite phase separation could be observed by eye, this approach could be time-consuming. Therefore, a rheological assessment of the thermomechanical stability is performed after the fabrication of the PCMEs, with the aim to accelerate the degradation rate of the fluid. Moreover, one of the advantages of PCMEs is the pumpability of the solution. For this reason, measuring the dynamic viscosity of the sample within the application temperature range of interest is important to ensure the production of low-viscous PCMEs. The stability test carried out in this work is based on the procedure adopted by Niedermaier et al. [30] to assess the stability of phase change slurries with the use of rheological measurements. The authors combined a preliminary stability rheological test with an upscaled stability assessment in a hydraulic test rig. They found that if the viscosity of the PCMEs does not change significantly after 100 heating and cooling cycles at a constant shear rate of 100 s-1, the emulsion shows a high level of stability even after 10000 cycles in the upscaled hydraulic test facility. Previous studies also used rheological measurements to determine the stability of the emulsions. However, only a limited number of cycles smaller than 100 were used for the investigation [32].
In the current investigation, the dynamic strain-controlled rheometer MCR 502 by Anton Paar is used for a preliminary stability evaluation. The coaxial cylinder geometry is chosen to perform the measurements. While the shear rate γ is kept constant at 100 s-1, heating and cooling ramps are alternated between 0 and 30°C at a heating rate of 2 K/min. The broad temperature range selected ensures the complete phase transition of the PCM phase. In addition, stationary thermal conditions are reached at the highest and lowest temperatures by introducing isotherm periods at the end of each ramp. Therefore, the emulsion is exposed to thermomechanical stress for a high number of cycles equal to 100. According to previous studies [6], when the level of stability of the emulsion is high, the thermophysical characteristics of the PCME remain constant throughout this type of deterioration test. On the other hand, if coalescence and phase separation occur, the dynamic viscosity of the PCME tends to increase.
4. Results and Discussion
4.1. Particle Size
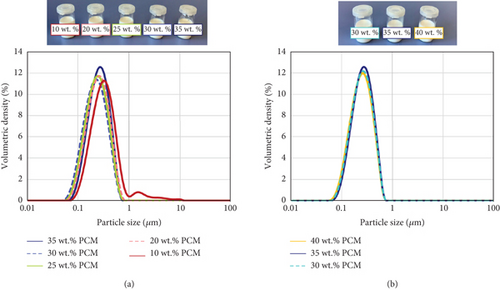
The particle size distributions show an average droplet diameter lower than 1 μm (Dx 90), regardless of the approach used for the formulation of the PCMEs (Table 1). Furthermore, the median particle size falls below 0.5 μm for all the emulsions investigated. According to previous studies [11], this condition is strong enough to guarantee long-term stability to the PCMEs. In fact, reducing the particle size to the nanometer scale could efficiently prevent or reduce to a large extent instability phenomena such as creaming and sedimentation [10, 33–35], flocculation [15], and the Ostwald ripening [17].
| PCME | Particle size/μm | |||
|---|---|---|---|---|
| PCM fraction | Surfactant adjusted to PCM | Dx 10 | Dx 50 | Dx 90 |
| 10 wt. % | Yes | 0.166 | 0.326 | 0.682 |
| 20 wt. % | Yes | 0.130 | 0.251 | 0.456 |
| 25 wt. % | Yes | 0.121 | 0.234 | 0.428 |
| 30 wt. % | Yes | 0.119 | 0.227 | 0.407 |
| 30 wt. % | No | 0.131 | 0.249 | 0.441 |
| 35 wt. % | Yes | 0.127 | 0.239 | 0.422 |
| 40 wt. % | No | 0.147 | 0.272 | 0.475 |
Furthermore, the particle size distribution is mostly homogeneous for all the samples (Figure 3), except for the PCME with 10 wt. % hexadecane, which presents a second peak between 1 and 10 μm. However, this does not represent a major cause of instability for the PCME, as confirmed by the rheological measurements.
4.2. Density
According to the experimental and analytical datasets, the density of all the PCMEs studied is lower than that of water. This difference is attributed to the lower density of the hexadecane PCM, which is calculated equal to 747.3 kg/m3 at a phase change temperature of 18°C. Therefore, the PCME density decreases when richer PCM fractions are dispersed into the water phase. For this reason, this study compares the storage carrier fluids not only in terms of storage capacity, but especially in terms of storage density.
According to literature [13], the difference in density between the oil and water phase is intended to be as small as possible. In fact, according to Stokes’ law, this reduces the velocity of the dispersed particles, e.g., during coalescence or sedimentation.
Moreover, the PCMEs undergo greater density changes during their phase transition. As reported in Table 2, the density of the PCMEs decreases with increasing temperatures, with the greatest variation occurring close to the phase change temperatures of the materials. As an example, during the heating period, all the emulsions experience a steep decrease in density between 14.5 and 16°C (Figure 4).
| TH | 10 wt. % | hexadecane | TC | 10 wt. % | hexadecane | ||
|---|---|---|---|---|---|---|---|
| °C | kg/m3 | kg/m3 | kg/m3 | °C | kg/m3 | kg/m3 | kg/m3 |
| 5 | 1000.3 | 988.7 | 884.4 | 20 | 998.6 | 972.9 | 742.1 |
| 6 | 1000.3 | 988.6 | 882.9 | 19 | 998.8 | 973.2 | 743.3 |
| 7 | 1000.3 | 988.4 | 881.1 | 18 | 999.0 | 973.5 | 744.4 |
| 8 | 1000.2 | 988.2 | 880.0 | 17 | 999.2 | 973.8 | 745.6 |
| 9 | 1000.2 | 988.0 | 877.8 | 16 | 999.3 | 974.1 | 746.7 |
| 10 | 1000.1 | 987.7 | 876.3 | 15 | 999.5 | 974.3 | 748.0 |
| 11 | 1000.0 | 987.5 | 874.7 | 14 | 999.6 | 974.6 | 749.3 |
| 12 | 999.9 | 987.2 | 872.7 | 13 | 999.8 | 975.0 | 752.4 |
| 13 | 999.8 | 986.8 | 870.1 | 12 | 999.9 | 976.8 | 769.2 |
| 14 | 999.6 | 986.2 | 865.5 | 11 | 1000.0 | 981.9 | 818.9 |
| 15 | 999.5 | 984.2 | 846.5 | 10 | 1000.1 | 986.9 | 867.9 |
| 16 | 999.3 | 974.6 | 752.2 | 9 | 1000.2 | 987.8 | 876.2 |
| 17 | 999.2 | 974.4 | 751.1 | 8 | 1000.2 | 988.1 | 879.1 |
| 18 | 999.0 | 973.8 | 747.3 | 7 | 1000.3 | 988.3 | 880.6 |
| 19 | 998.8 | 973.6 | 746.6 | 6 | 1000.3 | 988.5 | 882.7 |
| 20 | 998.6 | 973.3 | 745.9 | 5 | 1000.3 | 988.7 | 884.3 |
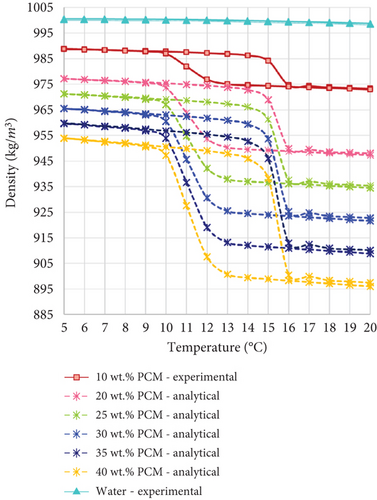
This reduction is driven by the phase change of the PCM, which passing from solid to liquid lowers its density. As confirmed by the DSC analysis, the beginning of melting occurs at an average temperature of 14.4°C, while the average peak melting temperature is 16°C. However, during the cooling period, the same phenomenon occurs in a lower temperature range, between 12.5 and 10°C. The phase change of the hexadecane particles from liquid to solid state is identified as the main driver of the step increase in density. According to the DSC measurements, the beginning and peak average temperatures during crystallization are, respectively, 11.7 and 10°C. It could be concluded that the steep density variation of the PCMEs is strongly related to their physical status and that the temperature ranges at which the melting and crystallization of the PCM occur are dependent on the supercooling behaviour of the PCM material. Furthermore, the results show that the different hexadecane enrichment of the PCMEs has no effect on the phase transition temperatures, but on the magnitude of the density variations, as this is directly proportional to the PCM fraction.
Moreover, the presence of air bubbles is observed for all the emulsions with a PCM fraction higher than 10 wt. % during the heating period, while during cooling, it is correctly measured for most of the temperature steps. However, when the temperature drops below 11°C, small air bubbles are formed in almost all the PCMEs, causing inaccuracies in the measurements at specific temperatures (Figure 5). As previously described, this temperature falls within the phase transition range of the emulsions. Therefore, it is hypothesized that the volume change of the PCM during its phase transition determines a small pressure gradient, which is responsible for the motion of the air bubbles through the U-tube into the investigated sample. This is more evident for emulsions with higher PCM content. For instance, the sample with a PCM fraction of 10 wt. % does not experience this measurement problem during both the heating and cooling cycles, since the PCM content for this emulsion is lower; therefore, its total volume change is also lower. For similar reasons, it is possible to measure the full cooling cycle of the emulsion with 20 wt. % PCM.
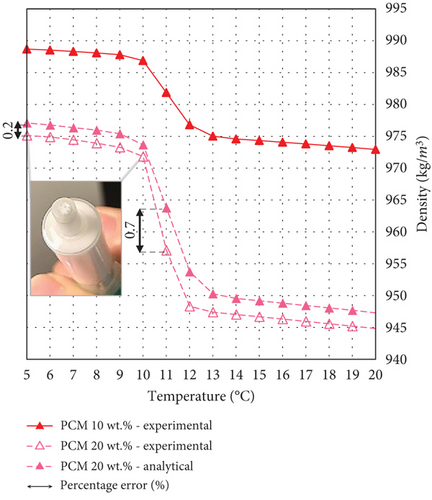
To conclude, the approach used to determine the density for the PCMEs with hexadecane fraction higher than 10 wt. % is validated by the small percentage errors calculated for the available experimental datapoints, as reported in Table 3. For the majority of the PCMEs, the percentage error is below 1%, with a maximum of 1.3% in the case of the emulsion with 30 and 40 wt. % hexadecane content, within their phase transition regions. The inaccuracy could be due to the neglected impact of the surfactants and the nucleating agent on the overall PCME density. However, the error is considered sufficiently small to be ignored for the scope of this study.
| TH | PCME 20 wt. % | PCME 25 wt. % | PCME 30 wt. % | PCME 35 wt. % | PCME 40 wt. % | |||||
|---|---|---|---|---|---|---|---|---|---|---|
| ρexp | Error | ρexp | Error | ρexp | Error | ρexp | Error | ρexp | Error | |
| °C | kg/m3 | % | kg/m3 | % | kg/m3 | % | kg/m3 | % | kg/m3 | % |
| 20 | 944.8 | 0.3 | 931.3 | 0.3 | 919.1 | 0.3 | 913.9 | 0.6 | 891.9 | 0.5 |
| 19 | 945.2 | 0.3 | 931.7 | 0.3 | 919.6 | 0.3 | 914.3 | 0.6 | 892.4 | 0.5 |
| 18 | 945.6 | 0.3 | 932.2 | 0.3 | 920.1 | 0.3 | 914.8 | 0.5 | 893.0 | 0.5 |
| 17 | 945.9 | 0.3 | 932.6 | 0.3 | 920.5 | 0.3 | 915.3 | 0.5 | 893.5 | 0.5 |
| 16 | 946.3 | 0.3 | 933.0 | 0.3 | 921.0 | 0.3 | 915.7 | 0.5 | 894.0 | 0.5 |
| 15 | 946.7 | 0.3 | 933.4 | 0.3 | 921.5 | 0.3 | 916.2 | 0.5 | 894.5 | 0.5 |
| 14 | 947.0 | 0.3 | 933.8 | 0.4 | 921.9 | 0.3 | 916.6 | 0.5 | 895.1 | 0.5 |
| 13 | 947.4 | 0.3 | 934.2 | 0.4 | 922.4 | 0.3 | 917.1 | 0.4 | 895.6 | 0.6 |
| 12 | 948.3 | 0.6 | 935.2 | 0.7 | 923.3 | 0.3 | 918.2 | 0.1 | 896.9 | 1.2 |
| 11 | 957.1 | 0.7 | 946.4 | 0.9 | 933.0 | 1.3 | 931.2 | 0.6 | 915.8 | 1.3 |
| 10 | 971.8 | 0.2 | 965.2 | 0.2 | 955.5 | 0.3 | n.a. | n.a. | ||
| 9 | 973.3 | 0.2 | 966.4 | 0.3 | n.a. | n.a. | n.a. | |||
| 8 | 973.9 | 0.2 | n.a. | n.a. | n.a. | n.a. | ||||
| 7 | 974.5 | 0.2 | n.a. | n.a. | n.a. | n.a. | ||||
| 6 | 974.9 | 0.2 | n.a. | n.a. | n.a. | n.a. | ||||
| 5 | 975.1 | 0.2 | n.a. | n.a. | n.a. | n.a. | ||||
4.3. Thermal Characterization
The results obtained via DSC confirm that the amount of energy exchanged during the latent heat transition of the PCMEs is higher for the emulsions richer in PCM content. For instance, this is proven by the steepness of the heat flux peaks during the phase transitions, which tend to increase with the PCM fraction (Figure 6). Moreover, all the materials experience several phase transitions, as the heat flux curves present at least two peaks during the heating period: apart from the main solid-liquid transition peak, a smaller one could be observed at a temperature of around 3°C.
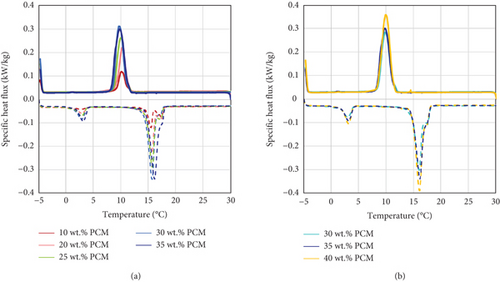
According to Montenegro and Landfester [36], the phase transition behaviour for even-numbered n-alkanes is characterized by two phases: a first one, at higher temperatures, named metastable orthorhombic rotator phase, and a second one at lower temperatures, accounting for the stable solid-solid phase transition of the material. The same pattern could be observed for emulsions containing these types of molecules, as observed by Hagelstein and Gschwander [37]. Therefore, the peak occurring at 3°C corresponds to the stable solid-solid phase transition of the PCMEs. As visible, the peaks become steeper with an increasing percentage of PCM. For emulsions with a lower hexadecane content, two peaks could be observed in the metastable orthorhombic rotator phase transition region, which tend to merge into a larger one as the PCM content increases. Gschwander et al. [6] observed that this type of phase transition usually accounts for 70–75% of the total crystallization enthalpy of the emulsions.
The main temperatures that define the phase change period are reported in Table 4. As similarly observed for the density measurements, the difference in PCM content has no effect on the characteristic phase transition temperatures. It could be concluded that the main difference between the DSC curves does not lie on the phase change behaviour of the emulsions, but on the amount of PCM dispersed in the solutions, which is proportional to the magnitude of the heat flux peaks during the phase transitions of the PCMEs.
| PCME | ΔTmelt | ΔTcool | S | TBE | HBE | |||||||
|---|---|---|---|---|---|---|---|---|---|---|---|---|
| PCM fraction | Surfactant adjusted to PCM | °C | °C | °C | °C | °C | °C | K | K | K | °C | kJ/kg |
| 10 wt. % | Yes | 14.4 | 18 | 11.5 | 8.5 | 15.6 | 10.1 | 3.6 | 9.5 | 6.5 | 10.8 | 31 |
| 20 wt. % | Yes | 14.4 | 17.9 | 11.9 | 6.2 | 15.7 | 10.3 | 3.5 | 11.7 | 6.0 | 11.2 | 29 |
| 25 wt. % | Yes | 14.4 | 18.1 | 11.7 | 8.5 | 15.8 | 10 | 3.7 | 9.6 | 6.4 | 10.9 | 31 |
| 30 wt. % | Yes | 13.9 | 17.7 | 11.8 | 7.1 | 15.7 | 10 | 3.8 | 10.6 | 5.9 | 10.9 | 33 |
| 30 wt. % | No | 14.5 | 18.5 | 11.8 | 8.5 | 16.1 | 9.9 | 4.0 | 10.0 | 6.7 | 10.8 | 32 |
| 35 wt. % | Yes | 14.7 | 18.1 | 11.3 | 8.2 | 16.1 | 10.1 | 3.4 | 9.9 | 6.8 | 10.9 | 32 |
| 40 wt. % | No | 14.6 | 18.2 | 11.7 | 7.8 | 16.1 | 10 | 3.6 | 10.4 | 6.5 | 10.8 | 31 |
On average, the melting process occurs between 14.4 and 18.1°C for all the PCMEs. However, because of an average supercooling degree of 6.4 K, the crystallization is shifted to a lower temperature range between 11.7 and 7.8°C. For this reason, the temperature range necessary to discharge the full heat of crystallization of the emulsions is considerably wider than the melting temperature range.
The graphs in Figure 7 report the enthalpy exchanged from water within the same temperature range, considering a value of 4.19 kJ/(kg K) for its specific heat capacity [38].
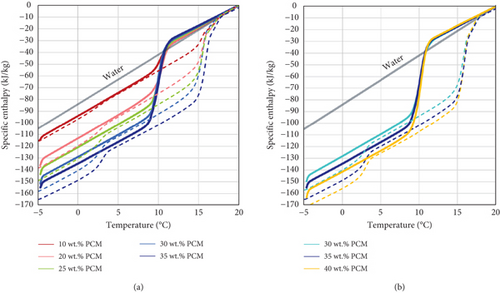
As visible, the storage capacity of the PCMEs is considerably higher than that of water, if a temperature range close to their phase transition is considered. In fact, the latent heat of fusion, which is responsible for the increased steepness of the enthalpy curves during heating (dotted curves), is absorbed by the materials in a relatively narrow temperature range of 3.7 K.
On the other hand, a different behaviour is observed during the cooling period (continuous curves) due to supercooling, as the latent heat of crystallization is fully released on average after 10.2 K (ΔTcool). It could be concluded that supercooling represents a severe drawback for the technology, as larger temperature ranges must be used for the heating and cooling cycles to match the full melting and crystallization of the materials. This in turn lowers the energy efficiency of the system for two main reasons. First, if the operating temperature range is larger, a greater amount of energy is required to heat the material during the charging process. Secondly, supercooling reduces the potential advantage of PCMEs over conventional water systems within narrow temperature ranges.
A clear example is provided by the analysis of the storage break-even temperature for the PCMEs. Without supercooling, the crystallization of the PCMEs would start at the same temperature at which the melting ends. Thus, because of the release of their latent heat of crystallization, the emulsions would be immediately more convenient than conventional water systems in terms of storage capacity. However, due to supercooling, the materials discharge only sensible heat for a temperature range of, on average, 6.4 K. Additionally, the specific heat capacity of water is higher than that for the PCMEs. In fact, the hexadecane is characterized by a specific heat capacity of around 2.2 kJ/(kg K) at its phase change temperature [39]. Therefore, the amount of sensible heat released by water in this temperature range is higher than that of emulsions, as confirmed by the higher steepness of its enthalpy curve. For this reason, the PCMEs become, on average, more convenient than water only after 7.2 K, i.e., at the storage break-even temperature TBE of 10.9°C, which is lower than the crystallization starting temperature.
The same could be concluded by comparing the storage density of the PCMEs and water within the temperature ranges of 6, 8, 10, and 12 K. During the cooling cycle (Figure 8(a)), the presence of supercooling reduces the amount of energy released by the PCMEs, particularly within the narrowest temperature range of 6 K. On the other hand, as the storage break-even temperature takes place after 7.2 K, all the PCMEs are more energy-dense than water in the temperature ranges of 8, 10, and 12 K.
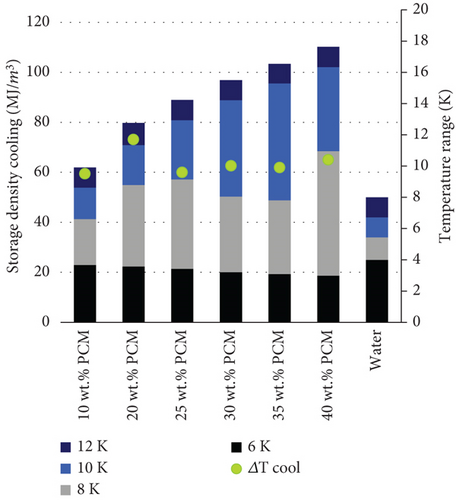
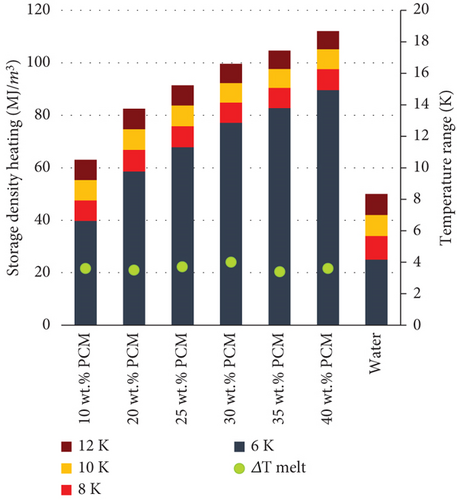
Moreover, the storage capacity derived from the PCMEs increases proportionally with the hexadecane content. However, increasing the PCM fraction does not necessarily imply greater energy savings for the system [7]. For instance, the drawback of introducing greater amounts of PCM lies in the exponential increase in the dynamic viscosity of the solution, as confirmed from the rheological measurements. When PCMEs are hydraulically integrated in heat transfer systems, the estimation of the pumping power needed for their circulation usually accounts for a large part of the total energy consumption of the application considered. Therefore, it is clear that operating with low-viscous emulsions becomes important in terms of energy savings, as this affects pressure drop, when the flow rate is kept constant [8]. On the other hand, the higher storage density of the medium allows flow rate reductions in the pipe system. Therefore, a holistic approach on the system-side energy consumption of the final application is recommended to evaluate the optimal percentage of PCM which guarantees the greatest energy savings according to all the above-mentioned parameters.
The percentage of oil phase reported in the most frequent and successful formulations available in literature [6, 40–43] does not exceed 35 wt. % and is usually between 20 and 30 wt. %. Indeed, this fraction is highly dependent on the latent heat of fusion of the material which is used as PCM. In this study, the emulsion with 35 wt. % hexadecane fraction could store up to 105 MJ/m3 when a temperature range of 12 K is considered for the cycling (heating period) and releases roughly the same amount of energy during the cooling period. However, when a smaller temperature range of 8 K is considered, the amount of energy stored by the material almost doubles the quantity that is effectively released during its crystallization, i.e., 49 MJ/m3. Therefore, the supercooling reduction plays an determinant role in unlocking the real storage potential of the technology.
The storage densities calculated on the heating curves are presented in Figure 8(b) to show the storage benefit of the technology in case of no supercooling, which is considered one of the main objectives of future PCME formulations [24]. In this case, the storage would take maximum advantage of the latent heat of fusion of the PCMEs already from the smallest temperature range of 6 K. In fact, the latent heat exchange occurs within 4 K for all the emulsions considered (ΔTmelt). Thus, the storage contribution accountable after 4 K is only in terms of sensible heat, and it is directly proportional to the temperature range considered. It is possible to notice that in all the cases considered, the PCME storage is always more advantageous than water. According to the results, the 35 wt. % hexadecane emulsion can store and release 83 MJ/m3 within a temperature range of 6 K, when no supercooling is present, as reported in Table 5.
| PCME | 6 K | 8 K | 10 K | 12 K | |||||
|---|---|---|---|---|---|---|---|---|---|
| Heat | Cool (S) | Heat | Cool (S) | Heat | Cool (S) | Heat | Cool (S) | ||
| PCM fraction | Surfactant adjusted to PCM | MJ/m3 | MJ/m3 | MJ/m3 | MJ/m3 | MJ/m3 | MJ/m3 | MJ/m3 | MJ/m3 |
| 10 wt. % | Yes | 40 | 23 | 48 | 41 | 55 | 54 | 63 | 62 |
| 20 wt. % | Yes | 59 | 22 | 67 | 55 | 75 | 71 | 83 | 80 |
| 25 wt. % | Yes | 68 | 21 | 76 | 57 | 84 | 81 | 91 | 89 |
| 30 wt. % | Yes | 76 | 20 | 84 | 55 | 92 | 89 | 99 | 98 |
| 30 wt. % | No | 77 | 20 | 85 | 50 | 92 | 89 | 100 | 97 |
| 35 wt. % | Yes | 83 | 19 | 90 | 49 | 98 | 96 | 105 | 103 |
| 40 wt. % | No | 90 | 19 | 98 | 68 | 105 | 102 | 112 | 110 |
| Water | 25 | 34 | 42 | 50 | |||||
Previous studies show that it is possible to further reduce the degree of supercooling of emulsions by introducing nucleating agents in the solution, such as solid paraffin wax, nanomaterials, and surfactants [26]. Although the materials used in this study are already able to limit the supercooling of the PCMEs to 6.4 K, further improvements are auspicial to take full advantage from their latent storage capacity.
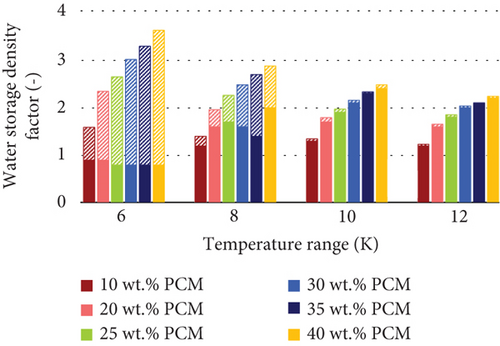
In agreement with the previous results, the water storage density factor is always greater than one for the emulsions without supercooling (heating period) within all the temperature ranges investigated (Figure 9). However, if supercooling is considered, the factor is greater than one only when the temperature range is wide enough to include the storage break-even temperature, e.g., at 8 K, 10 K, and 12 K. As follows from previous observations, the difference in terms of storage density between the cases with and without supercooling is greater within narrow temperature ranges. Furthermore, the water storage density factor decreases with wider temperature ranges, as the latent heat of crystallization is released by the PCMEs (Table 6).
| PCME | SDF 6 K | SDF 8 K | SDF 10 K | SDF 12 K | |||||
|---|---|---|---|---|---|---|---|---|---|
| Heat | Cool (S) | Heat | Cool (S) | Heat | Cool (S) | Heat | Cool (S) | ||
| PCM fraction | Surfactant adjusted to PCM | ||||||||
| 10 wt. % | Yes | 1.6 | 0.9 | 1.4 | 1.2 | 1.3 | 1.3 | 1.3 | 1.2 |
| 20 wt. % | Yes | 2.4 | 0.9 | 2.0 | 1.6 | 1.8 | 1.7 | 1.7 | 1.6 |
| 25 wt. % | Yes | 2.7 | 0.8 | 2.2 | 1.7 | 2.0 | 1.9 | 1.8 | 1.8 |
| 30 wt. % | Yes | 3.0 | 0.8 | 2.5 | 1.6 | 2.2 | 2.1 | 2.0 | 2.0 |
| 30 wt. % | No | 3.1 | 0.8 | 2.5 | 1.5 | 2.2 | 2.1 | 2.0 | 1.9 |
| 35 wt. % | Yes | 3.3 | 0.8 | 2.6 | 1.4 | 2.3 | 2.3 | 2.1 | 2.1 |
| 40 wt. % | No | 3.6 | 0.8 | 2.9 | 2.0 | 2.5 | 2.4 | 2.2 | 2.2 |
4.4. Rheology
According to the rheological measurements reported in Table 7, the viscosity of the PCMEs increases exponentially with the PCM fraction. In addition, the kinematic viscosity varies severely for emulsions with a hexadecane fraction equal to or greater than 35 wt. %. This result supports the suggestion to use PCM fractions lower than 35 wt. %, to not severely impact, in terms of pumping power consumption, the energy savings coming from the storage.
| PCME | ν | |||||
|---|---|---|---|---|---|---|
| 6°C | 8°C | 10°C | 12°C | 18°C | ||
| PCM fraction | Surfactant adjusted to PCM | mm2/s | mm2/s | mm2/s | mm2/s | mm2/s |
| 10 wt. % | Yes | 2.6 | 2.4 | 2.3 | 2.2 | 1.9 |
| 20 wt. % | Yes | 5.3 | 4.8 | 4.5 | 4.4 | 3.8 |
| 25 wt. % | Yes | 8.6 | 7.9 | 7.5 | 7.3 | 6.4 |
| 30 wt. % | Yes | 15.9 | 15.6 | 15.0 | 14.9 | 13.2 |
| 30 wt. % | No | 19.2 | 17.2 | 16.2 | 15.8 | 13.9 |
| 35 wt. % | Yes | 36.8 | 33.5 | 32.0 | 32.0 | 29.1 |
| 40 wt. % | No | 60.1 | 79.0 | 89.7 | 92.1 | 85.4 |
The kinematic viscosity of each emulsion is plotted at the temperatures of 6, 8, 10, 12, and 18°C (Figure 10). These latter correspond to the temperatures used for the storage density evaluation after 6, 8, 10, and 12 K from the end of melting, which occurs on average at 18°C for all the PCMEs. As readable from the results in Table 7, the viscosity pattern tends to follow the usual inverse relationship with temperature. However, in the case of the emulsion with 40 wt. % PCM, this is not true.
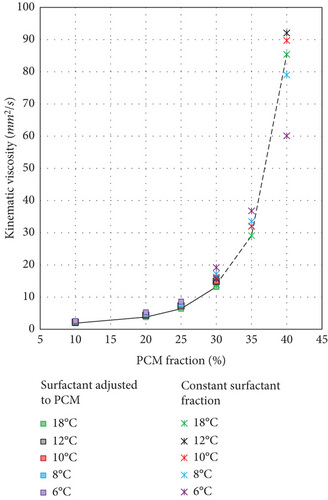
Table 8 reports the dynamic viscosity detected for each emulsion at 0 and 30°C. The second and the 100th cycles are compared to assess the overall variation in viscosity experienced by the sample throughout the degradation test performed with the rheometer. In particular, the second cycle is chosen as the representative status of the initial conditions of the PCME. In fact, the values registered during the first cycle are considered inaccurate, as the material readjusted to the measurement conditions. In addition, considering the average value between the first cycles might also lead to misleading results, as some emulsions changed rapidly their viscosity, due to the high instability of the sample.
| PCME | μ0°C | μ30°C | μmax | Status after test | ||||
|---|---|---|---|---|---|---|---|---|
| Cycle 2 | Cycle 100 | Cycle 2 | Cycle 100 | Cycle 100 | T | |||
| PCM fraction | Surfactant adjusted to PCM | mPa s | mPa s | mPa s | mPa s | mPa s | °C | |
| 10 wt. % | Yes | 3 | 3 | 2 | 2 | 3 | 0 | Liquid |
| 20 wt. % | Yes | 7 | 7 | 3 | 3 | 7 | 0 | Liquid |
| 25 wt. % | Yes | 13 | 12 | 5 | 5 | 13 | 2 | Liquid |
| 30 wt. % | Yes | 22 | 21 | 10 | 11 | 23 | 2 | Liquid |
| 30 wt. % | No | 23 | 28 | 10 | 12 | 31 | 3 | Liquid |
| 35 wt. % | Yes | 48 | 66 | 24 | 27 | 66 | 0 | Mostly liquid |
| 40 wt. % | Yes | 72 | 134 | 66 | 160 | 187 | 10 | Creamy |
Regarding the evaluation of thermomechanical stability, all the emulsions with PCM fractions lower than 35 wt. % show very high levels of stability and small variations in dynamic viscosity throughout the 100 cycles. Moreover, their initial dynamic viscosity is equal to or lower than 23 mPa s (0°C) and reaches a maximum of 31 mPa s by the end of the degradation test for the emulsion with 30 wt. % hexadecane. The high stability of these samples is further confirmed by the physical status of the emulsions after the test, which remains at liquid state and without creaming or other visible signs of degradation. It could be therefore concluded that this group of PCMEs maintains its physical characteristics even when exposed to a combination of thermal and mechanical loads.
Moreover, adjusting the surfactant fraction to the PCM content improves the stability of the PCME, as noticeable for the emulsion with 30 wt. % hexadecane fraction, which is overall more stable than the one with a fixed amount of PCM (Table 8).
Figure 11 shows the pattern of the dynamic viscosity during the entire duration of the rheometer test, within the temperature range of 0–30°C and for a total of number of cycles equal to 100. A viscosity range could be identified for each emulsion and at each cycle, with the lower and upper limits corresponding to the temperatures of 30 and 0°C, respectively. It could be observed that the dynamic viscosity at 0°C increases more rapidly than at 30°C. This behaviour might be favored by the reduced deformation of the solid PCM particles below their crystallization point. Therefore, the shear stresses are less homogeneously propagated within the solution, and the friction between the dispersed and continuous phases increases [44].
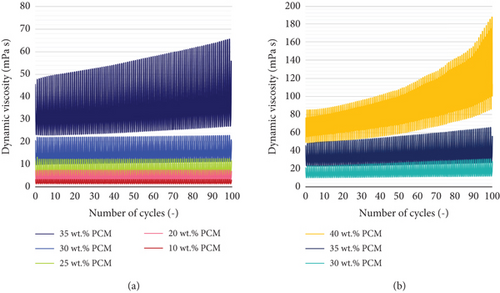
On the contrary, the emulsions with 35 and 40 wt. % PCM content show major signs of instability, i.e., a steep increase in dynamic viscosity and creaming by the end of the test. In particular, the PCME with 40 wt. % hexadecane content presents the greatest instability, as its viscosity increases exponentially with the number of cycles (Figure 11). Furthermore, the maximum viscosity value is unexpectedly recorded at a temperature of 10°C at the end of the test (Table 8). In fact, unlike all the other emulsions, this sample presents huge fluctuations in viscosity at each cycle, close to the phase transition of the material. Moreover, the magnitude of the fluctuations increases with the number of cycles, so that the viscosity of the PCME at 30°C is higher than at 0°C by the end of the test.
Similar behaviours have already been observed in literature for PCM dispersions undergoing their phase transition [45–47]. Wang et al. [48] investigated the rheological behaviour of paraffin O/W nanoemulsions. They observed drastic fluctuations in viscosity during the heating process of the PCMEs and close to the phase transition of the materials, which they attributed to changes in the particle size of the paraffin. In addition, their rheological measurements showed an increase in viscosity after 300 heating and cooling cycles. Dutkowski and Fiuk [49] compared the viscosity behaviour of micro and nano-mPCM slurries with the enthalpy released by the materials in the same temperature range and found an increase in viscosity at the phase transition temperature of the PCM during the cooling process. The authors attributed this change in viscosity to a volume expansion and a change of shape of the oil phase during the solid-liquid transition. In a previous study [50], they observed a viscosity plateau in the phase change temperature range of the mPCME, which did not follow the physical relationship viscosity-temperature. Then, a drop in the viscosity of the suspension was registered, after its melting point. Cabaleiro et al. [51] investigated the dynamic viscosity, surface tension, and wetting behaviour of paraffin nanoemulsions at low concentrations of 2, 4, and 10 wt. % PCM. A change in the exponentially decreasing viscosity trend of the sample with 10 wt. % PCM was observed at the phase change temperature of the material. In agreement with previous studies, the authors defined a deformation in the viscosity curve μ(T) caused by changes in the shape or volume of PCM droplets undergoing their melting process. Moreover, the authors found that the droplet surface tension was higher at lower temperatures, e.g., when paraffin was in a solid state. They argued that, during the solidification of the drops, their surface might have remained partially uncovered by surfactants.
Starting from this last observation, it is hypothesized that, in the case of the 40 wt. % hexadecane PCME investigated in this study, the emulsifier fraction introduced might be not enough to surround completely and efficiently the dispersed PCM phase. In fact, according to the formulation used, the surfactant fraction is not adjusted to the PCM content for this PCME. This could have caused the formation of paraffin droplets partially or completely in contact with the water phase. Therefore, if a variation in shape and volume of the particle occurs during the phase change process, this would increase the droplet diameter during the heating phase and reduce it during the cooling. Also, it is known that PCMEs undergo greater volume changes compared to other slurries, as the PCM is not encapsulated in a shell that maintains its shape [52]. The surfactant could also partially act as a shell, even though assuring a higher degree of movement to the particle, especially at moderate emulsifier concentrations [53]. It is known that the oil expansion coefficient depends on the properties of the PCM selected. Cabeza et al. [54] investigated the volume changes of four classes of organic PCMs during the phase transition. For the investigated materials, the volume changed in a range between 2.44 and 23.53%. The rate of these expansions changes when the PCM is dispersed into a liquid, with a strong dependence on the interfacial properties between the two phases. Previous studies have shown that the particle size of the dispersed phase affects the interfacial rheology of the emulsion, especially in relation to the quantity of surfactant which is absorbed at the surface of each droplet [53]. For instance, a smaller amount of emulsifier increases the interfacial mobility of the dispersed droplets.
Following the path in Figure 12, it could be observed that the PCME initially decreases its viscosity with increasing temperature (A and B). However, when the phase transition starts (B), a steep increase in viscosity is recorded. Therefore, it is suggested that as the PCME melts, the particles increase their average diameter, as well as the surface exposed to the water phase. At this point, the ratio of surfactant available at the surface of each droplet decreases, leading to significant changes in interfacial rheology, which can determine an increase in interfacial viscosity [55]. The viscosity increase ends at the end of the melting process (C). From this point on, the viscosity diminishes and stabilizes with a plateau corresponding to the isotherm at the higher temperature. Then, as the cooling process starts (D), the viscosity increases with decreasing temperatures. The pattern does not mirror the heating period, as the presence of supercooling delays the beginning of the crystallization (E). On the other hand, during periods E and F, the PCM solidifies, and the volume and interfacial surfaces of the droplets decrease. Therefore, the interfacial rheology between the two phases readjusts again to the surfactant-to-surface ratio, causing a drop in viscosity. After the minimum is reached (end of crystallization), the viscosity starts to increase again, following the known μ(T) pattern.
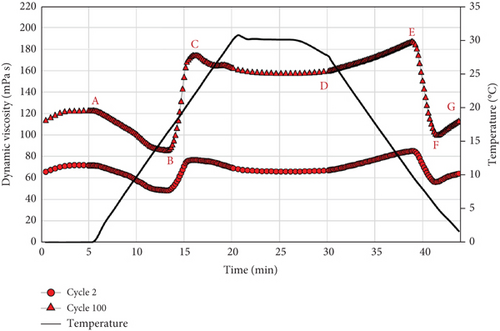
If these assumptions are correct, it could be concluded that an inadequate amount of surfactant not only reduces the stability of the emulsion but alters the interfacial rheology between the two phases, causing anomalously high fluctuations in viscosity during the phase transition of the PCM. This clearly constitutes a drawback for the system, as it leads to nonnegligible changes in the pressure drop during the cycling process. In light of the rheological results, it is suggested to properly adjust the surfactant fraction to the PCM content of the emulsion, as this minimizes the interfacial viscosity of the two phases and improves the stability of the PCME.
5. Conclusion
- (i)
The high energy methods used during the fabrication of the PCMEs can successfully reduce the average droplet diameter to the nanometer scale, to achieve higher emulsion stability
- (ii)
Because of the lower density of the dispersed hexadecane phase, the density of water is always higher than that of PCMEs. Moreover, the presence of supercooling is confirmed by the changes in density experienced by the PCMEs within their phase transition region, which occur within different temperature ranges depending on the heat exchange process (e.g., heating or cooling)
- (iii)
According to the DSC measurements, the melting process occurs on average between 14.4 and 18.1°C for all the PCMEs. The different PCM enrichment of the fluids has no influence on the temperature range at which the phase transition occurs but is directly proportional to the storage capacity of the emulsions. However, the dynamic viscosity of the PCMEs increases exponentially with the oil fraction, with negative consequences on the pressure drop and on the energy savings coming from the storage solution. This is particularly severe for emulsions with a hexadecane fraction equal to or greater than 35 wt. %
- (iv)
The surfactant fraction should be adjusted to the PCM content of the emulsion, as this minimizes the interfacial viscosity of the two phases and improves the stability of the PCME
- (v)
Because of an average supercooling degree of 6.4 K, larger temperature ranges must be considered during the heating and cooling cycles to achieve the full melting and crystallization of the dispersed PCM phase. Moreover, due to the combined effect of the supercooling and the lower specific heat capacity of the emulsions, the PCMEs become, on average, a more convenient storage solution than water only after 7.2 K, i.e., at the storage break-even temperature TBE of 10.9°C, which is lower than the crystallization starting temperature
All in all, the emulsion with 30 wt. % hexadecane fraction and surfactant concentration adjusted to the PCM content is considered a better compromise for the current formulation. The rheological measurements show a high level of stability and resistance to thermomechanical loads over time. In addition, the dynamic viscosity of the emulsion is in the range between 10 and 22 mPa s, within the temperature range of 0–30°C. Furthermore, the storage density of this PCME is equal to 98 MJ/m3 within an operating temperature range of 12 K, doubling that of water, despite the presence of supercooling. However, when supercooling is optimally reduced to zero, the water storage density factor for this emulsion could be as high as three within a temperature range of 6 K. It could be concluded that the low viscosity obtained, together with the high level of stability of the PCME and its high storage density, makes this storage solution promising and able to allow greater energy savings with respect to conventional water storage systems.
Nomenclature
-
- HLB:
-
- Hydrophilic to lipophilic balance
-
- Dx:
-
- Particle size distribution
-
- ρPCME:
-
- Density of phase change material emulsion
-
- ρPCM:
-
- Density of phase change material
-
- ρW:
-
- Density of water
-
- ρexp:
-
- Experimental density
-
- ρth:
-
- Theoretical density
-
- ρa:
-
- Analytical density
-
- XPCM:
-
- Mass fraction of phase change material
-
- XW:
-
- Mass fraction of water
-
- :
-
- Temperature at beginning of melting
-
- :
-
- Temperature at end of melting
-
- :
-
- Temperature at beginning of crystallization
-
- :
-
- Temperature at end of melting
-
- TH:
-
- Temperature heating
-
- TC:
-
- Temperature cooling
-
- :
-
- Peak temperature melting
-
- :
-
- Peak temperature crystallization
-
- TBE:
-
- Storage break-even temperature
-
- Tf:
-
- Lowest temperature during cycling
-
- ΔTmelt:
-
- Temperature range melting
-
- ΔTcool:
-
- Temperature range cooling
-
- :
-
- Specific enthalpy of the emulsion
-
- :
-
- Volumetric enthalpy density of the emulsion
-
- HBE:
-
- Storage break-even enthalpy
-
- SDF:
-
- Storage density factor
-
- S:
-
- Supercooling
-
- γ:
-
- Shear rate
-
- μ:
-
- Dynamic density
-
- ν:
-
- Kinematic density.
Conflicts of Interest
The authors declare that they have no conflicts of interest.
Authors’ Contributions
Conceptualization was conducted by F.G.; methodology was conducted by F.G. and S.G.; investigation was conducted by F.G.; data curation was conducted by F.G.; writing the original draft preparation was conducted by F.G.; writing, review, and editing were conducted by F.G. and S.G.; visualization was conducted by F.G.; supervision was conducted by S.G.; project administration was conducted by S.G.; funding acquisition was conducted by S.G.
Acknowledgments
The authors are grateful to the German Federal Ministry for Economic Affairs and Climate Action (BMWK) for funding this study (grant no.: 03EN6001A) and the Project Management Jülich for the administrative support. Open access funding is enabled and organized by Projekt DEAL.
Open Research
Data Availability
The measurement data used to support the findings of this study have not been made available because of restriction given by the project partners.


