Two Triterpenoids, ARM-2 and RA-5, From Protorhus longifolia Exhibit the Potential to Modulate Lipolysis and Lipogenesis in Cultured 3T3-L1 Adipocytes
Abstract
Triterpenoids have been identified as potential novel lipid-lowering drugs for the treatment of hypertriglyceridemia. This study investigated the potential antilipogenic and/or antilipolytic effects of two triterpenoids (ARM-2 and RA-5) isolated from the stem bark of Protorhus longifolia (Benrh.) Engl. Employing a combination of in silico predictions and in vitro assays, the interactions between these triterpenoids and key proteins involved in lipogenesis and lipolysis were investigated. In silico molecular docking analysis predicted a favourable binding affinity of both triterpenoids to PPARγ, SREBP-1, and AMPK, with lower binding affinity to C/EBPα, pancreatic lipase, and hormone-sensitive lipase (HSL). Both triterpenoids exhibited in vitro inhibition of pancreatic lipase with Ki and IC50 values ranging from 28.7 to 52.9 μM and 27.6 to 35.8 μM, respectively. Total and neutral lipid accumulation in differentiated 3T3-L1 adipocytes and the oleic acid–induced HepG2 cell model was inhibited, with ARM-2 showing better inhibition than RA-5. In the HepG2 model, the inhibitory activity of the two triterpenoids (at 25 and 100 μM) was comparable to 50 μM lovastatin, although the latter was cytotoxic, whereas both ARM-2 and RA-2 lacked cytotoxicity. Associated gene expression was similar to the effect of simvastatin where the expression of SREBP-1, PPARγ, C/EBPα, and HSL was reduced and that of AMPK was unchanged. In vitro studies confirmed that ARM-2 and RA-5 also inhibited adipocyte lipolysis, where the reduction in glycerol release by 25 and 100 μM was similar to 50 μM lovastatin and simvastatin. This study identifies that the triterpenoids, ARM-2 and RA-5, have the potential to modulate lipogenesis and lipolysis.
1. Introduction
Abnormally elevated triglyceride (TG) levels in the bloodstream, referred to as hypertriglyceridemia (HTG), are closely linked to obesity and significantly heighten the risk of atherosclerotic cardiovascular disease and Type 2 diabetes mellitus. The rising prevalence of HTG in recent years has been a global concern, as HTG affects not only the quality of life but also contributes to high healthcare costs and high mortality rates [1, 2]. In addition to genetic predispositions, the risk of developing HTG increases with age, increased body weight, and insulin resistance, with sedentary lifestyles and consumption of high-fat diets having a further contributing effect [3, 4].
The development of HTG is largely related to the excessive synthesis and secretion of triglyceride-rich lipoproteins (TRLs) such as chylomicron and very-low-density lipoproteins (VLDLs), along with impaired plasma TRL clearance [2]. Subsequently, excess TGs in the blood and carbohydrate metabolites stimulate lipogenesis and lead to the storage of excess fats in adipose tissue. Key transcription factors, including sterol regulatory binding elements (SREBP-1), PPARγ, and C/EBPα, play pivotal roles in fatty acid and TG synthesis, contributing to adipocyte expansion, a hallmark of obesity. Modulating certain lipogenic genes, such as SREBP-1 and adenosine monophosphate (AMP)–activated protein kinase (AMPK), has shown promising therapeutic benefits in lowering elevated blood lipids [5].
While adipocyte lipolysis can help reduce intracellular lipid accumulation, this also results in the release of TGs into the bloodstream as free fatty acids (FFAs) and glycerol. The flux of FFA into the blood stimulates hepatic fatty acid uptake and subsequent de novo lipogenesis. Hepatic TGs can either be stored as cytosolic lipids or assembled into VLDLs. The TRLs are released into the bloodstream where, if not properly cleared, they contribute to HTG [6]. Hepatic lipid accumulation can also lead to fatty liver diseases such as nonalcoholic fatty liver disease.
Since a diet rich in TGs exacerbates the risk of HTG, inhibiting dietary TG digestion and absorption has been an attractive strategy for reducing circulating TG levels. Orlistat, a pharmacological agent that functions by competitively inhibiting pancreatic lipase (PNLIP), is currently among the primary treatments for HTG. Statins such as simvastatin and lovastatin primarily target cholesterol synthesis and manage high cholesterol levels and are also used for the management of HTG [7]. However, the clinical use of the current lipid-lowering agents is limited due to various adverse side effects, including loss of libido, sleep disturbances, nausea, and allergic reactions [8, 9]. Therefore, there is a need for new biologically derived compounds for the treatment and management of lipid disorders that are as effective as existing drugs but have fewer or no side effects with the further benefit of multitarget effects on HTG [10, 11].
Due to their wide array of biological effects, triterpenoids have emerged as promising candidates for use as potential pharmacological agents for treating metabolic disorders [12–14]. Our research group has previously demonstrated the hypolipidemic [14, 15] and hypoglycemic [16] potentials of 3β-hydroxylanosta-9,24-dien-21-oic acid (RA-5) and methyl-3β-hydroxylanosta-9,24-dien-21-oate (RA-3), the lanosterol triterpenes from the stem bark of Protorhus longifolia (Benrh.) Engl. The hypocholesterolemic effects of RA-5 and a newly isolated triterpenoid (3α,26-dihydroxytirucalla-7,24-dien-21-oic acid [ARM-2]) from P. longifolia stem bark have recently been reported, and their bioactivity was linked to the regulation of cholesterol synthesis and LDL uptake in HepG2 cells [17]. As a result, the current study has sought to further evaluate the antilipogenic and/or antilipolytic effects of both ARM-2 and RA-5.
2. Materials and Methods
2.1. Reagents
The reagents purchased from Sigma-Aldrich Co (St. Louis, MO, United States) were oleic acid (OA), lipase from porcine pancreas, crystal violet (CV), Oil Red O (ORO), Nile red (NR), Lipolysis Colorimetric Assay Kit (MAK211), orlistat, simvastatin, lovastatin, dexamethasone, rosiglitazone, isobutylmethylxanthine, and insulin. Mouse 3T3-L1 fibroblasts and human HepG2 hepatoma were purchased from the American Type Culture Collection (ATCC) (Manassas, VA, United States). Dulbecco’s modified Eagle’s medium (DMEM) and foetal calf serum (FCS) were purchased from SepSci (Johannesburg, RSA) and BioSom (Pretoria, RSA). Oligo primers were purchased from Inqaba Biotech (Pretoria, RSA). An SV Total RNA isolation kit, GoScript Reverse Transcription Kit, and GoTaq qPCR Master Mix were purchased from ANATECH (Johannesburg, RSA). Oligo primers were purchased from Inqaba Biotech. An SV Total RNA isolation kit, GoScript Reverse Transcription Kit, and GoTaq qPCR Master Mix were purchased from ANATECH (Gauteng, RSA).
2.2. Plant Extraction and Isolation of the Plant Compounds
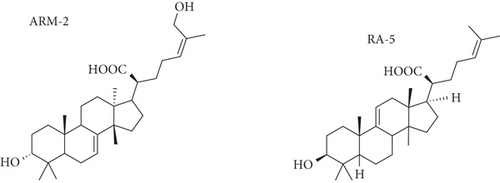
The plant triterpenoids ARM-2 and RA-5 were routinely isolated from the chloroform extract of P. longifolia stem bark (Voucher Specimen Number RA01UZ) following previously described protocols [17, 18]. The chemical structures of ARM-2 and RA-5 (Figure 1) were confirmed based on spectral (NMR, IR, and HRESIMS) data analysis and by comparison with literature data [17, 18].
2.3. Molecular Docking of the Compounds
The molecular docking of the compounds against PNLIP (2OXE), AMPK (5ISO, 4CFF), hormone-sensitive lipase (HSL) (3DNM), PPARγ (5GTN), C/EBPα (1NWQ), and SREBP-1 (5GPD) was evaluated using Maestro from Schrodinger (2022_1). Three-dimensional crystal structures of the enzymes and proteins were obtained from the RCSB Protein Data Bank (PDB). While the SMILE notations of the reference standards were obtained from PubChem, those of the triterpenoids were generated after drawing their 2D structures in ACD/ChemSketch (freeware). The LigPrep function was used to prepare the ligands, while the protein preparation wizard was used to prepare the enzymes and proteins. Site mapping was performed to detect the catalytic sites of the proteins, followed by receptor grid generation. The structure–protein interactions were visually screened using Glide Extra Precision (XP), and a Glide score of −8.00 kcal/mol was set as the cut-off for better binding [19].
2.4. Construction of the Protein–Protein Interaction (PPI) Network
The Search Tool for the Retrieval of Interacting Genes/Proteins (STRING) database (https://string-db.org/) was used to construct a PPI network of several proteins involved in lipogenesis and lipolysis. The PPI network included the following proteins: SREBP-1c, PPARγ, C/EBPα, AMPK, HSL, acetyl-CoA carboxylase (ACC) (ACACB), fatty acid synthase (FASN), and PNLIP. The resulting PPI network was subsequently visualized and analyzed using Cytoscape software Version 3.10.0 [17].
2.5. PNLIP Inhibition
The PNLIP inhibitory activity of the compounds was tested using p-nitrophenyl palmitate (p-NPP) as an artificial substrate [20]. The reaction mixture consisting of 0.061 M Tris-HCl buffer, pH 7.4, 200 U/mL porcine PNLIP, and the test compounds or orlistat (reference drug) (5–100 μM) was preincubated at 37°C for 10 min. The reaction was initiated by adding 10 mM p-NPP at 37°C for 20 min. Then, the enzyme activity was determined calorimetrically by measuring the release of p-nitrophenol measured at 405 nm using a SpectraMax paradigm microplate reader (Molecular Devices Inc, San Jose, California). The IC50 values were determined using nonlinear regression from the absorbance versus concentration curves.
2.6. Enzyme Kinetics
The modes of enzyme inhibition were determined using the reaction protocol described above. While all the other parameters remained unchanged, the enzyme activity was measured at increasing substrate concentrations (2–10 mM) in the presence and absence of the test compound (inhibitor). Double reciprocal (Lineweaver–Burk) plots were generated and used to determine the inhibition types Km and Vmax. The inhibitory constants (Ki) of the test compounds were also calculated.
2.7. Cell Culture and Maintenance
The 3T3-L1 preadipocytes and human hepatoma (HepG2) cell lines were cultured and maintained following standard protocols and procedures. Briefly, the cells were maintained and cultured in DMEM supplemented with 10% (v/v) of fetal bovine serum (FBS) and 1% (v/v) antibiotics (DMEM/FCS). Standard cell culture maintenance was followed (incubation at 37°C with 5% CO2 until 70%–80% confluent) with splitting at 3–4-day intervals.
2.8. Cell Viability Assessment
The 3T3-L1 and HepG2 cells (at 70%–80% confluence) were seeded at concentrations of 0.2 × 10⁴ per 100 μL and 5.0 × 10⁴ per 100 μL, respectively, in a 96-well plate. After 72 h of growth at 37°C and 5% CO2 until confluent, the cells were exposed to the test compounds (1–100 μM) for a further 72 h at 37°C and 5% CO2. Control cells were exposed to either 0.01% methanol (vehicle control) or sterile phosphate buffered saline (PBS) pH 7.4. Following the exposure, the cells were fixed with 20% formalin (final concentration 2% [v/v]) at 37°C for 30 min. The solution was discarded, and the plate was blotted dry. The cells were stained with the addition of 100 μL f CV (0.1% in 200 mM formic acid) to each well. After 30 min at room temperature, the dye solution was removed, and the plate was washed well with tap water and dried. The dye was then extracted from the stained cells with 100 μL of a 10% (v/v) acetic acid solution. The absorbance was measured at 630 nm, and the results were expressed as percentage cell viability relative to the control (cells treated with PBS).
2.9. 3T3-L1 Cell Differentiation
The differentiation of 3T3-L1 cells was performed as described by Ibrahim et al. [21] with slight modifications. The preadipocyte cells were seeded at a concentration of 0.2 × 10⁴ per 100 μL into each of the wells of a 96-well plate and were grown at 37°C with 5% CO2 for 3 days, until confluent. On Day 4, differentiation was induced by replacing the medium with 100 μL Differentiation Medium 1 (DM1, DMEM supplemented with final concentrations of 10 μg/mL insulin, 0.5 mM isobutyl methylxanthine, 1 μM dexamethasone, and 2 μM rosiglitazone) for further 3 days. On Day 8, DM1 was replaced with DM2 (DMEM with only 10 μg/mL insulin) for 3 days. Finally, DM2 was replaced with only DMEM, and the cells were exposed to the different concentrations (1–100 μM) of the test compounds for a further 3 days. Control cells were exposed to either the vehicle control or sterile PBS.
2.10. Hepatic Lipid Accumulation
The HepG2 cells were seeded in a 96-well plate at a cell density of 5 × 10⁴ and left to attach overnight. The cells were incubated at 37°C, 5% CO2 for 48 h, and 1 mM OA (final concentration) to stimulate lipid accumulation [22]. The cells were then treated with the drug control, lovastatin (10 and 50 μM), or ARM-2 and RA-5 (10, 25, and 100 μM) for a further 48 h [17]. Control cells were exposed to either the vehicle control or sterile PBS.
2.11. ORO Staining
The ORO staining technique was used to detect lipid droplets in both differentiated adipocytes and OA-exposed hepatocytes. The cells were fixed with 2% (v/v) formaldehyde for 30 min at 37°C. The formaldehyde was then discarded, and the plates were air-dried. The fixed cells were stained with ORO staining solution (three parts of 0.5% ORO (w/v) in 60% isopropyl alcohol and two parts of water) for 1 h. After staining, the excess ORO was discarded, and the plates were rinsed with water and dried. Microscopic images were acquired with an Olympus microscope (Olympus, Tokyo, Japan). The ORO dye was then extracted with 60% isopropanol, and the absorbance was measured at 405 nm. For the 3T3-L1 cells, the percentage of lipid accumulation was relative to the control cells (PBS-treated) cells, with 100% lipid formation, while for HepG2, the results were expressed as the percentage of lipid accumulation relative to cells exposed to OA.
2.12. NR Staining
With NR staining, the accumulation of neutral lipids was assessed in the differentiated 3T3-L1 cells and OA-induced lipid accumulation in HepG2 cells following treatment with the triterpenoids. The cells were washed with PBS and fixed with 4% formaldehyde for 1 h, and then the cells were stained with the NR staining solution (100 μM in 100% DMSO) in the dark for 3 h. Background fluorescence was measured at an excitation and an emission wavelength of 485 nm and 590 nm (Ex4850 and Em590), respectively. The dye solution was then discarded, the wells were then rinsed with PBS, and the plate was blotted dry. The dye was extracted from the stained cells with 100 μL PBS, and the fluorescence was measured again at Ex450 and Em590. The difference in fluorescence between the extracted dye and background fluorescence was calculated. The percentage of intracellular lipid accumulation relative to the untreated control cells was calculated.
2.13. Real-Time qRT–PCR Analysis
The mRNA expression of selected lipogenic and lipolytic genes was quantified using qRT–PCR following the established protocol as described by Ndlovu et al. [17]. In brief, total RNA was extracted from 3T3-L1 cells, which were cultured, differentiated over 10 days, and subsequently treated with 50 μM simvastatin or ARM-2 or RA-5 at 25 and 100 μM for 3 days. The RNA was extracted with the Promega RNA extraction kit. The RNA was then converted into cDNA using an iScript cDNA Synthesis Kit from Promega following the manufacturer’s protocols. qRT–PCR analysis was performed using Bio-Rad CFX Maestro software. All mRNA expression levels were standardized to ensure consistency using glyceraldehyde 3-phosphate dehydrogenase (GAPDH) as a reference gene. The primers used were designed using the BLAST NCBI online server (https://www.ncbi.nlm.nih.gov/tools/primer-blast/). The primer sequences are given in Table 1. Data was expressed as fold change relative to the untreated control.
| Gene | Forward (5 ′-3 ′) | Reverse (5 ′-3 ′) |
|---|---|---|
| GAPDH | TCCTGTTCGACAGTCAGCCG | CCCCATGGTGTCTGAGCGAT |
| PPARγ | CTCGAGGACACCGGAGAGGG | GCATCCGCCCAAACCTGATG |
| HSL | GGAACGAATCTGCCTTGCGG | CGGAAGTCTCGGAGGAGCAG |
| AMPK | CGGCAAAGTGAAGGTTGGCA | GGGCCGAGTCAGGTGATGAT |
| C/EBPα | GTGCGAGCCAGGACTAGGAG | GCTGTAGCCTCGGGAAGGAG |
| SREBP-1c | TTCCGAGGAACTTTTCGCCG | CTGCTGGATCTGCGAGGTCA |
- Abbreviations: AMPK, activated mitogen protein kinase; C/EBPα, CCAAT/enhancer-binding protein; HSL, hormone-sensitive lipase; PPARγ, peroxisome proliferator-activated receptor γ; SREBP-1, sterol regulatory element binding transcription factor 1.
2.14. Measurement of Glycerol Release From Differentiated Adipocytes
In 96-well plates, confluent 3T3-L1 cells were induced to differentiate as described above. The cells were exposed to 50 μM lovastatin or simvastatin, both control drugs, 25 and 100 μM ARM-2 and RA-5, and sterile PBS and vehicle control for 3 days. Subsequently, the cells were exposed to isoproterenol (final concentration of 100 nM) for 3 h to stimulate lipolysis. The glycerol levels released into the medium were used as a measure of lipolysis evaluated using a commercial lipolysis colorimetric assay kit (MAK211) according to the manufacturer’s instructions. Cell viability of the lipolysis-induced adipocytes was determined with CV staining.
2.15. Statistical Analysis
The experimental data are presented either as the mean ± SEM or mean ± SD of at least three independent experiments. Statistical significance was analyzed using one-way analysis of variance (ANOVA), followed by Dunnett’s post hoc test using GraphPad Prism Version 7. A p value < 0.05 was considered to indicate statistical significance.
3. Results
3.1. Compound-Protein Docking
Virtual screening was performed to predict the binding affinities of the test triterpenoids (ARM-2 and RA-5) for several lipogenic and adipogenic proteins, namely, SREBP-1c, PPARγ, C/EBPα, AMPK, and HSL. The docking scores are presented in Table 2. Both triterpenoids exhibited improved binding with PPARγ and good binding to AMPK and SREBP-1c. Notably, although the triterpenoid Glide scores for C/EBPα, PNLIP, and HSL were less negative with respect to our set cut-off value of −8.00 kcal/mol, they were highly comparable to those of simvastatin and orlistat for the respective proteins (Table 2).
| Ligand | PL | HSL | AMPK | SREBP-1 | PPARγ | C/EBPα |
|---|---|---|---|---|---|---|
| ARM-2 | −4.228 | −3.160 | −5.479 | −7.150 | −8.999 | −4.270 |
| RA-5 | −2.927 | −4.261 | −6.041 | −7.621 | −8.952 | −3.864 |
| Orlistat | −4.187 | −4.286 | −3.810 | −9.632 | −12.121 | −3.032 |
| Simvastatin | −4.663 | −4.203 | −6.613 | −8.624 | −10.433 | −5.174 |
3.2. PPI
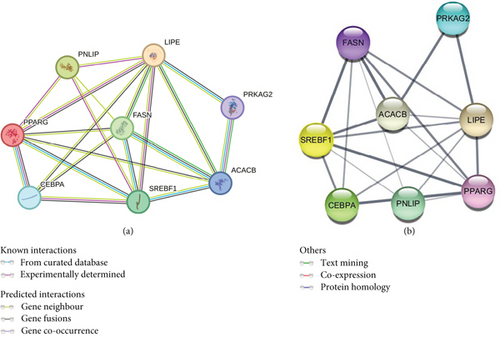
A PPI network of key lipogenic and lipolytic proteins (PPARγ, C/EBPα, SREBP-1c, PNLIP, HSL, ACC, FASN, and AMPK) was constructed using the STRING database (Figure 2(a)). The nodes are interconnected by edges, with each edge representing protein–protein associations and encompassing known, predicted, and other interactions. The average node degree of freedom is 3, and the average local clustering coefficient is 0.75. Interestingly, the predictions revealed that the compounds regulate several proteins that interact with triterpenoids. Further analysis of the PPI network obtained from STRING was performed with Cytoscape software, and the degree of core expression is represented as the thickness of the edges (Figure 2(b)). The results revealed that the genes are interconnected, suggesting that the regulation of one gene may lead to the regulation of another gene. The SREBF-1 gene is coregulatory with C/EBPα and ACACB, and as such, its regulation and/or control could influence the expression of other genes, thereby affecting the regulation of adipogenesis and lipogenesis.
3.3. Inhibition of PNLIP
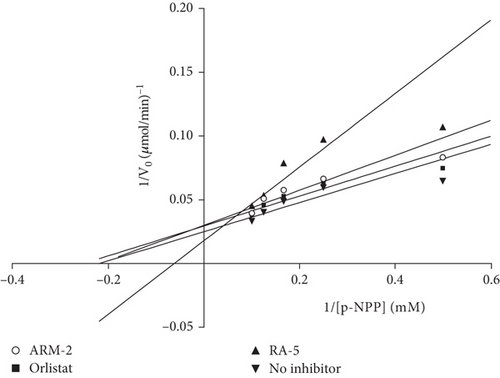
An in vitro assay was also used to confirm the inhibitory effect of the triterpenoids on PNLIP. The results (Table 3) revealed that both triterpenoids exhibited inhibitory effects against PNLIP, with Ki values of 52.86 and 28.67 μM for RA-5 and ARM-2, respectively. The enzyme inhibitory activity of the compounds was further indicated by their low IC50 values of 27.57 and 35.83 μM for RA-5 and ARM-2, respectively. However, these IC50 values were not comparable to those of orlistat. A Lineweaver–Burk plot (Figure 3) showed that while ARM-2 inhibits PNLIP via a noncompetitive mechanism (with the same Km value), a mixed type of inhibition (with different Km and Vmax values) was observed for RA-5. A statistical difference between the triterpenes and orlistat was observed, further indicating the difference in the modes of action.
| Inhibitor | Pancreatic lipase | ||||
|---|---|---|---|---|---|
| IC50 (μM) | Ki (μM) | Km (μM) | Vmax (μM) | Mode of inhibition | |
| ARM-2 | 35.83 ± 12.44∗ | 52.86 ± 7.19 | 1.18 ± 0.35 | 3.50 ± 1.10 | Noncompetitive |
| RA-5 | 27.57 ± 8.51∗ | 28.67 ± 8.84 | 1.91 ± 1.45 | 4.64 ± 2.98 | Mixed |
| Orlistat | 3.12 × 10⁻² ± 2.35 × 10⁻³ | 19.18 ± 1.28 | 5.2 ± 0.19 | 1.66 ± 0.86 | Uncompetitive |
| No inhibitor | 2.14 ± 1.00 | 1.43 ± 0.051 | |||
- Note: Data are expressed as the mean ± SEM (n = 3).
- ∗p < 0.0001 versus orlistat.
3.4. Cell Viability Assessment
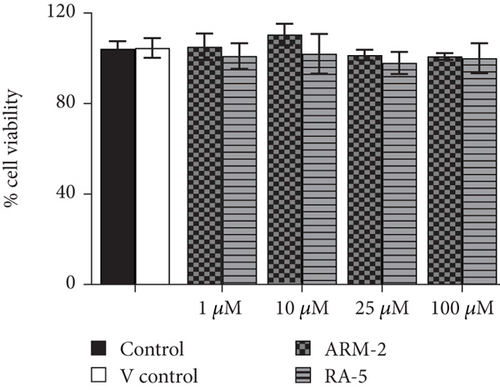
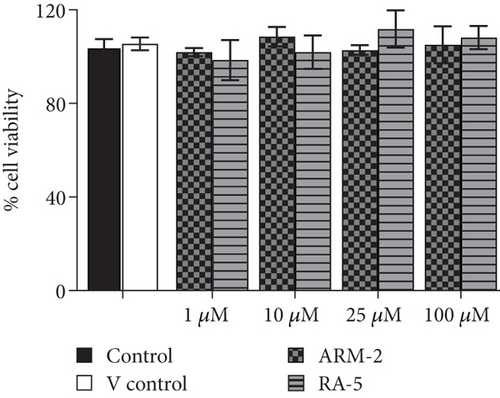
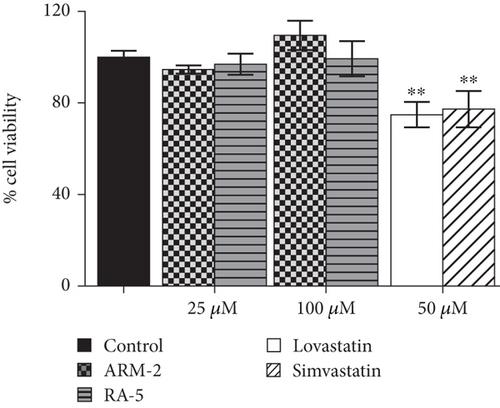
The potential cytotoxicity of the triterpenoids was investigated in both 3T3-L1 and HepG2 cells before investigating their effects on intracellular lipid accumulation. Both triterpenoids, at all the tested concentrations (1–100 μM), had no cytotoxic effects on either 3T3-L1 or HepG2 cells (Figure 4).
3.5. Effect of Triterpenoids on Lipid Accumulation in Adipocytes
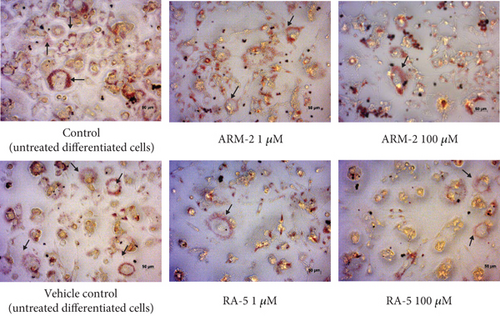
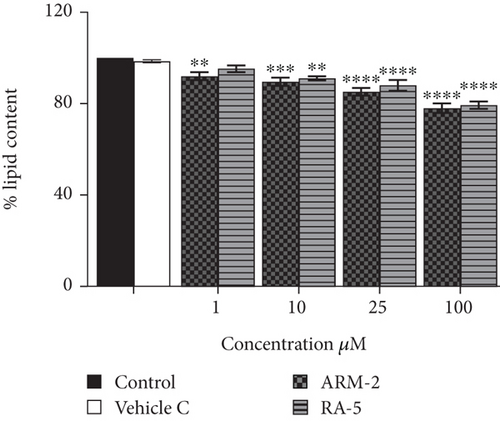
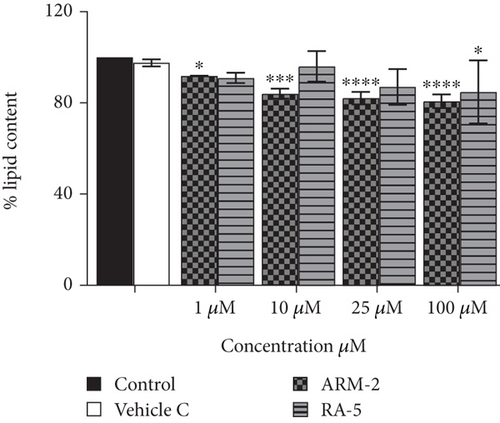
The effect of the triterpenoids on intracellular lipid accumulation was determined in fully differentiated adipocytes. While large intracellular lipid droplets were observed in the control cells (untreated adipocytes), treatment with both triterpenoids at 100 μM reduced intracellular lipid accumulation (Figure 5(a)). A significant dosage-dependent decrease in lipid accumulation was observed for ARM-2 and RA-5. At 100 μM, this was 22.21% and 20.67%, respectively (Figure 5(b)). A similar dosage-dependent decrease was observed for ARM-2 and RA-5 with a 19.27% and 10.37% reduction in neutral lipid accumulation at 100 μM for ARM-2 and RA-5, respectively (Figure 5(c)).
3.6. Hepatic Lipid Accumulation
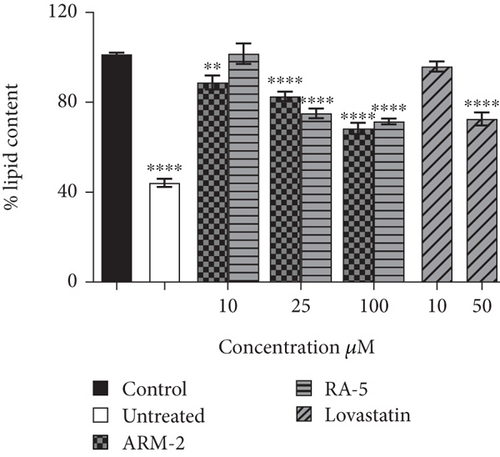
The potential effect of ARM-2 and RA-5 on intracellular lipid accumulation was also determined in the HepG2 cell model of OA-induced hepatic lipid accumulation. Exposure to OA caused an increase in lipid accumulation in HepG2 cells (Figure 6(a)). Treatment with 100 μM ARM-2 or RA-5 reduced the lipid accumulation, as indicated by fewer lipid droplets following ORO staining (Figure 6(a)). Quantification revealed a statistically significant dosage-dependent reduction, with a reduction of 31.56% and 23.47% after treatment with 100 μM ARM-2 and RA-5, respectively. A dose–response reduction in the hepatic lipid accumulation was also observed, which was significant for ARM-2 (10–100 μM) and RA-5 (25 and 100 μM) (Figure 6(b)). Neutral lipid accumulation was only significant for ARM-2 (25 and 100 μM) and RA-5 (100 μM) with a 40% and 39% reduction in neutral lipid accumulation for 100 μM ARM-2 and RA-5, respectively (Figure 6(c)). Likewise, as in differentiated 3T3-L1 cells, the effect on OA-induced lipid accumulation in HepG2 cells was greater for ARM-2 than for RA-5. The effect of 50 μM of the control, lovastatin, was similar to the effect of 25 and 100 μM ARM-2 and RA-5.


3.7. Expression of Several Lipolytic and Lipogenic Genes
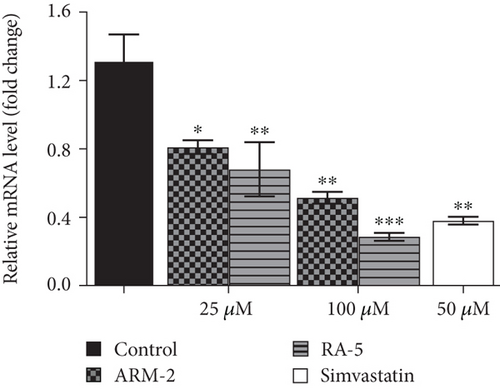
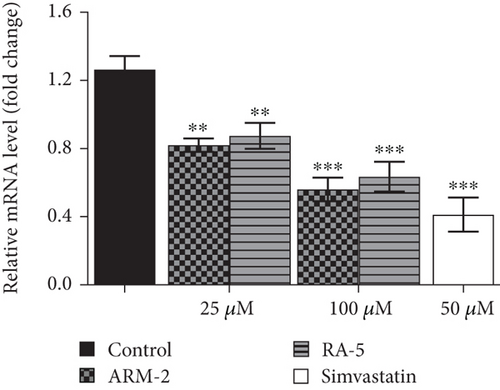
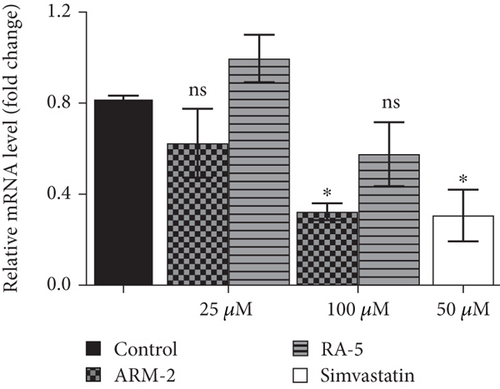
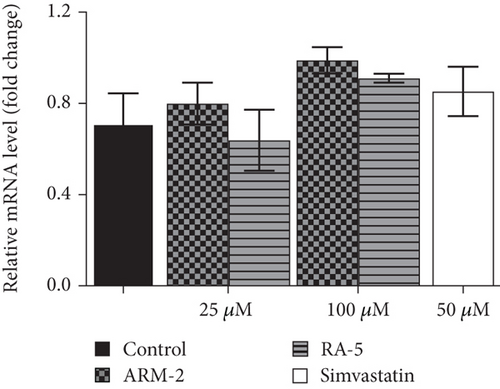
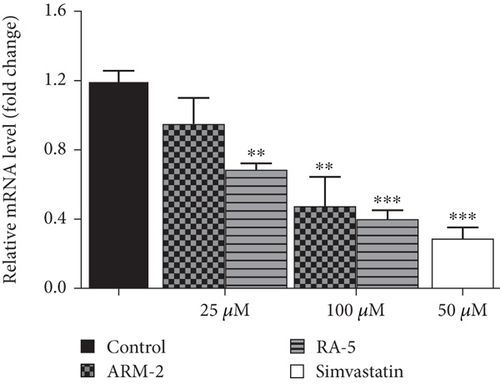
RT-qPCR was used to quantitatively determine the effect of the triterpenoids on some selected lipolytic, lipogenic, and adipogenic genes in differentiated 3T3-L1 adipocytes. Increased expression of mRNA levels on PPARγ, C/EBPα, SREBP-1, and HSL, along with reduced expression of AMPK mRNA levels, was observed in the control, untreated differentiated cells (Figure 7). Interestingly, treatment of the cells with ARM-2 and RA-5, at 100 μM, significantly reduced the expression of PPARγ (59.30% and 77.40%), C/EBPα (55.65% and 49.72%), SREBP-1 (59.30% and 77.40%), and HSL (60.38% and 66.54%) genes (Figures 7(a), 7(b), 7(c), and 7(e)) which translates into a significant fold decrease in the relative mRNA levels. An increase in the expression of the AMPK gene of 39.10% and 28.05% was also observed following the treatment with ARM-2 and RA-5, respectively (Figure 7(d)), although not significant when compared with the control. It is noteworthy that ARM-2 demonstrated high efficacy in comparison to simvastatin in regulating AMPK. No significant differences were observed between 100 μM ARM-2 and RA-5 and 50 μM simvastatin, the drug control. This indicates that for all genes evaluated, ARM-2 and RA-5 downregulate lipolytic and lipogenic genes similar to simvastatin.
3.8. The Effect of Triterpenoids on Lipolysis in 3T3-L1 Cells
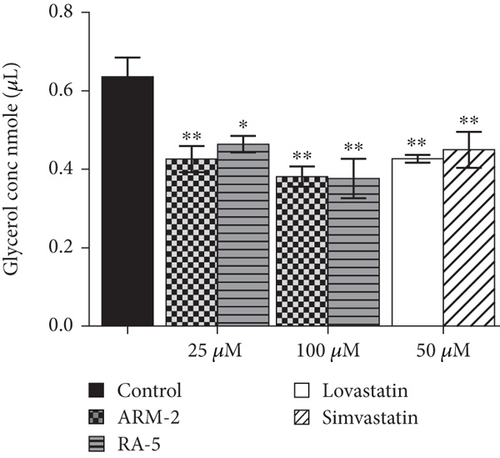
A glycerol release assay was also used to investigate the effect of triterpenoids (ARM-2 and RA-5) on lipolysis in 3T3-L1 cells (Figure 8). While a higher glycerol content was detected in the control untreated cells, a decrease in glycerol levels was observed in the triterpenoid-treated cells. At 100 μM, ARM-2 and RA-5 decreased glycerol release by 36.47% and 34.72%, respectively (Figure 8(a)). While the triterpenoids did not have cytotoxic effects on lipolysis-stimulated differentiated adipocytes, both simvastatin and lovastatin at 50 μM had cytotoxic effects; thus, the observed reduction in glycerol release could also be related to cell death (Figure 8(b)).
4. Discussion
The clinical limitations linked to the currently used hypolipidemic drugs continue to fuel the search and discovery of new alternative drugs. Medicinal plants are considered valuable sources of potential lead molecules as new blood lipid–lowering drugs with multiple targets, improved efficacy, and fewer side effects. In this endeavour, our research group has recently reported the hypocholesterolemic effect of the two triterpenoids (ARM-2 and RA-5) from P. longifolia [17]. The identified bioactivities were linked to the regulation of dietary cholesterol absorption and biosynthesis and stimulation of cellular LDL uptake. This study was aimed at exploring further the hypolipidemic potential of ARM-2 and RA-5 using in silico and in vitro cell models.
Dietary TGs contribute significantly to the elevation of circulating TG levels in the bloodstream and are primarily due to the uncontrolled digestion and absorption of TG in the intestinal lumen following consumption of TG-rich diets. Hence, a primary strategy to reduce blood TG levels is to delay dietary TG digestion and absorption by inhibiting PNLIP [23]. The inhibitory activity of the triterpenoids, RA-5 and ARM-2, with varying levels of efficacy compared with orlistat on PNLIP identifies some potential to inhibit dietary TG digestion, thereby delaying TG absorption. In silico predictions indicated that both ARM-2 and RA-5 exhibit a similar competitive mode of inhibition to orlistat; however, in vitro enzyme inhibition studies identify different modes of inhibition. The noncompetitive and mixed types of inhibition displayed by ARM-2 and RA-5, respectively, indicate that inhibition is mediated by an interaction with the allosteric site of PNLIP.
Elevated blood levels and the subsequent accumulation of TG in matured adipocytes are closely associated with obesity, which is strongly linked to the global health threat of metabolic syndrome [24]. In vitro studies showed that ARM-2 and RA-5 treatment reduced the lipid droplet accumulation (Figures 5(a) and 6(a)), total lipids (Figures 5(b) and 6(b)) and neutral lipid accumulation (Figures 5(c) and 6(c)) in differentiated 3T3-L1 adipocytes (Figure 5) and the OA-induced HepG2 cell model (Figure 6). In the latter model, cellular lipid–lowering effects were similar to lovastatin. To address obesity and its related complications, AMPK emerges as a valuable therapeutic target due to its role in maintaining energy homeostasis [25]. In this process, AMPK suppresses the expression of SREBP-1, the transcriptional factor that controls the expression of lipogenic genes such as fatty synthase (FAS), ACC, PPARγ, and C/EBPα. The suppression of these genes inhibits lipogenesis [25–27].
In this study, AMPK expression was unaltered while the expression of SREBP-1, PPARγ, and C/EBPα genes after treatment of differentiated 3T3-L1 adipocytes with ARM-2 and RA-5 was reduced (Figure 7). The pattern of unaltered AMPK expression and reduced expression of the SREBP-1, PPARγ, and C/EBPα genes is similar to the effect of simvastatin evaluated within the same concentration range. This indicates that the antilipogenic effect of the triterpenoids similar to simvastatin is linked to the activation of the AMPK/SREBP-1 pathway. Interestingly, the in silico results predicted that both triterpenoids have a favourable binding on SREBP-1 and AMPK indicating a possible direct interaction with their binding sites. Moreover, the predicted PPI network (Figure 2) confirms that the expression of SREBP-1 can directly influence the expression levels of FAS, ACC, and C/EBPα, thus modulating lipogenesis.
Beyond the role of triterpenoids regulating lipogenesis, the triterpenoids have also exhibited the ability to attenuate adipogenesis. The predicted interactions and ability to reduce the expression of key genes such as PPARγ and C/EBPα potentially lead to reduced adipocyte hyperplasia and hypertrophy. Although there is limited evidence regarding the antilipogenic effect of statins, previous studies have identified that simvastatin has antiadipogenic effects by suppressing PPARγ expression [28, 29] and potential antilipogenic effects by modulating the AMPK pathway [27].
In response to high energy demands, TGs stored in adipose tissue undergo lipolysis, a catabolic pathway that promotes the mobilization of metabolic fuel from adipose to peripheral tissues [30]. Dysregulated lipolysis, often associated with increased HSL activity, can lead to an increased flux of nonesterified fatty acids (FFAs) and glycerol into the blood circulation. The reduction in glycerol content released during the isoproterenol-stimulated lipolysis in the differentiated 3T3-L1 adipocytes treated with the triterpenoids (Figure 8(a)) revealed the antilipolytic effect of the compounds similar to lovastatin and simvastatin. Isoproterenol, a synthetic catecholamine, triggers lipolysis by activating the cyclic AMP (cAMP)–dependent pathway, which in turn leads to HSL phosphorylation [31]. Despite both triterpenoids demonstrating less favourable binding affinity on the catalytic site of HSL in silico, the observed decrease in mRNA levels of the HSL gene in differentiated adipocytes treated with the compounds further supports the potential regulation of lipolysis. The observed antilipolytic properties of ARM-2 and RA-5 are consistent with literature reports on other plant-derived triterpenoids that suppress HSL expression [32, 33]. While experimental evidence suggests that simvastatin administration promotes lipolysis via HSL phosphorylation [34, 35], our findings indicate that simvastatin potentially controls lipolysis by decreasing HSL expression. Atorvastatin, a costatin, has previously been reported to control lipolysis by decreasing the expression of HSL [36].
Furthermore, the flux of FFA, mainly from adipocytes, into the blood stimulates hepatic fatty acid uptake and subsequent de novo lipogenesis. The development of HTG is largely related to excessive hepatic synthesis and secretion of VLDLs and impaired plasma TRL clearance [37]. Interestingly, the observed decrease in intracellular lipid accumulation in the HepG2 cells following their treatment with the triterpenoids (Figure 6) indicated the potential of ARM-2 and RA-5 to regulate plasma TG levels by controlling hepatic TG production and release. Treatment with plant-derived triterpene, astragaloside, and ginsenoside CK reduced hepatic lipid accumulation in the OA-induced hepatic lipid accumulation model using the HepG2 cells [38, 39].
5. Conclusion
The regulation of both lipogenesis and lipolysis is crucial in maintaining energy homeostasis and actively managing circulating TG and FFA levels. The results obtained from the present study revealed the antilipogenic and antilipolytic effects of ARM-2 and RA-5. The antilipogenic activity of both triterpenoids is related to the inhibition of fatty acid synthesis, which results in a decrease in hepatic and adipocyte lipid accumulation, with similar effects on SREBP-1c, PPARγ, C/EBPα, and AMPK gene expression and possibly mediated via the AMPK/SREBP-1c pathway. The inhibition of adipocyte lipolysis was also similar to known statins, lovastatin and is simvastatin, and potentially due to the downregulation of HSL. The obtained results suggest that the triterpenoids, ARM-2 and RA-5, have the potential to modulate lipogenesis and lipolysis. Furthermore, Western blot analysis to confirm gene expression findings at the protein level, along with the quantification of FFA release, the phosphorylation status of HSL, is recommended fo future studies. Investigation of the effects of the triterpenoids on ATGL and FASN, and intracellular cAMP levels, is also recommended for future studies, as these were limitations of the current study. Additionally, more in-depth mechanistic studies, both in vitro and in vivo, are suggested for future investigations to provide a comprehensive understanding of the antihypertriglyceridemic potential and underlying mechanisms of action of ARM-2 and RA-5.
Conflicts of Interest
The authors declare no conflicts of interest.
Funding
The authors are grateful to the University of Pretoria. The work was financially supported by the South African National Research Foundation (Grant Numbers [UID] 121928 and 123589). Open Access funding was enabled and organized by SANLiC Gold.
Acknowledgments
The authors are grateful to the University of Pretoria. The work was financially supported by the South African National Research Foundation (Grant Numbers [UID] 121928 and 123589).
Open Research
Data Availability Statement
The data used to support the findings of this study are included within the article.


