Optimizing the Dry Sliding Wear Behavior of Stir-Casted Al6061/Nano-Al2O3/Quartz Hybrid Metal Matrix Composite Using Taguchi Method
Abstract
The increased demand for wear-resistant and low-weight components in the automobile industry has led to the utilization of aluminum metal matrix composite parts due to their improved performance. The current work focused on optimizing the tribological factors such as applied load, rotational speed, and percentage weight fraction of the reinforcing particles for minimum dry sliding wear rate of Al6061/nano-Al2O3/quartz hybrid composite fabricated by stir casting. The optimization is performed by using the Taguchi L27 orthogonal array experimental plan, and the result is analyzed by the help of analysis of variance (ANOVA). The result of the optimization reveals that the optimum levels of factors for the minimum wear rate are 10 N, 200 rpm, and 12.5%. Furthermore, the ANOVA result depicts that the applied load has the highest impact (87.83%) on the wear rate, followed by rotational speed (10.06%) and percentage weight fraction of the reinforcement (1.60%). The developed linear regression model reveals that the applied load and the rotational speed have a positive relation with the sliding wear rate. However, the percentage weight fraction of the reinforcement has a negative relation. The confirmation test proves that the predicted value of wear rate using the regression equation at optimum levels has a closer agreement with the experimental result having a 6.934% error. Furthermore, the physical property test reveals that the rise in the weight percentage of quartz particles results in a corresponding increase in the percentage porosity of the hybrid composite.
1. Introduction
A composite material is described as a structural material produced synthetically or artificially by fuzing two or more insoluble components with different properties. Compared to any of their basic materials, composite materials have better characteristics [1]. It is one of the most advanced classes of engineering materials in which the reinforcing phase is embedded in the matrix phase. The individual phases retain their properties in the final fabricated structure. The properties of the composite materials depend on the particle size and, consequently, the degree of dispersion of the individual composite particles [2]. The reinforcement material possesses much better properties compared to the matrix material. However, the matrix is used to bind the reinforcements together and conserve the integrity of the combined material, and it creates the primary structure of the composite material [2].
The property requirement of the composite, wettability of the reinforcement in the matrix phase, and thermodynamical compatibility of the reinforcement with the matrix are some of the basic criteria for the selection of reinforcement in a specific metal matrix composite (MMC) [3, 4]. A good balance of strength, toughness, density, and tribological parameters like wear rate and coefficient of friction cannot be achieved by utilizing conventional monolithic materials [5–8].
A MMC is a composite made up of at least two basic components, one of which is a metal. The second component could be another metal, a ceramic, fiber, or an organic material [9]. They function well in applications where a combination of strength, thermal conductivity, damping properties, and a low coefficient of thermal expansion with low density were required [10, 11]. Metallic materials such as Al, Ti, Fe, Cu, and Ni are used as a matrix in MMCs [12], and ceramic materials (Al2O3, SiC, BN, SiO2, B4C, TiB2, ZrO2, Quartz, clay, and fly ash) are used as a reinforcing phase [13, 14]. In the case of MMC, the reinforcing phase can be a single phase or a multiple phase [15–17]. Aluminum and its alloys are by far the most common MMC materials, both in research and development and in industry applications [18]. Composites made of aluminum alloys belong to the category of lightweight, high-performance engineered materials that can offer a variety of benefits when used as a structural material [19–21].
Composition, relative wettability, and distribution of the reinforcing ceramic particles in the matrix phase and production cost are some of the important factors that are considered while selecting specific manufacturing techniques to develop aluminum metal matrix composite (AMMC) [22]. Particulate-reinforced AMMCs can be successfully fabricated by both liquid phase (stir casting, infiltration process, squeeze casting) and solid phase (powder metallurgy, friction stir process, spark plasma) fabrication routes [23–27]. Even if these two fabrication methods produce an AMMC, to get a sound product with a minimum amount of defects, the appropriate selection of the following processing parameters was very crucial: selection of appropriate manufacturing technique, appropriate selection of processing parameters (type, percentage content and particle size of the reinforcement, melting temperature, sintering temperature and time, press pressure, stirring speed, stirring time), and appropriate selection of secondary manufacturing process such as machining and joining [28–30].
In terms of fabrication cost and process simplicity, stir casting has an advantage over other fabrication methods of AMMCs [28, 31]. Even if this method has some drawbacks, it can be reduced by using several techniques such as the double stir casting method [32], adding wetting enhancing elements such as magnesium, applying secondary operations such as forging, extrusion, and heat treatment process [33], and selecting optimum processing parameters. Preheating of the reinforcing particle and the metallic mold at the appropriate level of temperature is the other method of reducing oxidation and enhancing the microstructural integrity of the composite [34]. Some related published articles on the areas of optimization of the sliding wear rate of aluminum matrix composites, including their optimization technique and optimized parameters for the minimum sliding wear rate, are reviewed in Table 1.
| Ref. | Material (matrix and reinforcement) | Fabrication technique | Optimization technique | Optimized parameters | Objective |
|---|---|---|---|---|---|
| [35] |
|
Stir casting | Taguchi L8 |
|
Minimum dry sliding wear |
| [36] |
|
Stir casting | Design of experiment (DOE)L27 |
|
Minimum dry sliding wear |
| [37] |
|
Stir casting and compo casting | Taguchi L27 |
|
Minimum dry sliding wear and coefficient of friction |
| [38] |
|
Stir casting | Taguchi L27 |
|
Minimum dry sliding wear and coefficient of friction |
| [39] |
|
Stir casting | Taguchi L9 |
|
Minimum dry sliding wear |
| [40] |
|
Squeeze casting | Taguchi L9 |
|
Minimum dry sliding wear |
| [41] |
|
Two-step stir casting | Taguchi L27 |
|
Minimum sliding wear rate at dry and wet conditions |
|
|||||
| [42] |
|
Stir casting | Taguchi L27 |
|
Minimum dry sliding wear |
| [43] |
|
Stir casting | Design of experiment (DOE)L9 |
|
Minimum dry sliding wear |
| [44] |
|
Two-step stir casting | Taguchi L27 and Grey relation analysis (GRA) |
|
Minimum dry sliding wear and coefficient of friction |
| [45] |
|
Powder metallurgy | Grey relation analysis (GRA) |
|
Minimum dry sliding wear and coefficient of friction |
| [46] |
|
Stir casting | Gray relation analysis (GRA) |
|
Minimum dry sliding wear |
In different manufacturing industries such as aerospace, automotive, marine, defense, and electronics, the demand for AMMC is rapidly increased due to its improved mechanical properties [47–49]. In the automotive industry, AMMCs are highly utilized to manufacture different parts of lightweight cars, such as braking system components, engine components, automotive body components, transmission system components, and structural parts [50–52]. Lightweight, improved wear resistance, improved thermal properties, and low cost of aluminum matrix composite for automotive components are the primary reasons for its widespread use in comparison to other materials [6, 53]. The most promising use for AMMC in the near future is the replacement of traditional automotive materials like steel and cast iron in brake systems and unsprung weight components like car engines [47, 51].
In general, the objective of the present paper is to fabricate a new class of hybrid AMMC and to optimize the dry sliding wear behavior of Al6061/nano-Al2O3/quartz hybrid composites using the Taguchi technique. The paper addresses the development of a new hybrid MMCs using the stir casting technique and a practical experiment of dry sliding wear test on a pin-on-disc wear testing machine in order to assess the performance of the developed composite. Furthermore, this research studied the effect of naturally occurring micro quartz particles in combination with nano-Al2O3 and other tribological parameters on the dry sliding wear rate of the hybrid composite, which had not been studied before. Finally, the optimization is performed by using the Taguchi technique, and the result is analyzed by the help of analysis of variance (ANOVA), and the optimization is validated by performing a confirmation test at the optimum level of the factors, and the confirmation test report is presented in the conclusion part.
2. Materials and Methods
2.1. Materials
Due to the presence of a high amount of Si and Mg elements in Al6061, as shown in Table 2, it has a better wear resistance property compared to other types of aluminum alloys [55], and it is used as a matrix material in this study. The modern automotive industries have developed different lightweight automotive components such as brake and clutch discs from Al6061 [56, 57]. In addition, Al2O3 is the first corrosion-resistant due to the presence of an oxide layer and the second wear-resistive ceramic material next to silicon carbide [58, 59]. In addition to Al2O3, microquartz particles were used as the second reinforcing ceramic particles to form a hybrid composite. As it is stated in different articles, quartz is the second toughest material, and as a result, it has better wear resistance properties [60–65]. About 50 nm and 45 μm particle sizes of Al2O3 and quartz were used for the development of the composite. The mixture design of the matrix and reinforcement during the preparation of the composite are depicted in Table 3.
| Elements of Al6061 | Si | Fe | Cu | Mn | Mg | Cr | Zn | Ti | Al | Other |
|---|---|---|---|---|---|---|---|---|---|---|
| Percentage | 0.4–0.8 | 0.7 | 0.15–0.4 | 0.15 | 0.8–1.2 | 0.04–0.35 | 0.25 | 0.15 | 94.0 | 0.15 |
| Designation | Casting run | Description |
|---|---|---|
| S1 | 1 | Matrix Al6061 + 3.5 wt.% of Al2O3 + 3 wt.% of quartz |
| S2 | 2 | Matrix Al6061 + 3.5 wt.% of Al2O3 + 6 wt.% of quartz |
| S3 | 3 | Matrix Al6061 + 3.5 wt.% of Al2O3 + 9 wt.% of quartz |
2.2. Methods
2.2.1. Preparation of the Composite Samples
The hybrid composite was developed using the stir casting technique of manufacturing. The four-blade mixer was created using a stainless-steel bar that is chrome-plated and operated by a Nama 21 stepper motor. The speed and duration of the stirring were regulated by an Arduino Mega microcontroller with the help of Mach 3 CNC Controller software. The composition of the developed hybrid composite is depicted in Table 2.
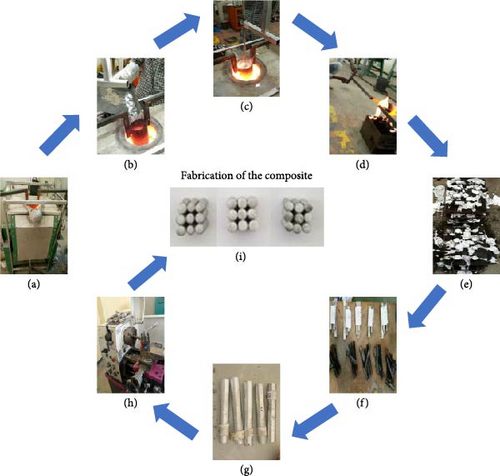
Figure 1 shows the fabrication sequence of the developed hybrid aluminum matrix composite. Initially, the nano Al2O3 particles were heated beforehand and then fuzed at a temperature of 500°C. These particles were then introduced into the liquid metal at a consistent rate of 5% for each casting. Following this, the mixture of aluminum and aluminum oxide was supplemented with quartz powder, which had a particle size of 45 μm, at a continuous rate of 3%, 6%, and 9% based on the weight of the Al alloy matrix. The mixture of liquid aluminum alloy and reinforcements was constantly mixed for a duration of 5 min at a speed of 400 revolutions per minute using a specifically designed mixer to evenly disperse the reinforcements throughout the alloy. Afterward, the liquid metal is swiftly poured into three metallic permanent molds having 110 mm in height and 10 mm in diameter, resulting in a highly efficient process with a large output. Once the solidification process is complete, the mold is secured with splints, and the specimen is removed. The process was carried out three additional times in the same manner in order to achieve varying levels of reinforcement. Finally, the cast samples were machined into a standard specimen using a lath machine as per ASTM G99, which has a height of 12 mm and a diameter of 6 mm.
2.2.2. Design of Experiment for Testing
(2) Dry Sliding Wear Test. A major step involved in the DOE process is the determination of the combination of factors and levels, which will give the desired information about the total experimental run to be performed [66]. The DOE, under Taguchi’s technique, is proposed for designing the experiments for the sliding wear test in order to reduce the total experimental time by performing a minimum number of experiments. The flow of the optimization technique for the current study is shown in Figure 2. Taguchi used orthogonal arrays to design the experiments for the combination of different number of factors and different number of levels.
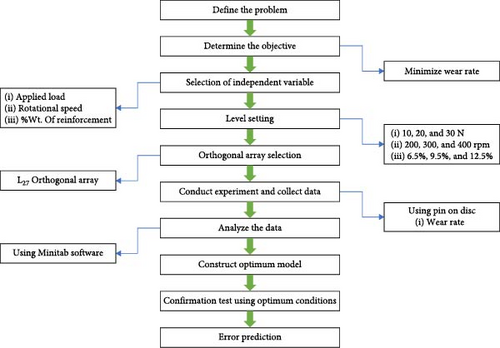
A well-balanced design with a minimum number of experiments is provided by an orthogonal array for a particular combination. Dry sliding wear test will be performed with three parameters: applied load, rotational speed, and wt.% fraction of the reinforcement by varying them for three levels, which is shown in Table 4.
| No. | Applied load (N) | Rotational velocity (rpm) | Reinforcement (wt.%) |
|---|---|---|---|
| 1 | 10 | 200 | 6.5 |
| 2 | 20 | 300 | 9.5 |
| 3 | 30 | 400 | 12.5 |
The aim of the experimental plan is to find the important factors and the combination of factors influencing the wear process to obtain the minimum sliding wear rate and coefficient of friction. The experiments were developed based on an orthogonal array, with the aim of relating the influence of applied load, rotational speed, and percentage weight fraction of the reinforcement.
L27 orthogonal array, as shown in Table 5, is selected for the current experimentation due to the fact that L27 allows factor interaction in addition to the main effect, and it increases the accuracy of the analysis compared to L9 as it only tells the main effect. The tribological responses for the current investigation are sliding wear rate and coefficient of friction. The intention is to minimize the dry sliding wear rate signal-to-noise (S/N) ratio value calculated by considering the condition of the “smaller is the better” approach using Equation (2).
| Exp. no. | Applied load (N) |
Rotational speed (rpm) |
Weight percentage fraction of reinforcement (%) |
|---|---|---|---|
| 1 | 10 | 200 | 3.5% Al2O3 + 3% quartz = 6.5% |
| 2 | 10 | 200 | 3.5% Al2O3 + 6% quartz = 9.5% |
| 3 | 10 | 200 | 3.5% Al2O3 + 9% quartz = 12.5% |
| 4 | 10 | 300 | 3.5% Al2O3 + 3% quartz = 6.5% |
| 5 | 10 | 300 | 3.5% Al2O3 + 6% quartz = 9.5% |
| 6 | 10 | 300 | 3.5% Al2O3 + 9% quartz = 12.5% |
| 7 | 10 | 400 | 3.5% Al2O3 + 3% quartz = 6.5% |
| 8 | 10 | 400 | 3.5% Al2O3 + 6% quartz = 9.5% |
| 9 | 10 | 400 | 3.5% Al2O3 + 9% quartz = 12.5% |
| 10 | 20 | 200 | 3.5% Al2O3 + 3% quartz = 6.5% |
| 11 | 20 | 200 | 3.5% Al2O3 + 6% quartz = 9.5% |
| 12 | 20 | 200 | 3.5% Al2O3 + 9% quartz = 12.5% |
| 13 | 20 | 300 | 3.5% Al2O3 + 3% quartz = 6.5% |
| 14 | 20 | 300 | 3.5% Al2O3 + 6% quartz = 9.5% |
| 15 | 20 | 300 | 3.5% Al2O3 + 9% quartz = 12.5% |
| 16 | 20 | 400 | 3.5% Al2O3 + 3% quartz = 6.5% |
| 17 | 20 | 400 | 3.5% Al2O3 + 6% quartz = 9.5% |
| 18 | 20 | 400 | 3.5% Al2O3 + 9% quartz = 12.5% |
| 19 | 30 | 200 | 3.5% Al2O3 + 3% quartz = 6.5% |
| 20 | 30 | 200 | 3.5% Al2O3 + 6% quartz = 9.5% |
| 21 | 30 | 200 | 3.5% Al2O3 + 9% quartz = 12.5% |
| 22 | 30 | 300 | 3.5% Al2O3 + 3% quartz = 6.5% |
| 23 | 30 | 300 | 3.5% Al2O3 + 6% quartz = 9.5% |
| 24 | 30 | 300 | 3.5% Al2O3 + 9% quartz = 12.5% |
| 25 | 30 | 400 | 3.5% Al2O3 + 3% quartz = 6.5% |
| 26 | 30 | 400 | 3.5% Al2O3 + 6% quartz = 9.5% |
| 27 | 30 | 400 | 3.5% Al2O3 + 9% quartz = 12.5% |
3. Result and Discussion
The experimental results of the physical test, including density and porosity, were presented in this section. Furthermore, the results of the tribological test were analyzed with ANOVA, which is used to investigate the influence of the considered wear parameters, namely, applied load, sliding speed, and sliding distance that significantly affect the performance measures. By performing ANOVA, it can be decided which independent factor dominates over the other and the percentage contribution of that particular independent variable.
3.1. Physical Properties
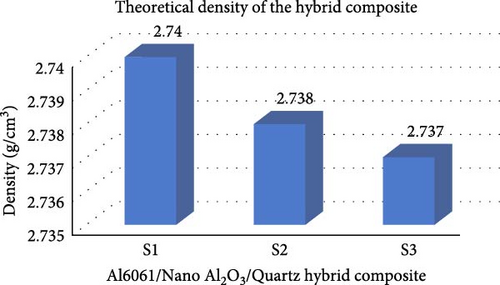
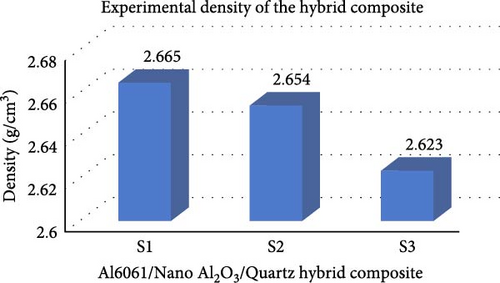
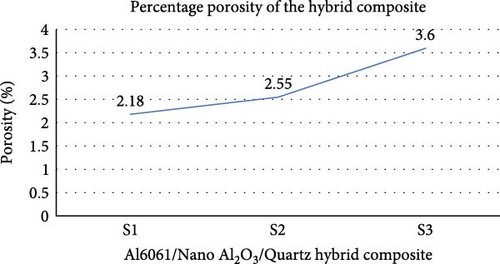
The physical characteristics of the developed hybrid MMC samples were analyzed and displayed in Figure 3. The decline in the theoretical density of samples S1–S3, as shown in Figure 3(a), can be attributed to the decrease in the weight percentage of Al6061 and the increase in the weight percentage of quartz particles, which is in line with the result of Vijayakumar et al.’s [67] study. Quartz particles have a lower density compared to Al6061 and Al2O3, which explains the gradual reduction in sample density. The result of the experimental density shown in Figure 3(b), depicts that as the weight percentage of the reinforcing particles increases, the density of the composite decreases as a result of porosity, which is proved by Figure 3(c), the highest amount of percentage porosity was observed in sample S3, which was 3.6% due to the increment of air bubbles in the contact surface area between the matrix alloy and the reinforcement particulates. However, the obtained porosity levels were within the accepted limit since it was below 4% [67, 68].
3.2. Dry Sliding Wear Behavior of the Hybrid Composite
The current study investigates the dry wear rate and coefficient of friction of Al6061/nano-Al2O3/quartz hybrid MMC under different tribological factors and levels. The tribological parameter’s that are varied during the experimental investigation are the applied load (10, 20, and 30 N), rotational speed (200, 300, and 400 rpm), and percentage weight fraction of the reinforcement particles in the composite (6.5%, 9.5%, and 12.5%) keeping the other parameters’ constant. The results of the dry sliding wear rate test conducted as per the L27 orthogonal array experimental plan are depicted in Table 6 with their corresponding S/N ratio of each test.
| Exp. no. | Applied load in (N) | Rota. speed (rpm) |
Weight percentage of reinforce. (%) | Wear rate in (mm3/m) | S/N ratio in (db) | COF | S/N ratio in (db) |
|---|---|---|---|---|---|---|---|
| 1 | 10 | 200 | 6.5 | 0.001185 | 58.526 | 0.3325 | 9.564 |
| 2 | 10 | 200 | 9.5 | 0.001107 | 59.117 | 0.3280 | 9.682 |
| 3 | 10 | 200 | 12.5 | 0.001096 | 59.203 | 0.3250 | 9.762 |
| 4 | 10 | 300 | 6.5 | 0.001382 | 57.189 | 0.3356 | 9.483 |
| 5 | 10 | 300 | 9.5 | 0.001304 | 57.694 | 0.3341 | 9.522 |
| 6 | 10 | 300 | 12.5 | 0.001210 | 58.347 | 0.3301 | 9.627 |
| 7 | 10 | 400 | 6.5 | 0.001491 | 56.530 | 0.3385 | 9.408 |
| 8 | 10 | 400 | 9.5 | 0.001400 | 57.077 | 0.3350 | 9.499 |
| 9 | 10 | 400 | 12.5 | 0.001390 | 57.139 | 0.3327 | 9.558 |
| 10 | 20 | 200 | 6.5 | 0.001652 | 55.639 | 0.3425 | 9.306 |
| 11 | 20 | 200 | 9.5 | 0.001590 | 55.972 | 0.3405 | 9.357 |
| 12 | 20 | 200 | 12.5 | 0.001492 | 56.524 | 0.3389 | 9.398 |
| 13 | 20 | 300 | 6.5 | 0.001899 | 54.429 | 0.3472 | 9.188 |
| 14 | 20 | 300 | 9.5 | 0.001705 | 55.365 | 0.3454 | 9.233 |
| 15 | 20 | 300 | 12.5 | 0.001671 | 55.540 | 0.3430 | 9.294 |
| 16 | 20 | 400 | 6.5 | 0.002284 | 52.826 | 0.3498 | 9.123 |
| 17 | 20 | 400 | 9.5 | 0.002107 | 53.526 | 0.3481 | 9.165 |
| 18 | 20 | 400 | 12.5 | 0.001963 | 54.141 | 0.3473 | 9.185 |
| 19 | 30 | 200 | 6.5 | 0.002508 | 52.013 | 0.3500 | 9.118 |
| 20 | 30 | 200 | 9.5 | 0.002371 | 52.501 | 0.3486 | 9.153 |
| 21 | 30 | 200 | 12.5 | 0.002291 | 52.799 | 0.3478 | 9.173 |
| 22 | 30 | 300 | 6.5 | 0.002807 | 51.035 | 0.3601 | 8.871 |
| 23 | 30 | 300 | 9.5 | 0.002700 | 51.372 | 0.3548 | 9.000 |
| 24 | 30 | 300 | 12.5 | 0.002610 | 51.664 | 0.3527 | 9.051 |
| 25 | 30 | 400 | 6.5 | 0.003110 | 50.144 | 0.3842 | 8.308 |
| 26 | 30 | 400 | 9.5 | 0.002995 | 50.472 | 0.3792 | 8.422 |
| 27 | 30 | 400 | 12.5 | 0.002894 | 50.778 | 0.3645 | 8.766 |
3.3. S/N Ratio of Each Spacemen
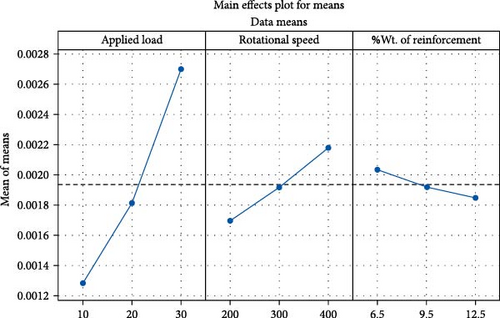
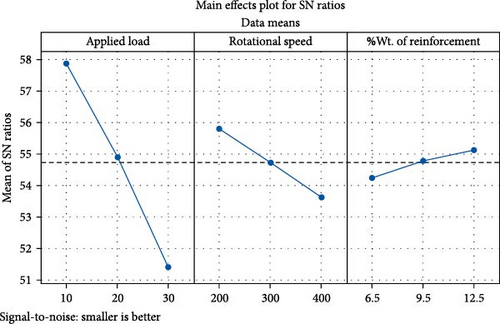
The S/N ratio of each test sample is obtained to study the impact of each tribological parameter, such as applied load, rotational speed, and percentage weight fraction of the reinforcement on the dry sliding wear rate of Al6061/nano Al2O3/quartz hybrid composite. In order to obtain the minimum wear rate, a “smaller-the-better “scenario is utilized for the study. The difference between the two extremes of each factor is ranked by the delta value, which is depicted in Table 7. The delta rank of the S/N ratio value shows that the applied load has the highest impact on the sliding wear rate of the hybrid composite, followed by the rotational speed and percentage weight fraction of the reinforcing particles. The results of the main effect plots for the S/N ratio and means shown in Figure 4 reveal that the optimum levels of the factors for minimum wear rate are 10 N, 200 rpm, and 12.5% for applied load, rotational speed, and percentage weight fraction, respectively. The result of the study is supported by Prasad et al. [69], stating that the addition of 5 wt.% nano-Al2O3 improves the wear resistance of the matrix by 55%, and the improvement is achieved due to the uniform distribution of the Al2O3 particles throughout the base aluminum matrix alloy. Furthermore, Ogunrinola et al. [62] reported that the addition of 9% quartz particles in LM25 aluminum alloy improves the wear resistance of the alloy by 132.2% due to the fact that the ceramic particles form a hard phase in the matrix.
| Source | DF | Seq SS | Adj SS | Adj MS | F | P | Pr |
|---|---|---|---|---|---|---|---|
| Applied load (N) | 2 | 187.536 | 187.536 | 93.7678 | 1803.79 | 0.002 | 87.83% |
| Rotational speed (rpm) | 2 | 21.494 | 21.494 | 10.7469 | 206.74 | 0.0019 | 10.06% |
| Weight percentage of reinforcement | 2 | 3.433 | 3.433 | 1.7163 | 33.02 | 0.646 | 1.60% |
| Error | 20 | 1.040 | 1.040 | 0.0520 | — | — | — |
| Total | 26 | 213.502 | — | — | — | — | — |
3.4. ANOVA for Wear Rate
In order to identify the percentage contribution of each tribological factor on the sliding wear rate, the ANOVA for the test is performed with the help of Minitab 14 statistical analysis software, and this analysis is performed at a level of 5% significance that is up to a confidence level of 95%. As observed in Table 7, the ANOVA table depicts that the applied load has an extremely higher impact, with a percentage contribution of 87.83% compared to the other factors. The rotational speed is the second influencing factor with a percentage contribution of 10.06%, followed by the weight percentage of the reinforcing particles having a 1.60% contribution on the sliding wear rate Al6061/nano-Al2O3/quartz hybrid composite. The percentage contribution of each factor was depicted in the last column of the ANOVA table. As it is reported by Kumar et al. [70], whenever the P value in the ANOVA table is below 0.5, it indicates that the specific factor has the highest effect on the response. As shown in Table 7, since the P value of the applied load and rotational speed is much lower than 0.5, they will have a higher effect on the sliding wear rate compared to that of the weight fraction of the reinforcement, which has a P value higher than 0.5. As observed from the wear test as well as the main effect plot, it was noticed that the amount of wear increased as the applied load increased for all combinations of materials (S1, S2, and S3). This was because the rough surfaces pushed harder into the softer surfaces (sample pins) as the load increased. Furthermore, at elevated loads, the smoother areas on the surface may experience plastic deformation and breakage, causing the transfer of material between the surfaces in contact due to the rise in temperature. Consequently, this leads to an increase in wear loss. The work of Pattanaik et al. [71] supports the current result of the investigation.
3.5. Multiple Linear Regression Model
3.6. Confirmation Test
The final step in any optimization problem is confirming the quality characteristics of the response by implementing the optimum levels of each process or design parameters or factors. This prediction of the optimum response is determined by the help of the developed linear regression model. Therefore, the optimum level of the sliding wear rate is obtained by substituting the optimum levels of each factor in the linear regression Equation (4). The predicted optimum wear rate with its optimum levels is depicted in Table 8.
| No. | Factors | Optimum level | |
|---|---|---|---|
| 1 | Applied load | 10 N | |
| 2 | Rotational speed | 200 rpm | |
| 3 | Weight percentage of reinforcement | 12.5% | |
| Predicted dry sliding wear rate at optimum levels | 0.001606 mm3/m | ||
In order to confirm the predicted value of sliding wear rate, which is calculated by substituting the optimum levels in the regression model, a confirmation pin-on-disc wear test is performed once again at the optimum level of factors, and the result with percentage error is depicted in Table 9.
| Response | Predicted dry sliding wear rate (mm3/m) |
Experimental dry sliding wear rate (mm3/m) |
Error (%) |
|---|---|---|---|
| Dry sliding wear rate | 0.001020 | 0.001096 | 6.934% |
The result of the confirmation test reveals that the predicted value of the sliding wear rate at the optimum levels of the factors has a closer agreement with the experimental result, having a 6.934% error. As it is reported by Samal et al. [2], Rao and Ponugoti [8], J. Singh et al. 2014 [76], Baskaran et al. [77], and Uraraga et al. [78], a percentage of error of less than 8% between the predicted and experimental results indicates that the developed design of the experiment was successful in determining the response (wear rate) from the regression model.
4. Conclusion
- (i)
Al6061/nano-Al2O3/quartz hybrid MMC was successfully developed by the help of a stir casting technique by varying the weight percentage of the reinforcing particles.
- (ii)
The variation in the applied load, rotational speed, and weight percentage of the reinforcing hard particles are responsible for the change in the wear test results that are observed during the pin-on-disc wear test.
- (iii)
The optimum combination of levels for minimum dry sliding rate as observed from the main effect plot, 10 N applied load, 200 rpm rotational speed, and 12.5% of the reinforcing ceramic particles.
- (iv)
The ANOVA result depicts that the applied load has a maximum effect on the sliding wear rate of the developed hybrid composite, having 87.83% contribution, followed by the rotational speed, having 10.06% contribution.
- (v)
The confirmation test reveals that the predicted value of the sliding wear rate at optimum levels of factors has a closer agreement with the experimental result, having 6.934% error. The result shows that the design of the experiment conducted with the help of the Taguchi technique was successful for determining the dray sliding wear rate from the regression equation.
- (vi)
The physical property of the developed hybrid composite proves that the increase in the percentage weight fraction of the quartz particles increases the porosity level of the hybrid composite.
Conflicts of Interest
The authors have no conflicts of interest that affect this work.
Open Research
Data Availability
The data presented in this study are available on request from the corresponding author.


