Path Optimization in Robotic Welding of Plate Heat Exchangers: An Improved Ant Colony Approach
Abstract
In industrial robot welding heat exchanger plate route planning, there are drawbacks to using the traditional ant colony algorithm (ACA), including poor search efficiency and a propensity to trend toward the local optimum. To address the above issues, first of all, the article introduces the improved pheromone volatilization factor, which is adjustable based on iteration times in the ACA. Secondly, it combines the new perturbation strategy and the cross-mutation operation, proposes an improved genetic algorithm, and fuses it into the ACA, which increases the diversity of the ACA’s path searching and improves the ability of the local and global search. Finally, the improved ACA mechanism is verified by experiments and compared with six existing path planning algorithms (including three ACA variant algorithms and three mainstream algorithms). The experimental results show that the IACAG algorithm has excellent performance in welding heat exchanger path planning and can achieve lower calculation time and iteration times under the conditions of optimal solution and zero deviation, showing comprehensive advantages in solution quality, stability, and efficiency.
1. Introduction
In the modern manufacturing industry, welding robots are widely used as an efficient production tool in various production industries. However, when robots deal with complex welding tasks, the weld joints are usually distributed irregularly and in large numbers. Therefore, it is of great research significance to rationalize the order of weld joints and plan the welding path to save production time and improve productivity [1]. Welding path planning aims to plan a welding path that traverses all welding spots according to the set welding spot position while satisfying the robot motion constraints and achieving the optimization of the set goal. These set optimization objectives include the shortest welding path, the smoothest path, and so on [2]. This process is very similar to the traveling salesman problem (TSP) in the path planning problem, where the salesman must visit multiple cities before returning to the starting point, with the goal of minimizing the total distance traveled. At present, many scholars have conducted extensive research on the path planning problem and adopted many methods to solve this problem, among which the research focuses on the solution of various intelligent algorithms.
Traditional path planning algorithms mainly include the Dijkstra algorithm [3], best-first search (BFS) algorithm [4], A∗ algorithm [5], rapidly exploring random tree (RRT) algorithm [6], Dhouib-Matrix-3 (DM3) algorithm [7], Dhouib-Matrix-4 (DM4) algorithm [8], and so on. The Dijkstra algorithm has been widely used because of its definite results, simple principle, and applicability to positive weight graphs. However, this algorithm cannot deal with the negative-weight edge problem. To overcome this limitation, Zhou and Huang proposed a fusion method of the ant colony algorithm (ACA) and the Dijkstra algorithm, which significantly shortened the travel time and route length in the route optimization of airport-automated guided vehicles [9]. The BFS algorithm can quickly focus on the search direction with high potential and generally has a faster computation speed than the Dijkstra algorithm. Li et al. proposed a path planning method based on a bidirectional BFS algorithm combined with a v-graph, thus effectively shortening the path exploration time [10]. The A∗ algorithm is a synthesis of Dijkstra’s algorithm and the BFS algorithm, which has the characteristics of high efficiency, accuracy, and flexibility and is able to quickly find near-optimal paths in a variety of application scenarios, but its performance is greatly affected by the heuristic function. Based on the A∗ algorithm, Liu et al. successfully solved the problem of three-dimensional pipeline routing design by introducing new mechanisms such as node direction discrimination rule and two-layer domain extended search strategy [11]. Chen and Sun combined differential evolution and an improved A∗ algorithm to propose an AI-intelligent pathfinding method, which effectively optimized the robot’s picking path [12]. The RRT algorithm is a random sampling-based path planning algorithm with high search space coverage and a wide search range. However, due to its randomness, the algorithm has limitations in some cases. In this regard, researchers have proposed improved versions such as RRT∗ [13] and RRT∗-Connect [14] to enhance its performance and applicability. DM3 is outstanding in solving complex combinatorial optimization problems with its high efficiency and robustness. Dhouib and Zouari proposed the adaptive DM3 (A-DM3) algorithm by combining taboo memories with the DM3 algorithm, thus optimizing the unproductive tool paths for drilling series [15]. In a further development, with the application of the DM4 algorithm, Dhouib et al. proposed the DM4-PMO algorithm based on two Pareto-nondominated ensemble solutions, which was successfully applied to solve the multiobjective TSP [16].
Currently, more and more researchers tend to use heuristic algorithms to solve path planning problems. These algorithms mainly include particle swarm optimization (PSO) [17], genetic algorithm (GA) [18], student psychology based optimization (SPBO) algorithm [19], ACA [20], and so on. Although traditional heuristic algorithms have achieved some results in path planning, they have some limitations. Therefore, many scholars have begun to improve the existing intelligent algorithms or integrate multiple intelligent algorithms to give full play to the advantages of each algorithm and overcome its shortcomings, thus significantly improving the efficiency of problem solving. Ekrem and Aksoy made use of PSO for trajectory planning of the robotic arm, which significantly improved the time efficiency by optimizing the moving path from the start point to the endpoint [21]. Wang et al. proposed a multiobjective PSO method specifically used for path planning of mobile robots in rugged terrain to cope with challenges in complex environments [22]. Fernandes, Oliveira, and Fonseca Neto developed a new quantum PSO algorithm to plan trajectories for mobile robots in static and dynamic environments, effectively reducing energy consumption [23]. GAs perform well in many applications, but they also face phenomena such as premature convergence and complexity of encoding and decoding. Liu et al. improved the local search efficiency of the algorithm by introducing a key neighborhood search strategy and new crossover and mutation operators; nevertheless, the algorithm still has a slow convergence rate [24]. Li, Hu, and Liu established an initial population by heuristic median insertion method, generated a multiobjective fitness function, designed new operators, and added deletion operations so as to establish an improved multiobjective GA, which improves GA’s slow convergence speed and falls into local optimization [25].
Compared with the above heuristic algorithm, ACA has the advantages of high positive feedback, robustness, self-organization, and parallelism, which can play an important role in path planning, so it is widely used in the path planning of various scenarios. However, its shortcomings are also more obvious, and there are low search efficiency, slow convergence, easy to stagnate, and other problems. In view of these shortcomings, many scholars have developed many effective improvement methods on the basis of traditional ACA to solve these problems. Based on the traditional ACA, Li et al. introduced the neighborhood search mechanism based on an artificial bee colony algorithm to enhance the utilization of the optimal solution and changed the heuristic mechanism and path optimization mechanism to improve the convergence speed of the algorithm [26]. Liu et al. proposed a heuristic mechanism with adaptive pheromone concentration setting and directional judgment to improve the searchability and speed of the algorithm’s path planning and adopted an improved pseudorandom transfer strategy and a method to dynamically adjust the pheromone evaporation rate to avoid local optimization [27]. Wang et al. proposed an improved ACA, which introduced a path smoothing factor to achieve fast convergence and a smooth and safe path in mobile robot path planning [28]. Liu et al. proposed the dynamic adaptive ACO algorithm, which successfully solved the problem of pipeline routing design through directional information heuristic strategy, adaptive pseudorandom transfer strategy, and improved pheromone update mechanism [29]. Huang, Tan, and Jiang addressed the problems of slow convergence, redundant paths, and local optimality of the ACA in complex environments by using grid modeling, ant colony partitioning, and dynamic adjustment of path information quantity for optimization [30]. Du et al. solved the TSP by introducing initial pheromones, pseudorandom state transition rules, optimal and worst solutions, and dynamic penalties [31]. Luo et al. improved the search efficiency and convergence speed of the ACA by introducing unevenly distributed initial pheromones, introducing optimal and worst solutions, and increasing dynamic penalties [32]. Deng et al. combined ACA with a multistrategy PSO algorithm to propose a new pheromone initialization method and distribution mechanism to solve airport runway planning problems [33]. Yu, You, and Liu introduced the space explosion effect and long- and short-term memory mechanisms into the ACA, which improved the convergence speed and accuracy when processing large-scale data [34]. Wang et al. developed an enhanced ACA based on the Monte Carlo method, which significantly improved the efficiency of ant colony pathfinding and route planning ability [35]. Ma et al. proposed hybrid fireworks ACA for UAV path planning and established a mathematical model integrating energy consumption, navigation time, and distance cost [36]. Miao et al. solved the path planning problem of indoor mobile robots by enhancing the pheromone renewal strategy and state transfer probability [37]. Zhao, Fu, and Jiang enhanced the search capability of the ACA by introducing chaotic interference, reasonable allocation, and pheromone guidance [38]. Yang and Wang improved the pheromone update method, analyzed the early retention phenomenon in the ACA, introduced variable parameters and a local optimal search method, and effectively controlled the retention phenomenon in the process of algorithm convergence [39].
Although a large number of previous studies have verified the effectiveness of various enhancement strategies for ACA improvement, the algorithm still has problems such as slow convergence speed and easy fall into local optimal solutions, and relatively few studies have been done on the application of ACA in welding path planning. To address these challenges, welding path planning is selected as the research object in this paper, and an improved ant colony (IACAG) algorithm is proposed. The IACAG algorithm is based on the traditional ACA, and two key improvements are made: firstly, the pheromone volatility coefficients are improved to be dynamically adjusted according to the number of iterations in order to enhance the convergence speed of the algorithm, and secondly, the improved cross-variable operation is introduced to enhance the local search and global search capabilities. By comparing IACAG with other path planning algorithms in experiments, the research results show that IACAG performs well in welding path planning. These innovations not only enhance the performance of ACA in path planning but also provide new solution ideas for similar optimization problems.
2. Mathematical Model of Path Planning
2.1. Industrial Robot Coordinate System Establishment
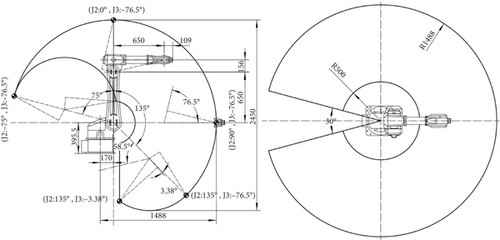
The machine used to perform the welding task in this paper is an industrial robot with the specification LH1500-B-6. This industrial robot consists of articulated axes with six degrees of freedom, which can realize a variety of processes such as tracking welding, painting, palletizing, and stamping. Its working range is depicted in Figure 1.
According to the mechanical structure of the LH1500-B-6 industrial robot, the kinematic coordinate system of each linkage of this robot is established based on the D-H parametric method. As shown in Figure 2, a total of seven coordinate systems are established, x0y0z0 as the base coordinate system. Joints 1–3 govern the end-effector’s spatial location, whereas Joints 4–6 control its attitude.
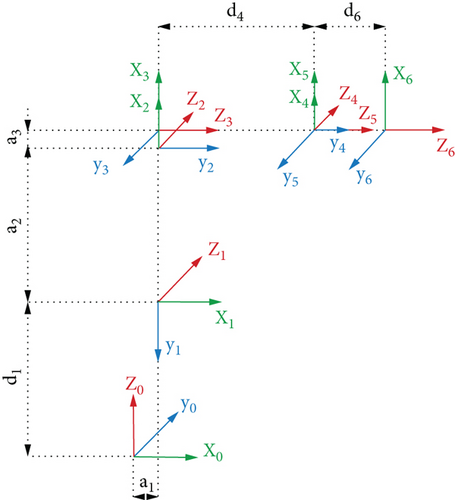
To facilitate the calculation of the transformation relation between the reference coordinate system and Joint 1 coordinate system, we overlap Joint 1 coordinate system with the reference coordinate system x0y0z0. The coordinate systems on Joints 2~6 are x1y1z1 ~ x5y5z5, respectively, and the coordinate frame x6y6z6 of the end effecter is the tool coordinate frame.
Based on the connecting rod coordinate system and structural measurements displayed in Figures 1 and 2, the kinematic parameters of each connecting rod and each joint of the industrial robot are obtained, and αi, ai, di, and θi represent the connecting rod’s torsion angle, link length, rod offset, and joint angle, respectively; the particular values are displayed in Table 1.
| i | αi( °) | ai (mm) | di (mm) | θi( °) |
|---|---|---|---|---|
| 1 | −90 | 170 (a1) | 395.5 (d1) | 0 |
| 2 | 0 | 650 (a2) | 0 | −90 |
| 3 | −90 | 156 (a3) | 0 | 0 |
| 4 | 90 | 0 | 650 (d4) | 0 |
| 5 | −90 | 0 | 0 | 0 |
| 6 | 0 | 0 | 109 (d6) | 0 |
2.2. LH1500-B-6 Robot Positive Kinematic Solution
As above, the kinematic positive solution equation of the industrial robot is obtained.
2.3. LH1500-B-6 Robot Inverse Kinematic Solution
- 1.
Solve joint angle θ1
- 2.
Solve joint angle θ2
- 3.
Solve joint angle θ3
- 4.
Solve joint angle θ5
- 5.
Solve joint angle θ4
- 6.
Solve joint angle θ6
From the above equation, we can find θ6 = Atan2(s6, c6).
2.4. Welding Path Planning Task Description
In the welding robot process, the robot end torch starts from a set start position and passes through a series of weld joints in turn, and each weld joint is visited only once and finally returns to the start position. Finding the shortest route among all the pathways while meeting the limitations is the purpose of route planning for welding.
3. Welding Path Planning Based on IACAG Algorithm
3.1. ACA
The ACA is an optimization algorithm derived from the collective foraging behavior of ants in nature [20]. When searching for food, ants produce pheromones along their paths, and they may communicate with one another based on the concentration of these pheromones. When other ants pass through the paths, they can sense the pheromones left by the previous ants and tend to choose the paths with higher pheromone concentrations, which leads to more and more ants choosing the same paths. The ants’ collective conduct might be seen as a positive feedback process that encourages them to travel as little distance as possible from their nest to the food source, ultimately leading to the best possible outcome.
3.2. GA
The GA simulates the processes of reproduction, extinction, and evolution of biological populations [18]. The main part of the algorithm is the population, which consists of individual individuals (also known as chromosomes), each of which is a solution to the problem, but there are advantages and disadvantages to these solutions, and the algorithm’s purpose is to discover the best possible solution. In GAs, individuals are coded by certain rules, and each individual consists of multiple genes, each of which represents a variable of the problem. Individuals in the population evolve gradually through choices, crossover, and mutation, retaining a set of elite individuals in the current population in each iteration and repeating the process to optimize individual fitness until the most effective solution to the issue is found.
A GA is a versatile optimization method that can address a variety of issues, such as multiobjective optimization and combinatorial optimization. The advantages of the algorithm are strong global searchability, the ability to handle multiple solutions at the same time, ease of integration with other algorithms, strong robustness, and scalability.
3.3. IACAG Algorithm
3.3.1. Improved Pheromone Volatilization Factor
The pheromone volatilization coefficient ρ in the ACA is always constant, which leads to a lack of searchability. The algorithm’s search performance is significantly impacted by the numerical size of ρ. If ρ is too large, the volatilization rate of pheromones is accelerated, which may result in the quick rejection of superior pathways, which means that the ants are unable to explore more possibilities during the search process and may miss potentially better solutions, thus decreasing the algorithm’s global search abilities. However, if ρ is too small, the difference in the pheromone content of the path decreases, and the algorithm’s convergence slows down. The ants will favor paths with higher pheromone concentrations during the search process, and better solutions may not be sufficiently explored and utilized in the initial stage. Therefore, determining an appropriate value of ρ is crucial for the search performance of the ACA. The link between global search and local optimization may be balanced with an appropriate ρ value and motivate the algorithm to search the solution space more thoroughly and provide better results. This needs to be adjusted and optimized according to the characteristics of the specific problem and running experience.
3.3.2. Improved Search Strategy
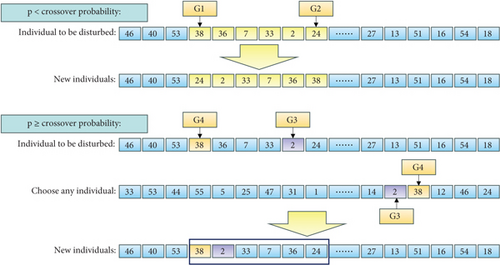
In research, the GA was enhanced for the route optimization issue of the TSP class and merged with the ACA. It has greater global search capabilities and is less likely to slip into a local optimum. Therefore, this work enhances the GA by introducing a novel perturbation method. In the TSP problem, the individual is represented as a Hamilton loop, that is, a sequence of cities, and each gene in the individual is represented as a city in the sequence, and the objective value can be calculated based on the sequence composed of two cities. In Figure 3, the classic neighborhood perturbation operator involves randomly selecting two locations, G1 and G2, and exchanging their positions, which will lead to a change in the distance at four places, which are the distances between the left and right neighbors of the G1 bits and the distances between the left and right neighbors of the G2 bits, respectively. Compared with the traditional neighborhood perturbation operator, the perturbation strategy in this paper will only change the distances between two gene positions and the neighboring genes, which are the distances between the G1 position and the left gene and the G2 position and the right gene, whereas the genes between G1 and G2 are just reversed in order but the distances are unchanged. Using this strategy can minimize the degree of perturbation at one time, which is positive for local search.

In this study, we offer an improved genetic manipulation approach that differs from the conventional crossover and mutation approaches. The specific steps of this method are shown in Figure 4. Firstly, set a crossover probability and randomly select a Point G1 in the chromosome, for example, G1 = 38, and generate a random number p. If the random decimal p is smaller than the crossover probability, then randomly select another point as the second Point G2 in the same individual, for example, G2 = 24, and invert the portion between G1 and G2. If the random decimal p is larger than or equal to the crossover probability, then a fresh individual has been chosen at random among the overall population, and Point G3 adjacent to G4 = 38 in the person’s former position is found, such as G3 = 2. Then, go back to the original individual and invert the part between 35 and 3. This new concept of genetic manipulation makes full use of population knowledge to drive the process of variation in the individual, thus improving the efficiency of the genetic operator.
3.3.3. IACAG Algorithm Process
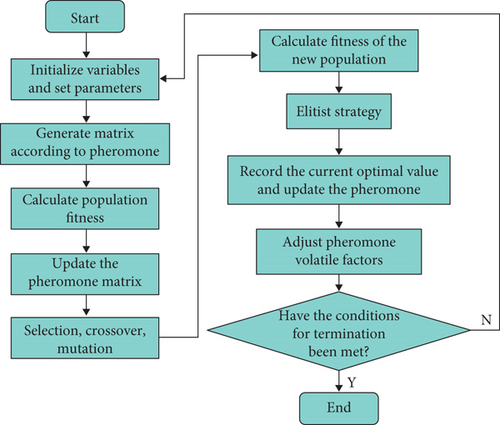
The algorithm flow constructed by combining the IACAG algorithm and GA is shown in Figure 5.
4. Performance Test and Simulation Analysis of IACAG Algorithm
In this section, two controlled experiments are designed to test the performance of the IACAG algorithm, and six test sets of different sizes are selected from TSPLIB. Firstly, the first set of experiments is to compare and test the two improvement schemes proposed above on the basis of the traditional ACA. Secondly, the second set of experiments is to test IACAG against popular algorithms and ACA variants newly developed in recent years. All algorithms are run independently 20 times to ensure the stability of the algorithm.
4.1. Improvement Plan Testing
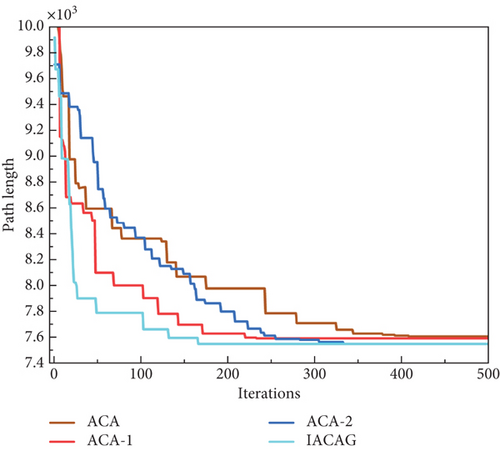
In order to verify the effectiveness of the two improvement schemes proposed in this paper, the two improvement methods were separately integrated into the ACA to form a control experiment of four algorithms consisting of ACA, ACA-1 (adding only the improved pheromone volatilization factors), ACA-2 (adding only the improved search strategy), and IACAG. The experiment will be conducted on the berlin52 test set of the TSP problem. The parameters of the four algorithms are the same, and the values are m = 100, Q = 100, α = 1, β = 2, and ρ = 0.6, and mutation probability and crossover probability are 0.01 and 0.6, respectively. Figure 6 shows the IACAG path planning results and the optimal iterative convergence curves of the four algorithms, and Table 2 describes the running results of the four algorithms.

| TSP instance | BKS | Algorithm | Best | Worst | Mean | SD | PDav | ACT (s) | ACI |
|---|---|---|---|---|---|---|---|---|---|
| berlin52 | 7542 | ACA | 7601 | 8116 | 7759.46 | 55.16 | 2.88 | 15.71 | 412 |
| ACA-1 | 7586 | 7970 | 7682.72 | 49.48 | 1.87 | 11.49 | 238 | ||
| ACA-2 | 7544 | 7719 | 7618.16 | 34.81 | 1.01 | 15.23 | 398 | ||
| IACAG | 7542 | 7558 | 7549.40 | 3.42 | 0.01 | 9.80 | 208 |
As can be seen from Table 2, the average number of convergence iterations of the ACA-1 algorithm is significantly less than that of the ACA, which implies the improvement of the improved pheromone volatilization factor in the algorithm’s searching speed; at the same time, in the algorithm’s solution process, the optimal solution of the ACA-2 algorithm’s run is better than that of the results of the ACA and the ACA-1, which verifies that the improved searching strategy better enhances the algorithm’s global searching ability. From the overall data, both in terms of algorithmic solution results and algorithmic solution speed and stability, the IACAG algorithm is significantly improved compared with the remaining three algorithms, and the convergence curves further verify the effectiveness of the two mechanisms. In summary, the improved pheromone volatilization factor and search strategy proposed in this paper can effectively improve the performance of the ACA.
4.2. Comparison of the IACAG Algorithm With Other Algorithms
4.2.1. Algorithm Simulation Statistical Results
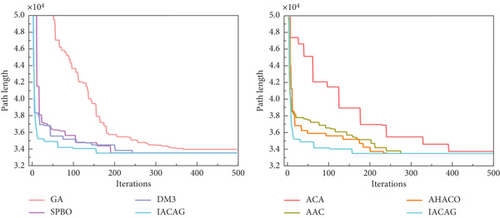
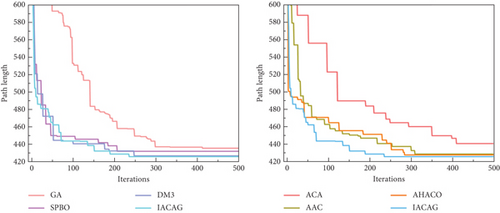
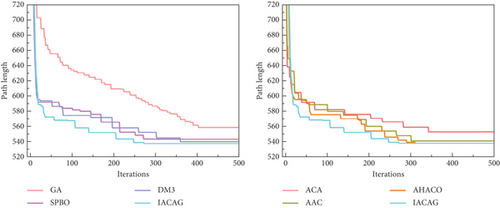
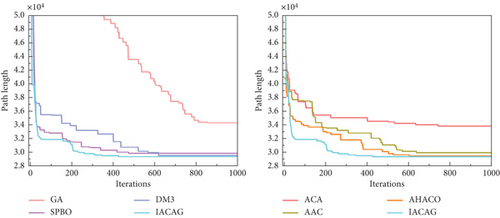
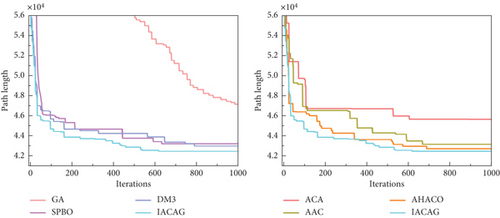
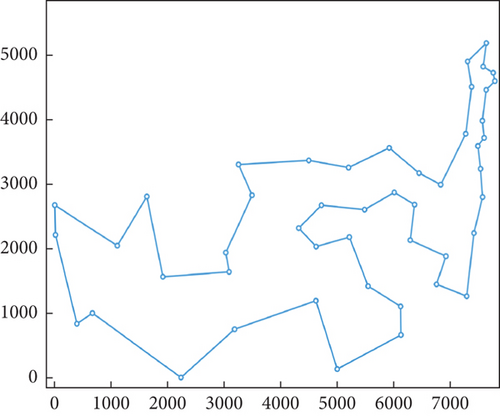
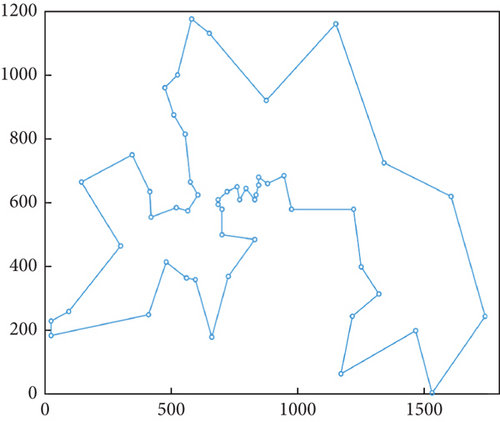
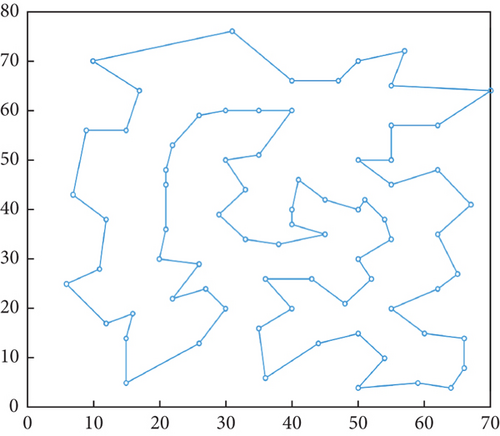
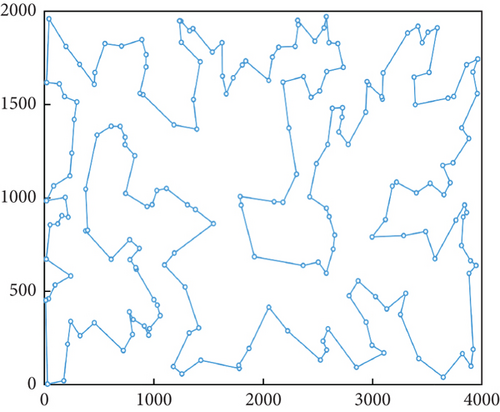
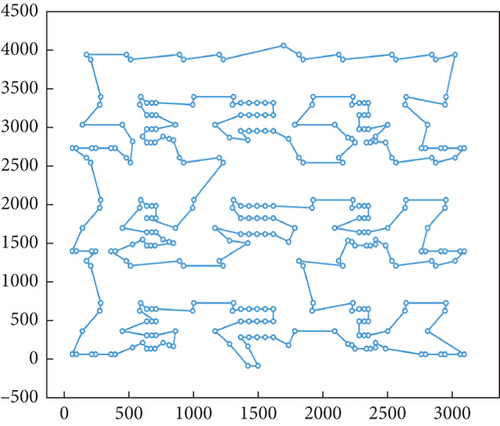
In the study of optimization problems, it is very important to select efficient and superior algorithms. In order to evaluate the advantages and disadvantages of different algorithms, this section conducts a series of comparative experiments between the IACAG algorithm and ACA variant algorithms (including ACA, AAC, and AHACO) and other popular algorithms (such as GA, SPBO, and DM3) and analyzes the obtained data in depth. In order to evaluate the advantages and disadvantages of different algorithms, this section conducts a series of comparative experiments between the IACAG algorithm and ACA variant algorithms (including ACA, AAC, and AHACO) and other popular algorithms (such as GA, SPBO, and DM3) and analyzes the obtained data in depth. The TSP instance uses the att48, eil51, eil76, kroA200, and lin318 questions in TSPLIB, where att48, eil51, and eil76 are small-scale test sets and the parameters of the IACAG algorithm are set as m = 150, Q = 150, α = 1, and β = 2. The mutation probability and crossover probability are 0.01 and 0.6, respectively, and the algorithm iteration times are 500 generations. kroA200 and lin318 are large-scale test sets. IACAG algorithm parameters are set as m = 150, Q = 150, α = 1, and β = 2, and mutation probability and crossover probability are 0.01 and 0.6, respectively, and algorithm iteration times are 1000 generations. Figure 7 shows the optimal iteration curve of all algorithms, and Figure 8 shows the path graph of the optimal solution of the IACAG algorithm. The experimental results are shown in Table 3.

| TSP instance | BKS | Algorithm | Best | Worst | Mean | SD | PDav | ACT (s) | ACI |
|---|---|---|---|---|---|---|---|---|---|
| att48 | 33522 | GA | 33,975 | 35,134 | 34466.42 | 104.70 | 2.82 | 7.51 | 431 |
| ACA | 33,768 | 35,387 | 34124.61 | 224.30 | 1.80 | 11.94 | 408 | ||
| SPBO | 33,555 | 34,198 | 33861.64 | 74.20 | 1.01 | 21.71 | 216 | ||
| DM3 | 33,522 | 33,858 | 33647.02 | 32.05 | 0.37 | 28.42 | 259 | ||
| AAC | 33,522 | 34,352 | 33986.34 | 141.05 | 1.39 | 13.62 | 346 | ||
| AHACO | 33,522 | 33,735 | 33621.04 | 27.35 | 0.29 | 12.72 | 312 | ||
| IACAG | 33,522 | 33,612 | 33543.02 | 9.73 | 0.06 | 11.12 | 176 | ||
| eil51 | 426 | GA | 435 | 447 | 441.21 | 3.18 | 3.57 | 7.45 | 436 |
| ACA | 441 | 457 | 449.37 | 5.81 | 5.49 | 13.42 | 417 | ||
| SPBO | 432 | 443 | 436.83 | 4.87 | 2.54 | 23.42 | 226 | ||
| DM3 | 427 | 439 | 430.14 | 2.97 | 0.97 | 18.67 | 269 | ||
| AAC | 429 | 445 | 435.34 | 2.98 | 2.19 | 13.84 | 398 | ||
| AHACO | 428 | 432 | 429.82 | 1.21 | 0.90 | 10.52 | 334 | ||
| IACAG | 426 | 433 | 428.45 | 0.91 | 0.58 | 11.41 | 248 | ||
| eil76 | 538 | GA | 559 | 585 | 570.35 | 8.56 | 6.01 | 7.68 | 427 |
| ACA | 556 | 578 | 573.31 | 9.21 | 6.6 | 18.96 | 386 | ||
| SPBO | 543 | 570 | 558.92 | 6.33 | 3.89 | 36.13 | 326 | ||
| DM3 | 540 | 565 | 548.83 | 5.81 | 2.18 | 29.83 | 386 | ||
| AAC | 541 | 552 | 548.32 | 4.39 | 1.92 | 20.36 | 327 | ||
| AHACO | 539 | 546 | 543.75 | 3.55 | 1.07 | 17.61 | 312 | ||
| IACAG | 538 | 544 | 540.69 | 1.36 | 0.5 | 17.41 | 307 | ||
| kroA200 | 29368 | GA | 34,293 | 38,244 | 35512.75 | 931.30 | 20.92 | 52.44 | — |
| ACA | 30,833 | 31,961 | 31365.62 | 361.09 | 6.80 | 126.46 | 824 | ||
| SPBO | 29,864 | 31,186 | 30774.76 | 366.60 | 4.79 | 318.43 | 604 | ||
| DM3 | 29,563 | 30,736 | 30097.05 | 199.66 | 2.48 | 169.72 | 679 | ||
| AAC | 29,766 | 30,433 | 29964.85 | 223.55 | 2.03 | 135.73 | 658 | ||
| AHACO | 29,459 | 30,046 | 29802.71 | 173.91 | 1.48 | 114.45 | 636 | ||
| IACAG | 29,383 | 29,537 | 29447.80 | 44.23 | 0.27 | 112.46 | 545 | ||
| lin318 | 42029 | GA | 47,157 | 50,638 | 48368.17 | 984.64 | 15.08 | 86.32 | — |
| ACA | 48,167 | 49,736 | 48777.35 | 534.67 | 16.06 | 207.31 | 753 | ||
| SPBO | 43,211 | 46,082 | 44467.76 | 632.52 | 5.80 | 582.71 | 709 | ||
| DM3 | 42,983 | 44,147 | 43518.63 | 469.46 | 3.54 | 312.34 | 858 | ||
| AAC | 43,017 | 44,620 | 43985.47 | 432.18 | 4.66 | 217.54 | 764 | ||
| AHACO | 42,562 | 43,550 | 43153.75 | 297.12 | 2.68 | 196.47 | 759 | ||
| IACAG | 42,458 | 43,249 | 42731.24 | 203.33 | 1.67 | 188.72 | 732 | ||
In Table 3, the symbol “—” indicates that the set number of iterations is exceeded. From the statistical data, the optimal solutions (33522, 426, and 538) of the IACAG algorithm in the small test set (att48, eil51, and eil76) are able to reach the standard optimal solution of the test set. In addition, the IACAG algorithm performs better than other algorithms in SD (9.73, 0.91, and 1.36), average solution (33543.02, 428.45, and 540.69), and average deviation percentage (0.06%, 0.58%, 0.5%). In contrast, there is a large gap between the optimal solution of the GA and ACA and the standard optimal solution, and it also lags behind other algorithms in other indicators. The optimal solution of the SPBO algorithm is slightly lower than the standard optimal solution. Although DM3, AAC, and AHACO algorithms can solve the standard optimal solution of the att48 problem, the stability and computing speed of these three algorithms are lower than that of the IACAG algorithm in terms of SD, average solution, and average deviation percentage.
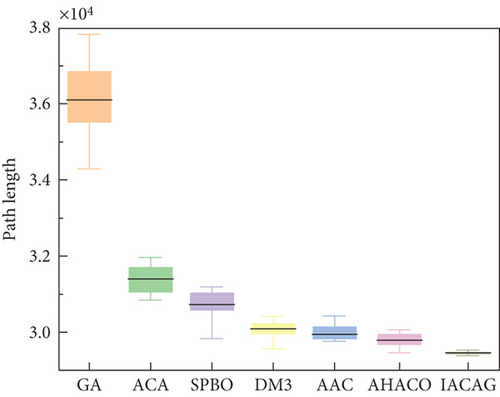
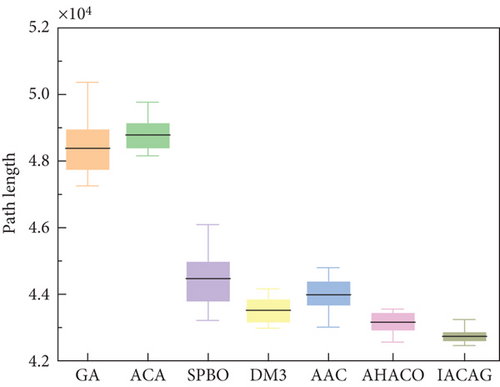
In the medium- and large-scale test sets (kroA200 and lin318), we plotted box-and-line diagrams (see Figure 9) in order to compare the advantages and disadvantages of each algorithm more clearly. Combining Table 3 and Figure 9, we can see that the GA and ACA are significantly inferior in terms of optimal solution, average solution, and SD, and the average number of converged iterations of the GA exceeds the set maximum number of iterations. The IACAG algorithm shows better stability in terms of SD (44.23 and 203.33), while the other algorithms such as SPBO, DM3, AAC, and AHACO are relatively less stable. The IACAG algorithm also performs optimally in terms of percentage deviation from the average solution (0.27% and 1.67%). In terms of average computation time, there are significant differences between the algorithms, with the IACAG algorithm usually performing reasonably well without excessive computation time.
The overall framework of the IACAG algorithm does not significantly change the traditional ACA, and the impact on time complexity is not significant. Through the analysis of the average computing time, it can be seen that the time consumption of the ACA is proportional to the size of the test set. For the sake of description, assume that the number of test centers is k. The path generation process is the most time-consuming step in the algorithm, which involves the selection of each city, and for each selection, k/2 points need to be selected on average. Since k points need to be selected, the time complexity can be expressed as O(k2). In the ACA, every individual in the population performs the same calculation, and the time complexity is expressed as O(k). The population iteration process is repeated in cycles, and the time complexity of each iteration is also O(k). The ACA is highly parallel and robust, which means that the various parts of the algorithm can be processed in parallel, thus improving computational efficiency. Compared with other algorithms, the IACAG algorithm can find acceptable solutions in a reasonable time, which makes it show obvious advantages in some problems.
In general, the IACAG algorithm shows obvious advantages in solving the accuracy and stability of datasets. IACAG is able to achieve optimal and yet stable results on small-scale datasets, and the results of IACAG are closest to the standard optimal solution on medium- and large-scale datasets (29,383 and 42,458, respectively). The SD of IACAG (9.73, 0.91, 1.36, 44.23, and 203.33) and the percentage deviation of the average solution (0.06%, 0.58%, 0.5%, 0.27%, and 1.67%) show higher stability and accuracy in all comparison algorithms. Therefore, the improved IACAG algorithm shows superior performance in terms of both the accuracy and stability of the solution and is the preferred algorithm when dealing with complex optimization problems, which further validates the effectiveness of the improved method.
4.2.2. Friedman’s Test
The Friedman test is a nonparametric statistical method widely used to detect processing differences between multiple correlated samples. The method is able to compare algorithms simultaneously by ranking all test results and synthesizing their performance over multiple tests. This test not only helps to identify the best algorithm but also evaluates the relative performance of all algorithms and their rankings, thus providing a comprehensive comparative analysis.
| Index | Friedman’s test | Algorithm | ||||||
|---|---|---|---|---|---|---|---|---|
| GA | ACA | SPBO | DM3 | AAC | AHACO | IACAG | ||
| Best | Total rank | 33 | 32 | 25 | 14.5 | 18.5 | 10.5 | 6.5 |
| Average rank | 6.6 | 6.4 | 5 | 2.9 | 3.7 | 2.1 | 1.3 | |
| Worst | Total rank | 33 | 32 | 23 | 17 | 20 | 9 | 6 |
| Average rank | 6.6 | 6.4 | 4.6 | 3.4 | 4 | 1.8 | 1.2 | |
| Mean | Total rank | 32 | 33 | 24 | 17 | 19 | 10 | 5 |
| Average rank | 6.4 | 6.6 | 4.8 | 3.4 | 3.8 | 2 | 1 | |
| SD | Total rank | 30 | 31 | 27 | 17 | 20 | 10 | 5 |
| Average rank | 6 | 6.2 | 5.4 | 3.4 | 4 | 2 | 1 | |
| PDav | Total rank | 32 | 33 | 24 | 17 | 19 | 10 | 5 |
| Average rank | 6.4 | 6.6 | 4.8 | 3.4 | 3.8 | 2 | 1 | |
| Time | Total rank | 5 | 19 | 34 | 31 | 25 | 15 | 11 |
| Average rank | 1 | 3.8 | 6.8 | 6.2 | 5 | 3 | 2.2 | |
| ACI | Total rank | 35 | 26.5 | 10 | 22.5 | 23 | 17 | 6 |
| Average rank | 7 | 5.3 | 2 | 4.5 | 4.6 | 3.4 | 1.2 | |
For the optimal solution index, the Fr value is 27.56, greater than 12.592, so the null hypothesis is rejected, and the average rank of the IACAG algorithm in the optimal solution index is better than other algorithms, indicating that it has obvious advantages in solving the optimal solution. In the worst solution index, the Fr value is 27.7, which is also greater than 12.592, the null hypothesis is rejected, and the performance of the IACAG algorithm in this index is also better than other algorithms. In addition, the Fr values for the mean, SD, percentage deviation of the mean solution, mean computation time, and mean convergence iterations are 28.46, 25.89, 28.46, 28.89, and 25.18, respectively. The null hypothesis is rejected in all of these indicators, and the IACAG algorithm performs well in all of them except for the average computation time indicator, where the average rank is slightly lower than that of the GA. Therefore, the IACAG algorithm is significantly better than GA, ACA, SPBO, DM3, AAC, and AHACO in terms of comprehensive performance.
5. Heat Exchanger Plate Weld Joint Path Planning
This paper takes a welding robot station as the research object. In the same parameter settings, the algorithm mentioned in Section 3.2 is used to simulate the welding path of the heat exchange plate in MATLAB. To avoid the chance of algorithmic solution results and to ensure that the algorithm is comparable, this paper will run kinds of algorithms several times to select the optimal path with the most results. Table 5 shows the running results of various algorithms. Figure 10 depicts optimal iterative convergence curves for various algorithms, and Figure 11 displays the simulation results for the IACAG algorithm.
| Instance | Algorithm | Best | Mean | SD | PDav | ACT (s) | ACI |
|---|---|---|---|---|---|---|---|
| Welding path example | GA | 1841.528 | 1843.61 | 1.55 | 1.67 | 10.12 | 347 |
| ACA | 1849.890 | 1851.71 | 1.73 | 2.11 | 15.42 | 322 | |
| SPBO | 1813.375 | 1814.32 | 0.44 | 0.05 | 24.17 | 224 | |
| DM3 | 1813.375 | 1813.375 | 0 | 0 | 13.98 | 167 | |
| AAC | 1824.85 | 1825.96 | 0.27 | 0.07 | 15.74 | 217 | |
| AHACO | 1813.375 | 1813.375 | 0 | 0 | 14.67 | 183 | |
| IACAG | 1813.375 | 1813.375 | 0 | 0 | 13.03 | 146 |
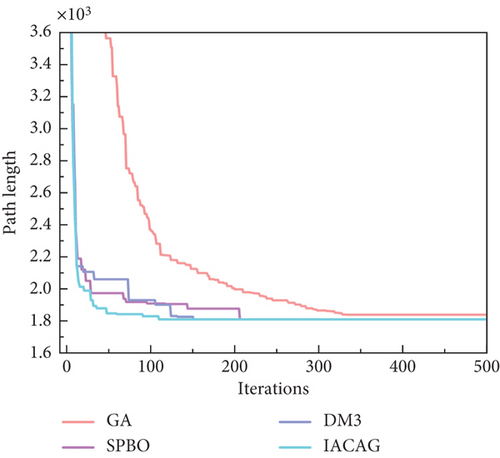
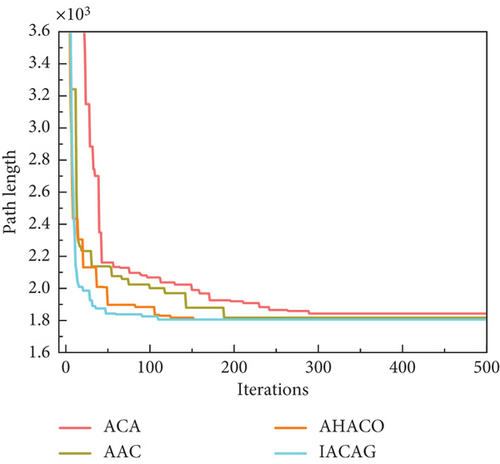

According to the statistical data of the simulation results in Table 5, it can be seen that the solution results of the ACA, GA, and AAC algorithms are significantly different from other algorithms, and there are crossover problems in the paths. From the perspective of various indexes, although the SPBO algorithm can provide ideal results, its SD shows that the solution results are unstable. In contrast, the SD of IACAG and the percentage deviation of the mean solution are both 0, which is consistent with DM3 and AHACO, indicating that the IACAG algorithm not only has high-quality solutions but also has the strongest consistency. In addition, IACAG also excelled in computational efficiency, with the lowest average computation time (13.03 s) and the lowest average convergence iterations (146) of all algorithms. This shows that IACAG can achieve high-quality solutions while maintaining efficient computational performance. In summary, the IACAG algorithm has outstanding performance in welding path planning and can achieve low calculation time and iteration times with an optimal solution and zero deviation, showing its comprehensive advantages in solution quality, stability, and efficiency. Table 6 gives the coordinates of the weld path example.
| Number | (x, y) |
|---|---|
| 1 | (600, 512) |
| 2 | (612, 524) |
| 3 | (615, 524) |
| 4 | (667, 524) |
| 5 | (729, 524) |
| 6 | (801, 524) |
| 7 | (883, 524) |
| 8 | (965, 524) |
| 9 | (1047, 524) |
| 10 | (1049, 524) |
| 11 | (1131, 524) |
| 12 | (1213, 524) |
| 13 | (1295, 524) |
| 14 | (1367, 524) |
| 15 | (1429, 524) |
| 16 | (1481, 524) |
| 17 | (1484, 524) |
| 18 | (1496, 512) |
| 19 | (612, 500) |
| 21 | (667, 500) |
| 22 | (729, 500) |
| 23 | (801, 500) |
| 24 | (883, 500) |
| 25 | (965, 500) |
| 26 | (1047, 500) |
| 27 | (1049, 500) |
| 28 | (1131, 500) |
| 29 | (1213, 500) |
| 30 | (1295, 500) |
| 31 | (1367, 500) |
| 32 | (1429, 500) |
| 33 | (1481, 500) |
| 34 | (1484, 500) |
| 35 | (634, 526) |
| 36 | (700, 522.8) |
| 37 | (776, 524.9) |
| 38 | (840, 522.6) |
| 39 | (932, 524.3) |
| 41 | (1092, 526) |
| 42 | (1179, 525.3) |
| 43 | (1255, 522.7) |
| 44 | (1333, 525.3) |
| 45 | (1400, 526.7) |
| 46 | (1450, 522.6) |
| 47 | (642, 498.5) |
| 48 | (689, 501.2) |
| 49 | (757, 500.8) |
| 50 | (856, 499.3) |
| 51 | (912, 501.2) |
| 52 | (999, 498.1) |
| 53 | (1088, 501.7) |
| 54 | (1177, 500.7) |
| 55 | (1266, 498.6) |
| 56 | (1323, 500.3) |
| 57 | (1389, 502) |
| 58 | (1466, 499.3) |
6. Conclusion
Aiming at the problems of welding path planning of all-welded plate heat exchangers, this paper proposes a welding path planning method based on an IACAG algorithm to overcome the shortcomings of the traditional ACA in specific applications. Based on the ACA, the IACAG algorithm improves the pheromone volatilization coefficient and search strategy. Then, through the test of these two improvement mechanisms, the effectiveness of them to improve the performance of the ACA is verified. In addition, this study compares the IACAG algorithm with seven existing algorithms, such as GA, SPBO, DM3, ACA, AAC, and AHACO, and the results show that the IACAG algorithm is more efficient and accurate in solving path planning problems. Finally, the practicability and high efficiency of the IACAG algorithm in actual welding production are further verified by the comparison experiment on the welding path of the heat exchanger plate.
However, the research on welding path planning based on the IACAG algorithm is still in its infancy. Improvements are still needed in handling large datasets and adapting to dynamic environmental problems, which will be the focus of future research. In addition, the IACAG algorithm can also be applied to complex production scheduling, logistics optimization, and other practical problems and has wide potential. Through continuous optimization, efficient solutions can be provided for more areas.
Conflicts of Interest
The authors declare no conflicts of interest.
Author Contributions
Xianlong Chu: data curation, project administration, writing–original draft. Xinning Li: conceptualization, formal Analysis, writing–editing. Hu Wu: methodology, visualization, writing–review and editing. Xianhai Yang: formal analysis, supervision, writing–review. Liyong Yang: resources, validation.
Funding
This research was supported by the Zibo Key Science and Technology Development Program Project (No. 2018ZBXC182).
Acknowledgments
This work was supported by the Zibo Key Science and Technology Development Program Project (No. 2018ZBXC182).
Open Research
Data Availability Statement
The data that support the findings of this study are available from the corresponding author upon reasonable request.


