Optimizing Hydrogen Storage Pathways in Ti–Al Alloys through Controlled Oxygen Addition
Abstract
In the present study, we aimed to destabilize the Ti–Al system with nonmetallic oxygen. The synthesis of α-(Ti, Al)[O] starting from TiO2, Ti, and Al was carried out through the arc melting method, resulting in three different oxygen content levels, 3.4, 10, and 20 at%. The room temperature activation of α-(Ti, Al)[O] was not successful, and the activation was performed at 300°C under 5 MPa H2 pressure. The structural changes after hydrogenation (maximum absorption capacity of 3.74 wt% hydrogen) arose from the transformation of α-(Ti, Al)[O] to cubic (Ti, Al)[O]Hx (c-(Ti, Al)[O]Hx); nonetheless, they recovered their original lattice parameters, which are meaningfully larger than those of α-Ti, after dehydrogenation. The hydrogen storage capacities for various α-(Ti, Al)[O] compositions generally decreased with increasing oxygen (3.4 and 10 at%) and aluminum content in the alloy. In contrast, for the compositions with a higher oxygen content of 20 at%, the hydrogen storage capacity slightly increased as the Al concentration increased: Ti0.790Al0.010O0.200 absorbed 2.91 wt% hydrogen, whereas Ti0.767Al0.033O0.200 absorbed 3.04 wt% hydrogen. The thermogravimetric analysis showed that samples with 20 at% O released hydrogen at lower temperatures even though the major phase after hydrogenation is c-(Ti, Al)[O]Hx regardless of the oxygen content.
1. Introduction
Amid the global debates surrounding climate change, the search for energy sources that effectively reduce carbon emissions and mitigate their impact is becoming increasingly important [1]. The 2016 Paris Agreement set limits on CO2 emissions and aimed to limit the temperature increase to 2°C by 2050 [2]. In view of this, moving to a low-carbon energy system to replace fossil fuels is a necessity. Among the various alternative solutions, hydrogen stands out as the best option with significant long-term potential. Before hydrogen-based technology becomes a realistic alternative, the problems related to it must be solved [3]. An ideal green hydrogen cycle includes producing hydrogen via solar-powered water electrolysis, storing it in metal hydrides, and then using it to generate electricity in fuel cells as needed [4, 5]. The storage of hydrogen in metal hydride (MH) has become a safe and efficient option compared to cryogenic liquefaction or high-pressure compression. However, despite decades of research, no hydride has met all of the requirements for effective H2 storage targets set out by the US Department of Energy in 2015 [6]. Therefore, to make these hydrides viable, R&D is necessary to overcome the problems associated with them [7, 8, 9]. Titanium, the ninth most abundant element on earth (0.63% in the crust), has been found to be suitable for hydrogen storage, as it forms TiH2 (4.03 wt%) upon hydrogenation [10, 11]. However, the enthalpy of formation of TiH2 is −141 kJ/mol, requiring a very high desorption temperature to release hydrogen [12]. To make the Ti–H system an efficient hydrogen storage material, substantial hydride destabilization is needed.
In this regard, the Ti–Al–H system has attracted attention as a promising hydrogen storage material because it consists of a hydride-forming element, Ti, and a nonhydride-forming element, Al. The two main problems preventing Ti–Al–H from becoming viable hydrogen storage materials are (1) phase separation upon hydrogenation and (2) high dehydrogenation temperature. Ti–Al alloys with up to approximately 35 at% Al have the same crystal structure as pure titanium, characterized by a hexagonal close-packed (HCP) structure [10, 13, 14, 15, 16, 17]. Many research efforts have been carried out to address these issues and make Ti–Al–H system a viable hydride. First, hydrogenation of the alloy produces different crystalline structures depending on the additional alloying element. Hydrogen-induced amorphization (HIA), a notable outcome of hydrogenation in Ti–Al alloys, leads to the formation of an amorphous structure. This phenomenon is closely related to disproportionation, one of the factors contributing to the deterioration of hydrogen absorption and desorption properties [14, 15, 16]. The Ti0.75Al0.25 alloy could absorb more hydrogen than its stoichiometric ratio, reaching an H/Ti ratio of more than 2 when fully hydrogenated to Ti0.75Al0.25Hx, where x was larger than 1.5 [10]. The explorations of ternary Ti3Al alloys with substitutions of V, Cr, Mn, Fe, Co, Ni, Cu, Zr, and Hf revealed that the hydrogen absorption and desorption properties are closely linked to the crystal structure of their respective hydrides [15, 16]. Amorphous structures formed in alloys with Zr or Hf substitutions exhibited a substantial hydrogen capacity; however, their desorption occurred at higher temperatures compared to binary Ti–Al hydrides [16]. Hashi et al. [18] showed that the introduction of V or Cr to Ti–Al led to body-centered cubic (BCC) hydrides, resulting in a limited hydrogen capacity. Conversely, substitutional elements such as Mn, Co, and Ni, which form the C14 Laves-type hydrides in ternary Ti–Al-based alloys, possess the ability to lower the desorption temperature without significantly decreasing the hydrogen capacity [15, 16]. According to a previous study [17], the hydrogenation of Ti3Al could be destructive and lead to the formation of TiH2 and Al separately. In contrast, further research showed that Ti3Al and Ti3Sn can absorb hydrogen without changing their crystal structures [10, 19]. Stoichiometric Ti3Al (Ti0.75Al0.25) was found to absorb hydrogen without HIA and transform into a face-centered cubic (FCC) Ti3AlHx structure, but off-stoichiometric Ti3Al (i.e., Ti0.70Al0.30) underwent HIA [18, 20]. The hydrogen absorption capacity for this alloy is H/M (hydrogen to metal ratio) = 1.45, equivalent to 3.32 wt%. Second, destabilization of Ti has been approached with an alloying strategy. Ishikawa et al. [15, 16] showed that replacing the Ti content in Ti3Al with Mn, Co, Ni, and Nb can effectively lower the hydrogen desorption temperature. These two major issues, the structure and stability of the resulting hydride, are the key targets to be addressed in the development of a novel Ti–Al-based alloy.
Recent research has also unveiled the potential for tuning hydride stability by incorporating nonmetallic elements such as carbon (C), nitrogen (N), and oxygen (O) [21, 22, 23, 24, 25, 26]. Since the Ti–Al binary system exhibits high oxygen solubility, oxygen can also be employed to tune its hydrogen storage properties. In the present study, we attempted to destabilize the Ti–Al–H system with the nonmetallic element oxygen. The inclusion of oxygen (3.4, 10, and 20 at% O) stabilizes the Ti–Al alloy during hydrogenation, which may prevent phase separation. We investigated seven different compositions in the single-phase region of α-(Ti, Al)[O] in the Ti–Al–O phase diagram, and their hydrogen absorption and desorption properties were characterized. The phase change after hydrogenation and its effect on hydrogen storage capacity were discussed based on X-ray diffraction (XRD), scanning electron microscopy (SEM), and transmission electron microscopy (TEM) analysis.
2. Materials and Methods
2.1. Sample Preparation
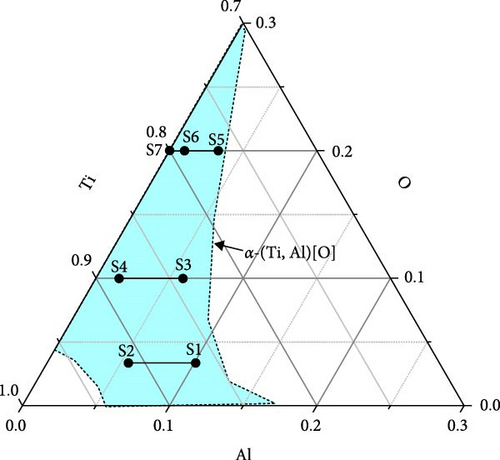
High-purity materials were employed in this study, including Ti (99.995% purity, RND Korea), Al (99.9% purity, RND Korea), and TiO2 (99.99% purity, KRT). Seven different alloy compositions were prepared by arc melting of these materials under an argon (Ar) atmosphere. The compositions chosen are 3.4 at% oxygen (Ti0.866Al0.101O0.034 (S1) and Ti0.911Al0.055O0.034 (S2)), 10 at% oxygen (Ti0.841Al0.059O0.100 (S3) and Ti0.884Al0.016O0.100 (S4)), and 20 at% oxygen (Ti0.767Al0.033O0.200 (S5), Ti0.790Al0.010O0.200 (S6), and Ti0.8O0.2 (S7)). TiO2 powder was pelletized before arc melting to avoid evaporation and prevent sublimation during arc melting. The oxygen contents were 3.4, 10, and 20 at%, and two different aluminum contents were chosen for each oxygen content. In addition, a composition without Al was made for 20 at% O, that is, Ti0.8O0.2. The alloy compositions are marked in the Ti–Al–O phase diagram in Figure 1, and the list of the alloys produced in this study in their nominal compositions is provided in Table S1. Approximately 10 g of each alloy composition was prepared. To prevent oxygen incorporation, a Ti getter was utilized in the arc melting process. To achieve a homogeneous composition, the buttons were remelted five times and turned over after each melting. The weight loss of the samples after arc melting was less than 0.5%, as summarized in Table S1.
2.2. Hydrogenation
The activation, that is, first-time hydrogenation, was performed using a volumetric analyzer (HPVA II, Particulate Systems and GASPRO HA, SETARAM). The materials were crushed to a particle size of 2–3 mm in air and added to a stainless steel reactor (internal volume of 2 cm3) for the activation procedure. The activation of the as-prepared samples started by evacuating the reactor for 1–8 hr. After evacuation, 5 MPa H2 (99.9999% purity) was added to the reactor at room temperature (RT) for 60 min. However, activation at RT was unsuccessful, and the reactor temperature was raised up to 300 by 50°C until activation started. Finally, the activation was conducted at 300°C under 5 MPa H2 for all the samples. The activation of pure titanium was conducted at 345°C under 5 MPa H2 pressure.
2.3. Phase and Structural Analysis
For the phase analysis, XRD (Bruker D8 Advance X-ray diffractometer; CuKα radiation, λ = 1.5418 Å) was used. A sample of approximately 2 g was manually crushed, and a powder sample was loaded onto a sample holder to perform XRD. The XRD measurements were run in a 2θ range of 10°–90° with a step size of 0.02°. Rietveld refinement (TOPAS software ver. 5, Bruker AXS GmbH) on the XRD data was performed to analyze the phases present, the amount, and the lattice parameters of each phase in the samples.
2.4. Microstructure Analysis
SEM (INSPECT F-50, FEI Company) was used to analyze the microstructure of the alloys. Energy dispersive X-ray spectroscopy (EDS) was used to analyze the chemical compositions. For the SEM/EDS analysis, the specimens were mounted and mechanically polished with 1-μm diamond compound.
TEM and scanning transmission electron microscopy (STEM)–EDS were used to examine the phase and element distribution in smaller areas. A transmission electron microscope (Talos F200X, FEI) with an acceleration voltage of 200 kV was used to examine the morphology of the S5 sample after hydrogenation. In addition, EDS (Super X system, Bruker) was used for elemental mapping to visualize the distribution of Ti, Al, and O particles in the S5 sample. High-angle annular dark-field (HAADF) images were acquired in STEM mode. For the TEM observation, nanometer-sized powders were directly used. To reduce the particle size down to the electron penetrable thickness, approximately 100 nm, additional ball milling was carried out, and the powders were immersed in ethanol and sonicated for dispersion. The solution was dropped onto a copper grid covered by a carbon film.
2.5. X-Ray Photoelectron Spectroscopy (XPS) Analysis
The surface of the S5 sample was examined utilizing a conventional X-ray photoelectron spectrometer (PHI 5000 VersaProbe, ULVAC-PHI). A monochromatic Al Kα source (1,486.6 eV) was employed, and Ar+ was utilized for gradual surface etching at a rate of 0.5 nm s−1, determined via testing on SiO2. The instrument utilized an anode operating at 24.5 W and 15 kV, featuring a beam spot size of 100 μm × 100 μm. The experiment was carried out under a base pressure of 2 × 10⁻⁷ Pa, ensuring minimal impurity gas presence within the chamber. Initially, the surface underwent a 20-s etching process for cleaning, removing approximately 10 nm of surface oxide. Following cleaning, a survey spectrum was acquired, followed by a depth profiling measurement.
2.6. Thermogravimetric Analysis
Thermogravimetric analysis (TGA) was performed (TG 209 F1 Iris, Netzsch). The TGA analysis was carried out at a heating rate of 10°C min−1 with an Ar (99.9999% purity) flow rate of 20 cm3 min−1. The sample was heated from RT to 700°C. To analyze the phases at different temperatures, an interrupted TGA measurement of the S5 and S6 samples was also carried out at 400, 500, and 550°C.
3. Results
3.1. Characterization of As-Synthesized α-(Ti, Al)[O]
Figure 1 shows a partial ternary phase diagram of Ti–Al–O [13]. Different compositions prepared are indicated in the α-(Ti, Al)[O] region. The compositions chosen are 3.4 at% oxygen (Ti0.866Al0.101O0.034 (S1) and Ti0.911Al0.055O0.034 (S2)), 10 at% oxygen (Ti0.841Al0.059O0.100 (S3) and Ti0.884Al0.016O0.100 (S4)), and 20 at% oxygen (Ti0.767Al0.033O0.200 (S5), Ti0.790Al0.010O0.200 (S6), and Ti0.8O0.2 (S7)).
To analyze the structure of the as-synthesized samples, all seven samples (S1 to S7) were subjected to XRD measurements, and the obtained XRD profiles were analyzed using the Rietveld refinement method. Figure 2 displays the observed profiles (Iobs) and calculated profiles (Ical) from the Rietveld refinement along with their differences (Iobs−Ical) for the as-synthesized samples. Table S2 summarizes the lattice parameters, R values, and goodness of fit from the Rietveld refinement. For all the samples, a single-phase α-(Ti, Al)[O] with a hexagonal crystal structure (space group P63/mmc) was identified as predicted in the phase diagram in Figure 1. It is noteworthy to mention the variation in intensity ratios observed in S1 and S2, specifically the heightened (002) peak and diminished (101) peak, which could be attributed to differing mechanical properties stemming from variations in oxygen content. Samples ranging from S3 to S7, having higher oxygen content (10 and 20 at%), were very brittle, allowing for easy manual grinding into fine powder. Consequently, these samples demonstrated a desirable statistical distribution across all plane directions. Conversely, S1 and S2, containing 3.4 at% O, were tough, rendering them difficult to grind finely for XRD observation, potentially leading to the observed texture or preferred orientation.
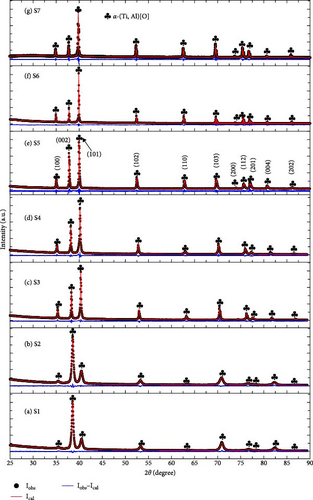
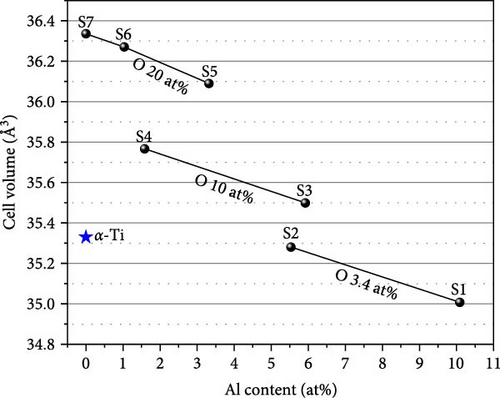
Figure 3 presents the cell volume of the α-(Ti, Al)[O] phase as a function of Al content. The cell volumes obtained from the S3 to S7 samples were found to be larger than the 35.33 Å3 of pure α-Ti [27]. However, the cell volumes of S1 and S2 are smaller than that of α-Ti since the atomic radius of Al is smaller than that of Ti and Al substitution on the Ti site, reduces the cell volume. The increase in the cell volume with increasing oxygen content indicates oxygen incorporation in the interstitial sites of the Ti lattice.
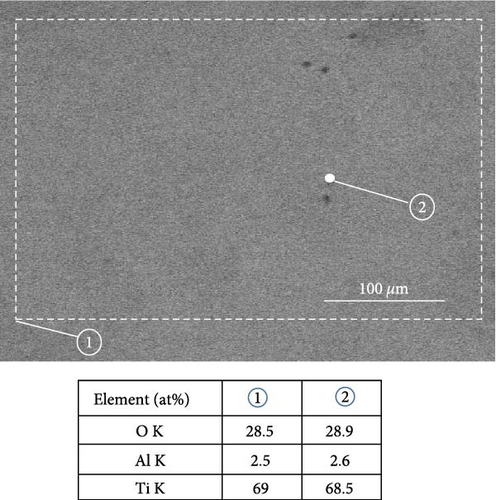
The surface morphology and chemical composition of all the samples were characterized using SEM. In particular, secondary electron (SE) and backscattered electron (BSE) modes were used to investigate the homogeneity of phase formation and the compositional details of the as-synthesized samples. The microstructure of the as-synthesized samples in SE and BSE modes is shown in Figure S1. Figure 4(a) shows the microstructure in the BSE mode and EDS point and area analysis results of S5 as a representative case. There is little difference in the contrast in the SEM–BSE micrograph, and the EDS point and area results are quite similar, confirming the compositional homogeneity of the sample. In addition, XPS depth profile composition analysis of S5 was conducted, as depicted in Figure 4(b), with the supplementary survey spectrum shown in Figure S2.
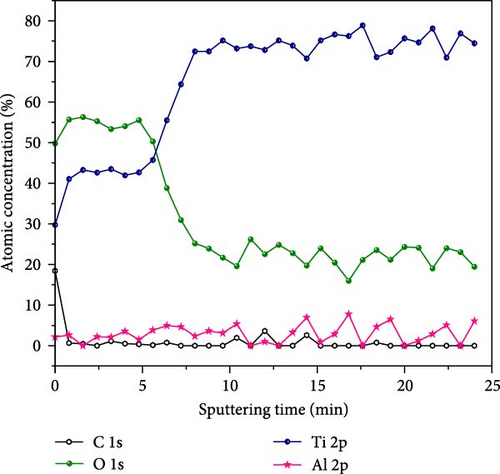
Notably, the XPS analysis of sample S5 confirms the presence of Ti, Al, and O elements, evidenced by Ti 2p, O 1s, and Al 2p peaks on the surface. The atomic concentration profiles in Figure 4(b) clearly demonstrate a surface oxide layer (approximately 300 nm depth), which contains nearly 50 at% O and a bulk region with nearly 20 at% O. Conversely, the atomic concentration of Ti increases significantly from the surface (approximately 30 at%) to the bulk region, reaching close to the designed composition of 76.7 at%. Notably, a discernible concentration of Al (approximately 3 at%) was observed. Thus, the XPS depth profile composition measurements of S5 provide another evidence for the designed composition of Ti0.767Al0.033O0.200.
To compare the composition of the as-synthesized sample to the designed composition, EDS analysis was performed, and the results are shown in Table 1. Overall, the oxygen content in the EDS analysis is much higher than that of the designed composition. The surface is likely to contain more oxygen due to surface oxidation, and SEM–EDS is not optimal for accurately detecting light elements (e.g., O and N) [28]. On comparing the composition without considering oxygen, the as-synthesized compositions match well with the designed compositions.
| S. No. | Composition | Ti | Al | O | Composition (excluding O) | Ti | Al |
|---|---|---|---|---|---|---|---|
| S1 | Ti0.866Al0.101O0.034 | 78.1 | 8.3 | 13.6 | Ti0.896Al0.104 | 90.4 | 9.6 |
| S2 | Ti0.911Al0.055O0.034 | 80.4 | 4.6 | 15.0 | Ti0.942Al0.058 | 94.6 | 5.4 |
| S3 | Ti0.841Al0.059O0.100 | 77.5 | 4.6 | 17.9 | Ti0.934Al0.066 | 94.4 | 5.6 |
| S4 | Ti0.884Al0.016O0.100 | 80.5 | 1.4 | 18.1 | Ti0.982Al0.018 | 98.3 | 1.7 |
| S5 | Ti0.767Al0.033O0.200 | 69.0 | 2.5 | 28.5 | Ti0.959Al0.041 | 96.5 | 3.5 |
| S6 | Ti0.790Al0.010O0.200 | 66.4 | 0.7 | 32.9 | Ti0.988Al0.012 | 99.0 | 1.0 |
| S7 | Ti0.8O0.2 | 69.4 | 0 | 30.6 | Ti | 100 | 0 |
- Ti and Al contents excluding oxygen are presented in the last two columns.
3.2. Hydrogen Sorption Properties of α-(Ti, Al)[O]
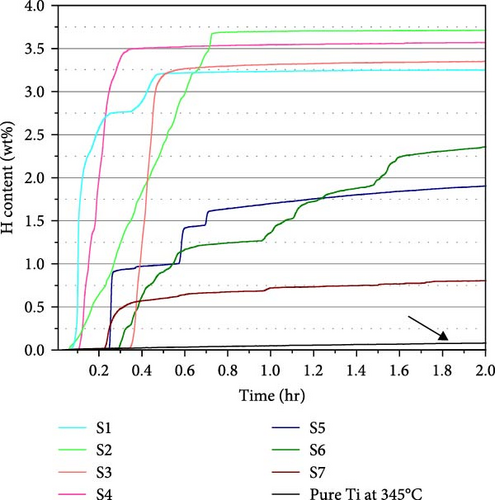
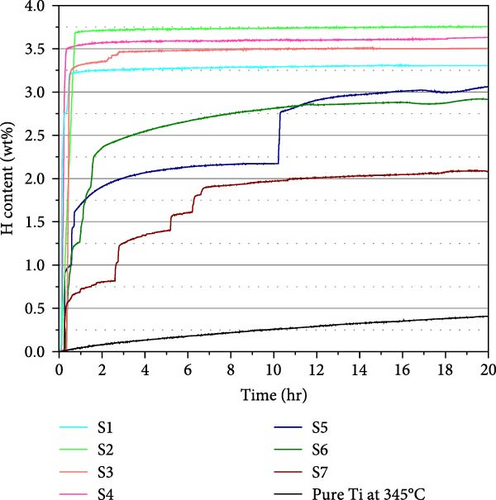
To examine the hydrogen sorption properties, all the samples were activated under 5 MPa H2 pressure at 300°C. The activation profiles for 2 and 20 hr are shown in Figures 5(a) and 5(b), respectively. Focusing on the initiation of hydrogen absorption, samples with a smaller oxygen content display a shorter incubation time. There is no significant difference in absorption kinetics up to 10 at% O, but rather slow stepwise absorption was observed for the samples with 20 at% O, and it took a longer time to reach the saturation point. Importantly, all the samples display much faster kinetics compared to pure Ti.
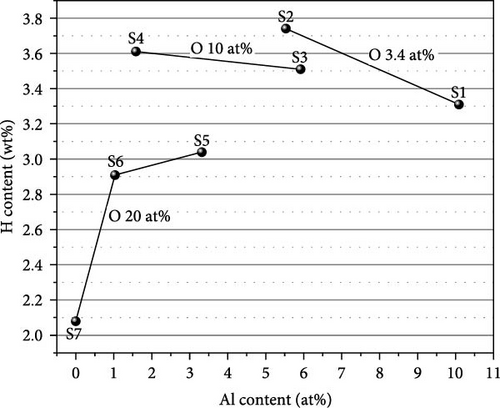
The hydrogen absorption capacities are all below the ideal capacity for the conversion of Ti to TiH2, which is 4.2 wt%. We illustrate the H content as a function of Al and O content in Figure 6. The highest H content observed is 3.74 wt% for S2, and the lowest H content observed is 2.08 wt% for S7. Increasing the Al content decreases the H content, as seen from the H content of the samples having the same oxygen content (S2 > S1 and S4 > S3). Since Al is a nonhydride-forming element, its presence seems to increase the energy of hydrogen incorporation, thereby reducing the capacity. However, the samples with 20 at% O exhibit a different trend. The measured H content follows the sequence of S5 > S6 > S7, while S7 > S6 > S5 is expected from their Al content. We will elaborate this point based on the phase analysis. Similar to Al, oxygen also decreases the H content. The samples with the highest O content (S5 to S7) show lower H content than S1 to S4, and S2 shows higher H content than S3 with similar Al content. Oxygen occupies the octahedral interstitial sites in the α-Ti[O] structure [29] and competes with H for interstitial sites. The occupation of oxygen may also suppress the occupation of hydrogen at nearby tetrahedral interstitial sites. This is why a higher O content results in a smaller H content.
To understand the hydrogen capacity change in Figure 6, XRD measurements were performed for the activated samples, and the phases were analyzed using the Rietveld refinement method. The results are shown in Figure 7. The Rietveld refinement results for the different composition of activated samples (S1 to S7) are summarized in Table S3.
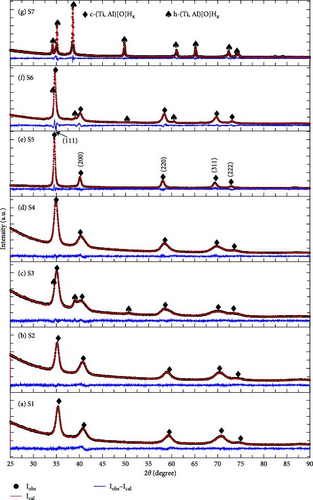
In the XRD profiles, two phases were observed: cubic c-(Ti, Al)[O]Hx (space group Fm-3m) and hexagonal h-(Ti, Al)[O]Hx (space Group P63/mmc). For the S1 to S6 samples, the phase transforms from hexagonal α-(Ti, Al)[O] to c-(Ti, Al)[O]Hx after activation. Interestingly, the S7 sample does not transform to c-(Ti, Al)[O]Hx and retains its original hexagonal structure, showing h-(Ti, Al)[O]Hx. The only change from α-(Ti, Al)[O] to h-(Ti, Al)[O]Hx is lattice expansion due to hydrogen insertion. In the cases of S3 and S6, the transformation to c-(Ti, Al)[O]Hx is not complete, and some parts of the hydride phases remain as h-(Ti, Al)[O]Hx (14.7 wt% for S3 and 5.1 wt% for S6, refer to Table S3). From the phase analysis of the activated samples, the anomaly of the hydrogen storage capacity for S5–S7 can be explained. The transformation into c-(Ti, Al)[O]Hx appears to enhance the hydrogen storage capacity. If the activated S7 had a cubic structure, it would have shown a higher capacity than S5.
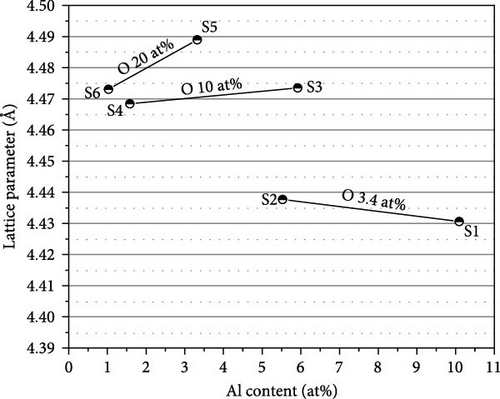
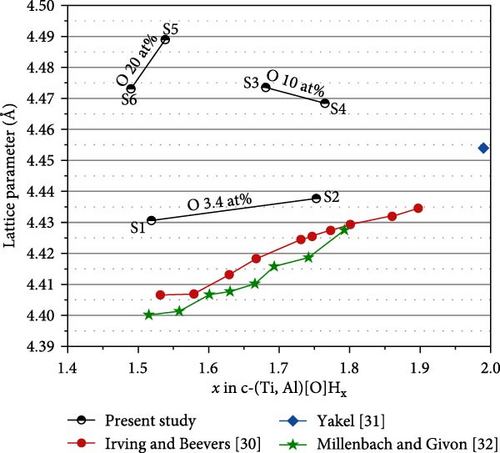
In the XRD profiles, we did not observe any Al or Al2O3, which could be the product of disproportionation [17]. This result indicates that the composition of α-(Ti, Al)[O] is maintained even after the phase transformation into c-(Ti, Al)[O]Hx. Figure 8(a) depicts the variation in the lattice parameter of c-(Ti, Al)[O]Hx as a function of Al content in the alloy. Similar to the cell volumes in Figure 3, the lattice parameters of the samples with higher O content are larger, indicating that oxygen remains in the structure after hydrogenation. However, the trend of the lattice parameter change with Al and O content is not as clear as in Figure 3. This is because the H content is also a function of the Al and O contents, which in turn changes the lattice parameter. To adequately consider the effect of H content on the lattice parameter, we calculate x of c-(Ti, Al)[O]Hx using the saturated H content in Figure 6. The data are plotted in Figure 8(b) as a function of H content x and are compared with the lattice parameters of cubic c-TiHx from the studies of Irving and Beevers [30], Yakel [31], and Millenbach and Givon [32]. Overall, the lattice parameters of c-(Ti, Al)[O]Hx in the present study lie above the data points of TiHx for the same x values, indicating lattice expansion due to oxygen incorporation. We note that the lattice parameter of S3 should be smaller than that of S4 considering the higher Al and the lower H content in S3, but it appears larger than that of S4. In the case of S3, the proportion of remaining h-(Ti, Al)[O]Hx is relatively high (~15 wt%), and h-(Ti, Al)[O]Hx tends to have a smaller H content than c-(Ti, Al)[O]Hx, as in the case of S7, which results in the underestimation of x in S3 since we neglected the presence of h-(Ti, Al)[O]Hx.
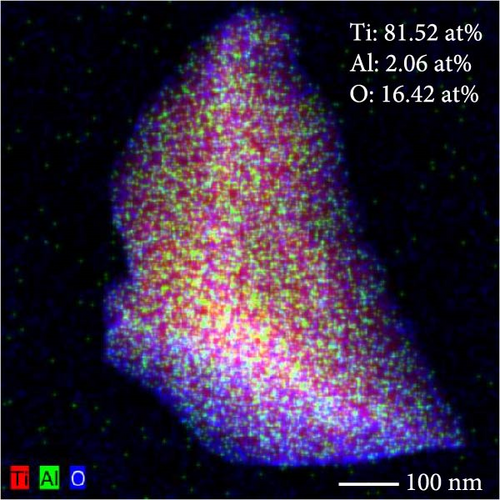
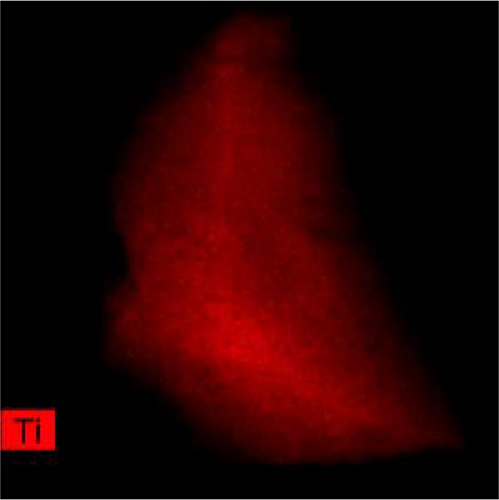
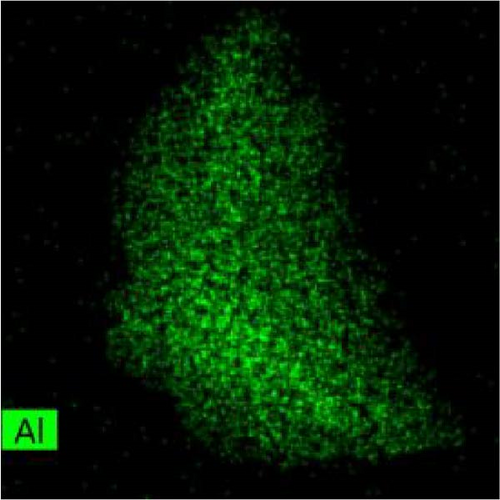
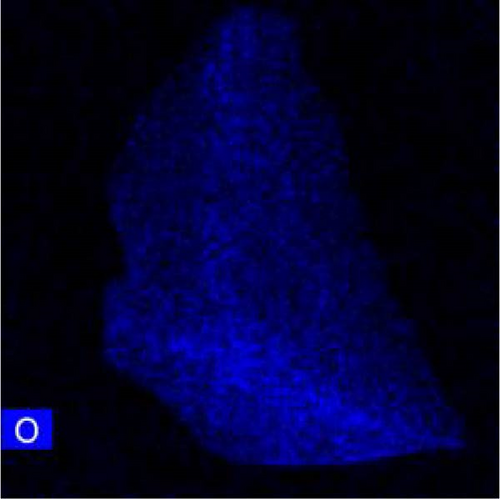
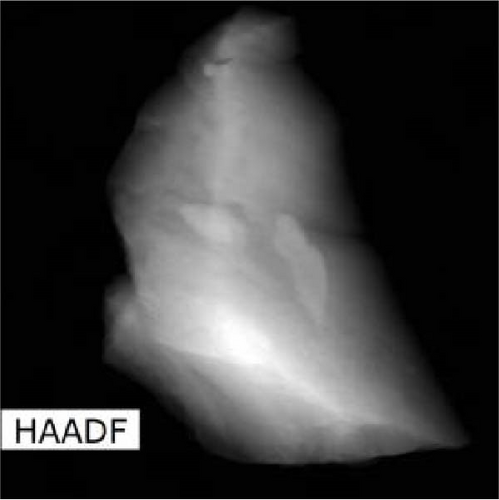
The lattice parameter analysis qualitatively supports the presence of oxygen inside the crystal structure of c-(Ti, Al)[O]Hx. However, the presence of Al is uncertain from the lattice parameter analysis. To directly observe the distribution of Al and O after activation, TEM and STEM–EDS analyses were performed for the activated S5 sample. STEM–EDS can be used to analyze the distribution of Ti, Al, and O over the surface of a particle. Figure 9 shows the STEM image obtained with a HAADF detector and EDS chemical maps of an S5 particle after activation (hydrogenation). Figure 9(a) shows that Ti, Al, and O are homogenously distributed in the hydrogenated state, implying that disproportionation to TiH2 did not occur. In other words, Al and O exist within the crystal structure without being separated to form Al and/or Al2O3. STEM–EDS images of the same particle at higher magnifications were also acquired to ensure that Al and O were uniformly distributed, and these images are provided in Figure S3. To further verify whether phase separation occurs after hydrogenation, selected area electron diffraction (SAED) patterns of S5 particles were obtained, as illustrated in Figure S4. None of the diffraction patterns correspond to those of rhombohedral Al2O3. Indeed, the patterns in Figure S4 are indexed as (111), (220), (111), (020), (311), and (111) of cubic TiH2 (space group Fm-3m) [30]. Based on these diffraction patterns, the lattice parameter of the particles was roughly estimated, and all four of them yielded the same value of 4.43 Å (Table S4), which is close to 4.49 Å from the XRD data of c-(Ti,Al)[O]Hx and different from that of pure Al, 4.05 Å [33].
3.3. Hydrogenation Pathway
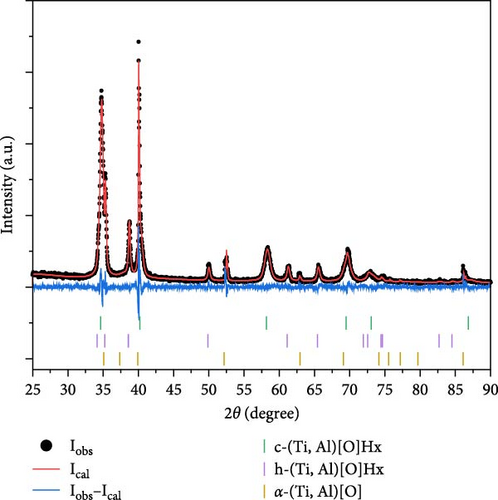
To analyze the phases present at different stages during the activation in Figure 5, XRD measurements were performed for the partially activated, that is, interrupted at H content of ~2 wt%, S5 and S6 samples. We selected S5 and S6 samples for detailed analysis due to their distinct stepwise hydrogen absorption patterns over a long period of time, as depicted in Figure 5. This characteristic allowed us to intervene during an intermediate stage of hydrogen absorption. In contrast, samples S1–S4 exhibited rapid hydrogenation within an hour, indicating a swift phase transition from α-(Ti, Al)[O] to c-(Ti, Al)[O]Hx. The phase analysis results are presented in Figure 10 and Table 2. Three different phases were found in S5: c-(Ti,Al)[O]Hx, h-(Ti,Al)[O]Hx, and α-(Ti, Al)[O] with weight percentages of 67.0(11), 22.9(9), and 10.1(6), respectively. In S6, only two phases were present: c-(Ti, Al)[O]Hx and h-(Ti,Al)[O]Hx with weight percentages of 53.4(7) and 46.6(7), respectively. Based on the phase analysis, hydrogen absorption into the α-(Ti, Al)[O] phase first triggers the transformation into h-(Ti, Al)[O]Hx, which only requires lattice expansion, and then further hydrogen absorption is achieved through the transformation into c-(Ti, Al)[O]Hx. In S5, unhydrogenated α-(Ti, Al)[O] still remains, which is not observed in S6, implying that the transformation into h-(Ti, Al)[O]Hx is faster in S6. In contrast, a higher proportion of c-(Ti, Al)[O]Hx in S5 indicates faster transformation into c-(Ti, Al)[O]Hx in S5 compared to S6. This is in line with the observation of remaining h-(Ti, Al)[O]Hx in S6 after activation, as shown in Figure 7(f), while activated S5 is composed of 100% c-(Ti, Al)[O]Hx, as shown in Figure 7(e). Rather slow transformation into c-(Ti, Al)[O]Hx (kinetically and/or thermodynamically) results in a lower hydrogen capacity in S6 compared to S5.
| S. No. | Phases | wt (%) | Lattice parameters (Å) | R values |
|---|---|---|---|---|
| S5 |
|
|
|
|
| S6 |
|
|
|
|

3.4. Dehydrogenation Pathway
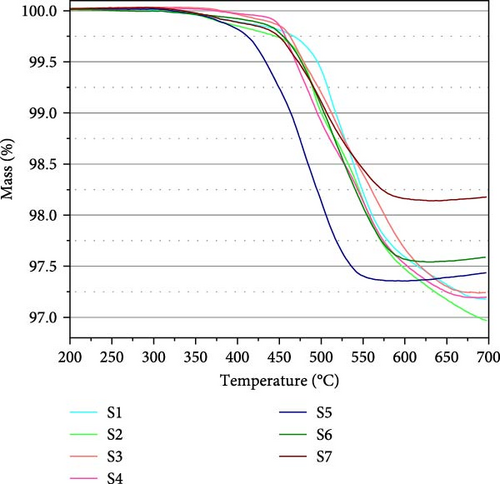
To investigate the dehydrogenation pathway, TGA profiles of the activated samples were obtained and are shown in Figure 11. Among all the samples, S5 shows the lowest onset and finish dehydrogenation temperatures. For the other samples, the major mass loss due to hydrogen release occurs at approximately 500°C. In general, samples with a higher O content show a lower finish temperature. For S5– S7, mass loss is completed around (or below) 600°C; for S3 and S4, this temperature is raised to ~680°C; and for S1 and S2, dehydrogenation is not complete up to 700°C. Therefore, we can detect a weak destabilization effect of oxygen; the effect of aluminum is not very clear. In the case of TiH2, desorption starts at 500°C and requires higher temperatures above 700°C to completely desorb the hydrogen [34].
To analyze the structural information, XRD was performed after TGA measurements. The XRD profiles and the Rietveld refinement results are given in Figure S5 and Table S5, respectively. All the samples after TGA displayed single-phase h-(Ti, Al)[O]Hx. In many of the samples, the lattice parameters of the samples after TGA were found to be larger than those of the as-synthesized samples; this is why we call the phase h-(Ti, Al)[O]Hx instead of α-(Ti, Al)[O].
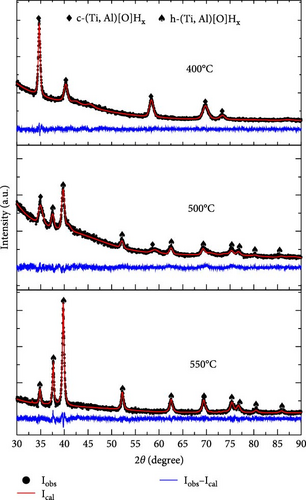
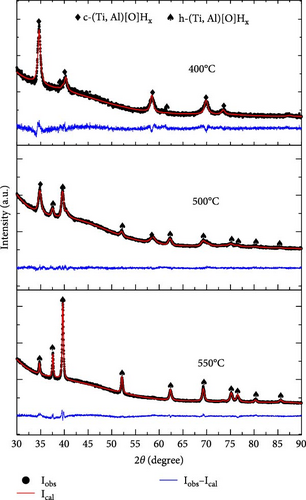
To elucidate the dehydrogenation pathway of S5 and S6, TGA was interrupted at 400, 500, and 550°C, and XRD phase analysis was performed. Once more, we opted to analyze the S5 and S6 samples in detail, primarily because of S5’s lowest hydrogen desorption temperature as indicated in the TGA data (Figure 11). For comparison purposes, we selected S6, which shares the same oxygen content as S5. The XRD profiles and the Rietveld refinement results are summarized in Figure 12 and Table S6, respectively. The activated S5 sample (Figure 12(a)) dehydrogenated up to 400°C was still pure c-(Ti, Al)[O]Hx, but its lattice parameter was smaller than that of the activated sample. When dehydrogenated to 500°C, a large proportion of the sample (62 wt%) was converted to h-(Ti, Al)[O]Hx; the remaining c-(Ti, Al)[O]Hx had an even a smaller lattice parameter. At 550°C, the dehydrogenated S5 was completely transformed into h-(Ti, Al)[O]Hx. The lattice parameters of h-(Ti, Al)[O]Hx at 550°C (Table S6) are larger than those of h-(Ti, Al)[O]Hx at 700°C (Table S5). The activated S6 sample (Figure 12(b)) underwent a similar dehydrogenation pathway as in S5: a decrease in the lattice parameter of c-(Ti, Al)[O]Hx and partial and then complete transformation into h-(Ti, Al)[O]Hx. The only difference is a slower transition into h-(Ti, Al)[O]Hx: 62 wt% of S5 was h-(Ti, Al)[O]Hx at 500°C, while it was 43.7 wt% in S6; this is in accord with the slower dehydrogenation of S6 compared to S5, as shown in the TGA profiles in Figure 11.
4. Discussion
- (1)
The activation of α-(Ti, Al)[O] was performed at 300°C and 5 MPa H2 pressure. Under the same conditions, the activation kinetics of α-Ti are much slower, which indicates that a small amount of Al or O can be alloyed to Ti to improve its hydrogenation kinetics.
- (2)
The hydrogen storage capacities for various α-(Ti, Al)[O] compositions generally decrease with increasing Al and O in the alloy. However, for the samples with 20 at% O (S5 to S7), the hydrogen capacity increases with increasing Al content. This counterintuitive behavior is related to the phase transformation: activated S5 completely transforms into c-(Ti, Al)[O]Hx, while a small amount of h-(Ti, Al)[O]Hx is found in S6, and S7 remains pure h-(Ti, Al)[O]Hx after activation. The notable decrease in the hydrogen capacity in S7 is related to the suppressed phase transformation: the formation of the cubic phase increases the hydrogen absorption capacity. A small amount of Al may expedite, kinetically and/or thermodynamically, the phase transformation from h-(Ti, Al)[O]Hx to c-(Ti, Al)[O]Hx at 300°C and 5 MPa H2 pressure, thereby increasing the hydrogen storage capacity.
- (3)
The S5 sample with 20 at% O released hydrogen at the lowest temperature, as shown in Figure 11. The lower dehydrogenation temperature of S5 compared to that of S6 can be attributed to the higher Al content in the alloy and associated destabilization. However, the reason is not straightforward since no systematic change in the dehydrogenation temperature as a function of Al content was found for other samples. This result promises stability control of Ti using Al and O, but due to the limitation of solubility of Al and O in α-(Ti, Al)[O], significant destabilization of Ti might not be achievable.
- (4)
Different from HIA or disproportionation often reported for Ti3Al, α-(Ti, Al)[O] did not show any sign of composition change or phase separation after hydrogenation. This is partly due to the relatively smaller amount of Al and partly due to the increased stability of α-(Ti, Al)[O] with the addition of oxygen. Therefore, α-(Ti, Al)[O] can reversibly store hydrogen while maintaining the original composition.
5. Conclusions
In the present study, we characterized the hydrogen sorption properties of α-(Ti, Al)[O]. In general, Al and O addition increases the kinetics of hydrogen absorption but decreases the hydrogen storage capacity. We found that the crystal structure of the hydride phase is a crucial factor determining the hydrogen storage capacity. In the absorption process, α-(Ti, Al)[O] first transforms into h-(Ti, Al)[O]Hx and then transforms into c-(Ti, Al)[O]Hx with a higher hydrogen content. The Al and O content in α-(Ti, Al)[O] affects such transformation kinetically and/or thermodynamically. When the transition into c-(Ti, Al)[O]Hx is suppressed, the hydrogen absorption capacity becomes low. Most importantly, Al and O remain in the c-(Ti, Al)[O]Hx structure after hydrogenation without showing any evidence of disproportionation. This result implies that the change in hydrogen sorption properties induced by Al and O will be maintained even after repetitive cycling. Samples with higher O content released hydrogen at lower temperature, proving a destabilization effect of oxygen. Although the limited solubility of Al and O in α-(Ti, Al)[O] does not allow a significant destabilization effect, meaningful changes in the hydrogen absorption kinetics and phase stability of α-(Ti, Al)[O] promise tailoring the characteristics of Ti using Al and O.
Conflicts of Interest
The authors declare that there is no conflict of interest regarding the publication of this article
Acknowledgments
This research was supported by the Korea Institute of Science and Technology (grant number 2E33262) and National Research Foundation of Korea (grant number NRF-2020M1A2A2080881).
Open Research
Data Availability
The data used to support the findings of this study are included within the article and the Supplementary Materials.


