Who Leads Trends on Q&A Platforms? Identifying and Analyzing Trend Discoverers
Abstract
Q&A platforms are vital sources of information but often face challenges related to their high ratios of passive to active contributors, which can impede knowledge construction and information exchange on the platforms. This study introduced a novel method for identifying trend discoverers, key users who can detect and initiate discussions on emerging question trends, through response order analysis of data from Zhihu and Stack Overflow. This study underscores the significant role of trend discoverers in influencing question popularity. Trend discoverers not only exhibit higher engagement in knowledge-sharing activities but also participate in discussions across a broader range of topics compared to regular users. The insights derived from this research have crucial implications for improving the development and functionality of Q&A platforms.
1. Introduction
Knowledge dissemination involves spontaneous communication, negotiation, and consensus among users [1]. However, user participation in online communities generally exhibits the following pattern: 90% of users contribute minimally, 9% contribute occasionally, and 1% contribute regularly [2]. This indicates that users of Q&A (question and answer) platforms are generally more passive than active. A substantial number of users tend to prefer “browsing without specific intent” [3].
On Q&A platforms, the number of answers to questions serves as an indicator of both the depth of knowledge dissemination and question popularity. This popularity is influenced by several characteristics [4–8] as well as by the attributes of knowledge contributors. Research into online communities has tended to focus on users with effective communication and leadership skills for the reason that these key users of Q&A platforms must be able to foster discussion and facilitate dialog. The present study posits that the key users of Q&A platforms are those who are trend discoverers, that is, those who can identify future trends and lead discussions. The answering behavior of trend discoverers enhances participation in knowledge-sharing activities and fosters dialog among users. By observing trend discoverers, regular users can identify and participate in trending discussions, and Q&A platform operators can promote questions with high discussion potential, which can increase users’ willingness to participate and contribute to knowledge sharing.
The present study proposes a method for identifying trend discoverers on Q&A platforms and examines the relationship between trend discoverer participation behavior and question popularity. In addition, we investigate the differences between trend discoverers and regular users. This study enhances the understanding of the characteristics of trend discoverers and provides guidance for Q&A platforms to improve user engagement and promote knowledge dissemination.
2. Literature Review
2.1. Key Users in Social Media
Social media research has often focused on opinion leaders. Opinion leaders are perceived to be experts by their followers and may have personal relationships and shared experiences with their followers. Opinion leaders use social pressure and support to influence the opinions of their followers [9]. Opinion leaders have professional knowledge and are politically influential [10, 11]. As social media platforms have developed, the commercial value of opinion leaders has increased [12, 13]. Social media influencers positively affect follower attitudes and purchase intentions [13–15], and the concept of opinion leaders has broadened.
However, users who can foster discussions are more valuable than those labeled as opinion leaders on Q&A platforms. Trend discoverers should also be identified. In a commercial context, trend discoverers can be considered leader users [16] who can anticipate needs that will become common; trend discoverers are “ahead of the trend” [17]. A study described trend discoverers as users who significantly outperform others in the rate at which they discover trends [18]. Trend discoverers often purchase items long before the items have become popular.
- •
RQ1: Do Q&A platforms have trend discoverers who lead trends of answering questions?
Trend discoverers can be classified as preinflection point (PIP) trend discoverers or early trend discoverers. PIP trend discoverers tend to respond to questions that have not yet surged in popularity. The participation of PIP trend discoverers can lead to an increase in answers because PIP trend discoverers may inspire others to engage in discussions through their influence or trend discoverers may be more sensitive than regular users are to external factors. External factors, such as the eruption of certain public events or the implementation of specific policies or regulations, can lead to increased discussion surrounding a question.
The concept of early trend discoverers on shopping platforms refers to a unique group of users who excel at predicting future sale trends, as identified in the previous research [18]. The relationship between consumers and commodities is similar to that between users and questions on Q&A platforms. Accordingly, a specific group of users with the ability to discover trends on Q&A platforms can be identified as early trend discoverers. Early trend discoverers are able to effectively predict the popularity of questions. Understanding the behaviors of trend discoverers can provide valuable insights for predicting and influencing public sentiment [19].
2.2. Identification of Key Users
- 1.
PageRank models: Zhong, Song, and Sun [21] combined the PageRank algorithm with the TF-IDF (term frequency-inverse document frequency) values of text to develop the LeaderRank method, which can be used to calculate node connectivity and identify influential users.
- 2.
Network centrality models: Wang et al. [22] assessed user propagation ability from the perspective of structural holes and introduced the V-constraint metric to identify key users on Q&A platforms. Another study used clustering coefficient, network density, average path length, network diameter, spanning tree, mean, median, mode, centrality, eigenvector, cohesive subgraphs, and many other parameters to assess user propagation ability [23].
- 3.
Information diffusion analysis models: Malang et al. [24] conducted a comparative study of six key node identification methods within global terrorism networks and validated these methods using the SIR model and monotonic indices.
- 4.
Machine learning models. Machine learning classification techniques and regression techniques can be used to identify influential users. Zhou et al. [25] developed an algorithm that combines statistical features with topic activities to identify influential users of microblogs.
- 5.
Semantic and qualitative feature–based models: These models consider user quality and semantic features of content to measure or rank influence [26, 27].
- •
RQ2: How can trend discoverers be identified through straightforward and efficient methods that rely on minimal information?
2.3. User Characteristic Analysis
The following characteristics may be used to categorize key users of online communities.
2.3.1. Personal Information
User personal information encompasses both self-reported profile details, such as nicknames, gender, location, age, and educational background, and platform-defined attributes, such as whether a user’s identity has been authenticated [29, 30]. Research indicates that verified users who have provided detailed profile information are more likely to emerge as opinion leaders [31]. Rogers’ theory of innovation diffusion identifies the following key traits of innovators: youth, higher education, social prestige, higher income, extensive information networks, a cosmopolitan outlook, leadership qualities, and a tendency to be perceived as an outlier by peers [32].
2.3.2. Social Relationships
Social relationships can be assessed using the number of followers and followings. The number of followers, in particular, is a key indicator of a user’s influence [33]. In addition, the information flow network among users can be constructed using followings and posts, enabling the use of network structural metrics, such as user centrality, and structural hole metrics for the measurement of user importance [22, 34].
2.3.3. Behavioral Characteristics
Users’ knowledge contribution behavior on Q&A platforms can be assessed on the basis of the volume of answers and questions they post [35]. Research has often considered answering questions as a form of knowledge contribution but has often overlooked the importance of asking questions. Responding to and asking questions are both essential activities on Q&A platforms, as they engage users in knowledge production and contribute to the platform’s growth from a systematic perspective [36]. Zhao, Wang, and Cai [37] analyzed users in the travel section of the Zhihu platform and discovered that opinion leaders contributed significantly more through knowledge sharing than through asking questions, indicating that knowledge sharing is a core activity for opinion leaders.
2.3.4. User Influence
Many studies use metrics such as the number of posts and likes to measure user influence [38]. On Q&A platforms, the number of likes and upvotes received for answers are crucial indicators for gauging user recognition and influence [36].
2.3.5. Content Characteristics
Opinion leaders on social platforms are often professionals or individuals with expertise or extensive experience in certain fields. Therefore, research on opinion leaders often evaluates user importance on the basis of the features of their answer content, with such features evaluated to assess the quality of answers. Examples of content features are post length, inclusion of external links, incorporation of rich media such as images and videos, and emotional intensity [31].
- •
RQ3: What are the characteristics of trend discoverers, and how do trend discoverers differ from regular users?
3. Method
3.1. Data
This study uses data from two online Q&A platforms: Zhihu and Stack Overflow. Both platforms have large volumes of questions, answers, and users. Zhihu launched in December 2010 and is one of the largest online Q&A communities in China. Stack Overflow is a platform on which users exchange knowledge about programming and software engineering.
In this study, a training set is established and used to identify trend discoverers, and a test set is established that is used to evaluate the correlation between trend discoverers and question popularity. Question popularity is measured using the number of answers, which reflects the number of users participating in the knowledge diffusion process [39].
A dataset comprising 1,520,254 questions and 50,156,494 answers posted between 2011 and 2018 on the Zhihu platform is established. The dataset includes information such as question ID, question time, answer ID, answer time, and answerer ID. Of the questions, 1,200,000 are categorized into a training set, and the rest are categorized into a test set on the basis of question time. Five percent of the questions in the training set (n = 60,000) are classified as popular questions on the basis of the number of answers they received. The details are provided in Table 1.
| Zhihu | Stack Overflow | |
|---|---|---|
| Data coverage period | 2011.1.1–2018.12.31 | 2008.8.31–2021.7.31 |
| Total number of questions | 1,520,254 | 21,246,396 |
| Number of questions in the training set | 1,200,000 | 15,000,000 |
| Number of most popular questions | 60,000 | 9000 |
| Total answers for all popular questions | 45,455,951 | 254,831 |
| Number of answers per single question | ||
| Max | 129,399 | 518 |
| Min | 98 | 20 |
Another dataset comprising 21,246,396 questions posted between 2008 and 2021 on Stack Overflow is obtained from the Internet Archive1. Most questions on Stack Overflow have definite answers and are resolved within two or three responses. For example, “How do you draw a bar graph in Python?” or “How do you pass parameters to a query in SQL (Excel)?” Only complex questions (i.e., those that have diverse solutions or that are open-ended) garner more than two or three responses. Examples of complex questions are “How do you calculate the emotion of a section of text?” and “What is the best comment in source code that you have ever encountered?” The threshold of the number of answers for identifying high-popularity questions depends on the platform’s characteristics.
The first 15,000,000 questions, sorted by creation time, are selected as the training set, and the remaining questions are used as the test set. The 9000 most popular questions (i.e., those that received the most answers) in the training set are identified. These questions received 254,831 answers. The details are provided in Table 1.
3.2. Identification of Trend Discoverers
Trend discoverers are classified as PIP trend discoverers or early trend discoverers by using the following classification methods.
3.2.1. Identification of Early Trend Discoverers
The identification method developed by Medo et al. [18] is adopted. The specific operations of this method are as follows.
The null hypothesis (H0) of this study is that each user has the same ability to discover trends. The first N users to respond to a popular question are considered to be trend discoverers. In this study, N is set to 5.
For each user i, the total number of answers is recorded as ki. The number of answers given by user i as one of the first N respondents to a popular question is recorded as di. For the 60,000 high-popularity questions in the training set, the total number of trend discoveries is recorded as D (D = ∑idi), and the total number of answers is recorded as L (L = ∑iki).
To quantify the extent to which the behavior of user i is incompatible with the null hypothesis, this study calculates the average maximum sampling self-information by using a bootstrap method. We iteratively selected 100 users and calculated their Ii. The maximum Iimax value was recorded for each iteration. After 10,000 iterations were performed using the bootstrap method, a mean Iimax value, Iimean , was calculated. Each user i with an Ii greater than Iimean is considered a trend discoverer.
3.2.2. Identification of PIP Trend Discoverers
Answers to questions on Q&A platforms are not evenly distributed over time. Questions can experience bursts of activity, where the number of answers suddenly increases after a long period of inactivity. This study identifies users who responded to questions before the questions experienced sudden bursts of activity (i.e., PIP trend discoverers).
3.2.2.1. Step 1: Identifying Peak Points
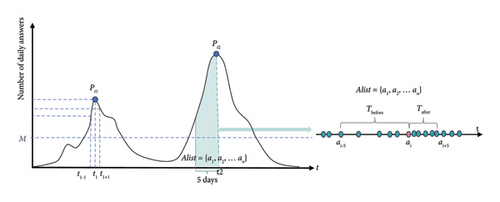
To identify PIP trend discoverers, we first identify popular questions, with each question corresponding to a daily number of answers’ sequence, recorded as AnsNumList. As illustrated in Figure 1, a threshold value M is determined for each question. If the number of answers Pt at time t is greater than M, and also greater than both Pt−1 and Pt+1, then Pt is considered a peak point.
3.2.2.2. Step 2: Calculating the Time Difference for Answers
3.2.2.3. Time Conversion Method
The peak times for mobile Internet usage are the night-time leisure period (19:00–22:00) and the afternoon period (14:00–17:00) [40]. Therefore, the absolute time difference between answers may not accurately reflect an increase in response speed. This study uses the relative time to calculate Diff(ai). Relative time is adjusted in accordance with the distribution of user time online on the two platforms. The detailed information regarding the method used to adjust the time is provided in S1 of the Supporting Information section.
3.2.3. Features’ Analysis of Trend Discoverers
- 1.
Personal information is analyzed with consideration of gender, authentication status, membership status, and the degree of self-representation. The degree of self-representation is calculated on a scale of 0–3 and includes optional information such as location, educational attainment, and occupation, as presented on user profiles. We sum the number of information items provided by each user. A score of 0 indicates that the user did not display any personal information regarding location, educational attainment, or occupation, and a score of three indicates that the user provided all of this information.
- 2.
Social relationships are measured using the number of followers a user has.
- 3.
Behavioral characteristics are assessed using four indicators: the number of questions asked, answers given, articles published by the user, and the number of favorites received on the user’s posts.
- 4.
User influence, which reflects how other users recognize and identify a specific user [36], is evaluated on the basis of the number of upvotes, likes, and bookmarks the user’s answers have received.
- 5.
Content features are measured using answer variety. A text variety analysis is performed to assess the range of topics or fields a user has addressed in their answers. Questions are typically assigned several tags (keywords and core concepts) by the individual who poses the question. Users whose answers span a broad range of tags with a relatively even distribution receive high text variety scores. Conversely, users who primarily respond to questions with specific tags related to a single field receive low text variety scores. Examples are provided in S2 of the Supporting Information section.
4. Results
4.1. Identification of Early Trend Discoverers
4.1.1. Early Trend Discoverers on Zhihu
In the training set, 9,442,972 users participated in answering the 60,000 most popular questions. The total opportunities for trend discovery, denoted as D, is the sum of individual opportunities, which is D = ∑idi = 300,000. The total number of answers, denoted as L, is the sum of individual answers, which is L = ∑iki = 45,455,951. The probability of trend discovery for a single question, denoted as PD(H0), is PD(H0) = D/L ≈ 0.0067. Bootstrap sampling reveals that Iimean≈ 3.6152. On the basis of Iimean, the estimated number of trend discoverers is 62,926, accounting for 0.67% of the users that participated in answering the 60,000 most popular questions.
As presented in Figure 2, the horizontal axis indicates the question sequence numbers, and the vertical axis represents the total number of answers per question, arranged in descending order of the number of answers. The height of the blue lines signifies the final number of answers a question received, whereas the height of the red lines indicates when a user responded to this question. A shorter red line suggests the user was among the first to answer the question after its creation. If the user was among the first five respondents, completing a trend discovery, a green “X” is marked at the top of the blue line. The section of the graph presented in the upper right corner of the figure is a magnified image of the graph, with the vertical axis limited to a maximum value of 500.
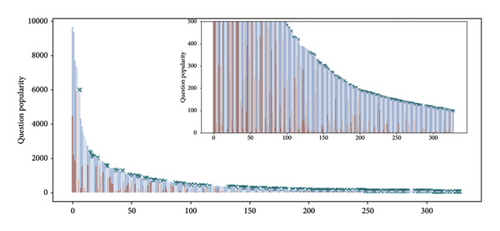
Figure 2 illustrates the participation pattern of the user with the highest Ii value (Ii = 341.56). This user responded to a total of 1206 questions, 300 of which were popular questions. Figures of early trend discoverers include numerous green markings, indicating they were among the first five to engage with multiple questions.
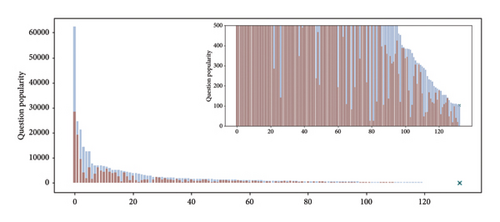
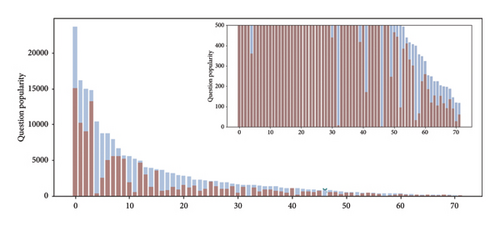
Two users with relatively high numbers of responses but with Ii values that are lower than Iimean are randomly selected. As presented in Figure 3, their participation patterns exhibit significant differences. The red lines for these regular users are high, indicating that although they answered many questions, they tended to respond later.
4.1.2. Early Trend Discoverers on Stack Overflow
This study sets f to 0.0006 and N = 3 in the training set and identifies the 0.06% most popular questions (n = 9000). These questions had a minimum of 20 answers each. The 9000 most popular questions had 254,831 answers, and for each question, the first 3 respondents are considered trend discoverers. The total opportunities for trend discovery, D = ∑idi = 27,000, and the total number of answers L = ∑iki = 24,974,906. The probability of trend discovery is calculated as PD(H0) = D/L ≈ 0.001. Bootstrap sampling reveals Iimean ≈ 4.37. On the basis of Iimean, the number of trend discoverers is estimated to be 13,273, indicating they account for 0.62% of the total participants in answering questions. More detailed information is provided in S3 in the Supporting Information section.
4.2. Identification of PIP Trend Discoverers
4.2.1. PIP Trend Discoverers on Zhihu
Figure 4 depicts the daily number of answers for each question. Each graph represents the answer data for a specific question, with the horizontal axis representing time in days (in the form of timestamps) and the vertical axis representing the daily number of answers. The blue line indicates the daily number of answers, and the red line represents the cumulative number of answers. The daily number of answer curves indicates that popular questions may have different growth patterns in terms of the number of answers to the questions; for some questions, responses steadily increase, whereas, for others, answers exhibit single or double peaks at various times. PIP trend discoverers are marked on the figure with green “X” marks.
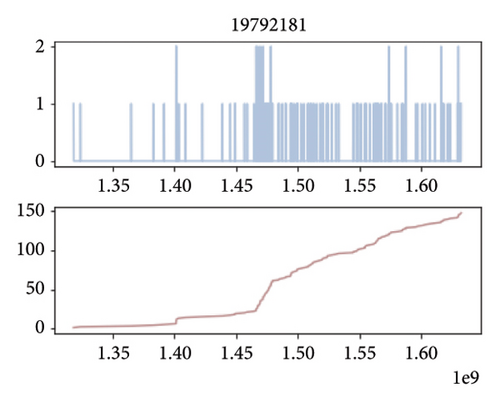
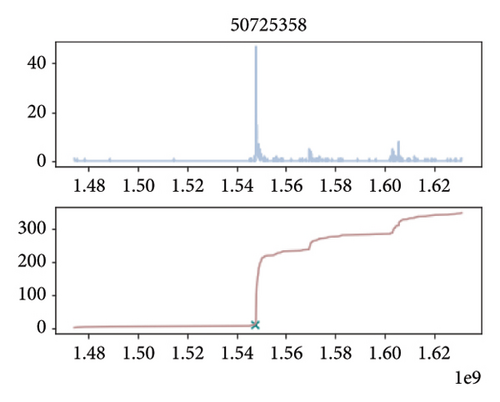
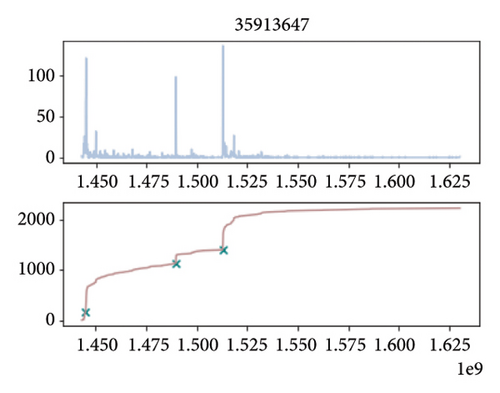
In the training set, after anonymous respondents are excluded, 43,808 users are identified. These users accomplished 50,812 PIP trend discoveries, as indicated in Table 2. The user with the biggest count of PIP trend discoveries achieved 79 trend discoveries; most users achieved only one trend discovery. In this study, for users who achieved only one PIP trend discovery, this discovery is considered to have been accidental; 3298 PIP trend discoverers are identified as nonaccidental.
| Discoveries | Number of users |
|---|---|
| 1 | 40,510 |
| 2–10 | 3224 |
| 11–20 | 57 |
| 21–50 | 13 |
| > 50 | 4 |
4.2.2. PIP Trend Discoverers on Stack Overflow
For the 9000 most popular questions, 703 PIP trend discoverers occurred. After users with only 1 PIP discovery are excluded, 51 PIP trend discoverers remain. Additional details are provided in S4 of Supporting Information section.
4.3. Validation of Trend Discoverers
4.3.1. Performance of Trend Discoverers in the Test Set on Zhihu
The test set comprises 311,120 questions and 4,700,543 answers, with participation from 1,934,128 users. Among the trend discoverers identified in the training set, 9416 early trend discoverers answered questions in the test set, representing 15% of all early trend discoverers. In addition, 2477 PIP trend discoverers participated in the test set, accounting for 75% of all PIP trend discoverers.
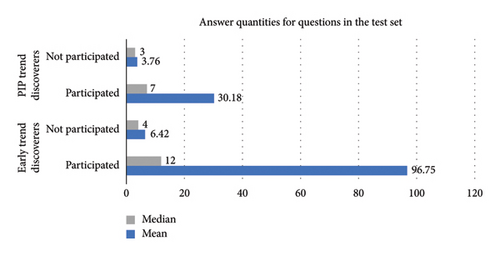
This study investigates whether the final popularity of questions differs between questions with and those without the engagement of trend discoverers. In the test set, we identify all questions answered by trend discoverers (29,944 for early trend discoverers and 133,602 for PIP trend discoverers) and record their number of final answers. To enable comparison, an equal number of questions without trend discoverers’ responses are randomly selected, and their popularity is recorded.
As presented in Figure 5, questions answered by trend discoverers exhibit higher popularity compared with those only answered by regular users. This indicates that the trend discoverers identified in the training set also demonstrate outstanding performance in the test set. Questions involving trend discoverers are more likely to be popular, underscoring the importance of the identified trend discoverers and validating the effectiveness of the identification method used in this study.
This study further validates the effectiveness of its trend discoverer identification method by controlling for the answering activity of users. A trend discoverer set D and regular user set U are defined. For each trend discoverer Di, one regular user Ui with the same number of answers is randomly selected.
The popularity of each question answered by users in set D (denoted as DAnsNum) and by users in set U (denoted as UAnsNum) is recorded. A Mann–Whitney U test is performed on DAnsNum and UAnsNum. The results of 50 random experiments reveal that the questions responded to by early trend discoverers and PIP trend discoverers are significantly more popular compared to those responded to by regular users, even when the answering activity of users is controlled for.
4.3.2. Performance of Trend Discoverers in the Test Set on Stack Overflow
3307 early trend discoverers identified in the training set participated in answering questions in the test set, representing 25% of all early trend discoverers. In addition, 30 PIP trend discoverers participated in answering the questions in the test set, accounting for 59% of all PIP trend discoverers identified in the training set.
Analysis of this dataset yielded results consistent with those for the Zhihu dataset. First, questions answered by trend discoverers have more responses than those answered by regular users. For PIP trend discoverers, the median number of answers provided is equal to that of regular users. Second, through 50 random samples and Mann–Whitney U tests performed on DAnsNum and UAnsNum, we discover that only responses provided by early trend discoverers lead to significantly higher popularity for questions relative to the responses provided by regular users when user answer frequency is controlled for. Additional details are provided in S5 of the Supporting Information section.
4.4. Analysis of Trend Discoverer Characteristics
4.4.1. Zhihu
To compare the user characteristics between early and PIP trend discoverers, this study randomly samples 50,000 regular users and 5000 high-follower users. High-follower users are the top 10% of users, determined on the basis of the number of followers, among the sample of 50,000 regular users. Data are unavailable for some users because of account deactivations and banning. The dataset used to analyze personal account information is presented in Table 3.
| User type | Number of users |
|---|---|
| Early trend discoverers | 60,173 |
| PIP trend discoverers | 3040 |
| Overlapping discoverers1 | 899 |
| Regular users | 50,000 |
| High-follower users | 5000 |
- 1Users who are both early trend discoverers and PIP trend discoverers.
4.4.1.1. Personal Information
The gender, verification status, and membership status distributions of the different types of users are analyzed.
As illustrated in Figure 6, overlapping discoverers have the biggest membership proportion at 24.69%, followed by PIP trend discoverers at 22.24%, early trend discoverers at 7.15%, and regular users at 7.40%.
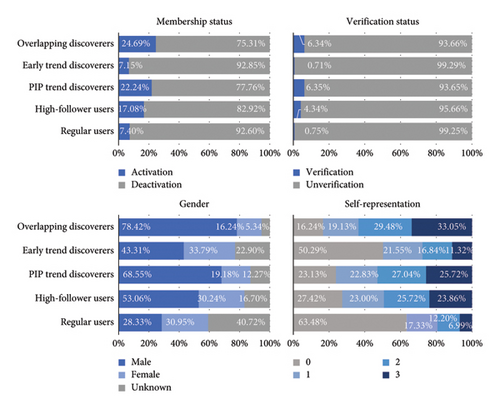
Overlapping discoverers and PIP trend discoverers have a similar rate of being verified users of approximately 6%. Regular users have a rate of only 0.75%, and early trend discoverers have a rate of 0.71%.
Gender is self-reported on Zhihu and is categorized in this study as male, female, or unknown (if the user did not provide this information). The number of male users on the Zhihu platform slightly exceeds that of female users [44]. As presented in Figure 6, among the different user types, overlapping discoverers are most likely to be male, with 78.42% of these discoverers being male. The proportions of male users among PIP trend discoverers, high-follower users, and early trend discoverers are 68.55%, 58.06%, and 43.31%, respectively. Among regular users, 40.72%, 30.95%, and 28.33% are categorized as unknown, female, and male, respectively.
Trend discoverers exhibit a higher degree of self-representation compared with regular users. Among PIP trend discoverers and early trend discoverers, 25.72% and 11.32%, respectively, display all possible nonmandatory personal information on their profiles. By contrast, 63.48% of regular users do not provide any of this optional information, and only 6.99% include all of this optional information.
4.4.1.2. Social Relationships
Since user-to-user following relationship data are unavailable, the number of followers and followings is used to measure user social connections.
Figure 7 reveals that PIP trend discoverers and overlapping discoverers have significantly more followers than the other types of users, including high-follower users. To further investigate the follower count of PIP trend discoverers, we compare the top 10,000 users by the number of followers in the entire dataset (194,196 users). Among these, 1970 are PIP trend discoverers, including 742 overlapping discoverers. This demonstrates that PIP trend discoverers are a group with a substantial follower base.
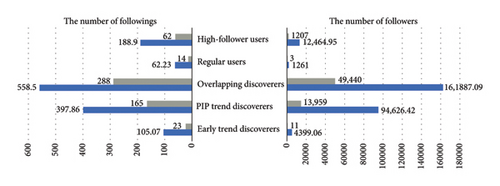
The influence mechanism of PIP trend discoverers and early trend discoverers on question popularity differs significantly. Early trend discoverers primarily identify potential trends in certain questions being popular on the basis of specific characteristics. By contrast, PIP trend discoverers leverage their substantial follower base to attract followers to participate in answering questions, which increases the number of answers to those questions.
4.4.1.3. Behavioral Characteristics
This study compares the behavioral differences among different types of users by using the following four metrics: the median number of questions asked, answers given, articles published, and favorites.
Behavioral characteristics correspond to user activity and engagement on a platform. As illustrated in Figure 8, the median values for the four behaviors of early trend discoverers match those of regular users. This suggests that despite having a similar level of answering activity to that of regular users, early trend discoverers are able to identify questions that are likely to become popular.
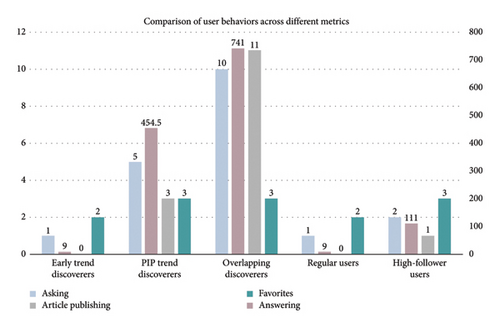
Second, PIP trend discoverers and overlapping discoverers demonstrate significantly higher levels of activity across all metrics and are the most active participants on the platforms, particularly in terms of answering questions. Compared with high-follower users, PIP trend discoverers and overlapping discoverers exhibit a high propensity for asking questions. Due to their active engagement in both asking and answering, PIP trend discoverers attract widespread attention and accumulate followers.
4.4.1.4. User Influence
A user’s influence is primarily reflected in the recognition they receive from other users [36, 45]. Therefore, this study conducts a statistical analysis of the number of upvotes, likes, and favorites that users received for their answers.
As indicated in Table 4, both PIP trend discoverers and overlapping discoverers receive significantly higher numbers of upvotes, likes, and favorites than regular users, primarily due to their large follower bases. On the Zhihu platform, users’ answer activities are recommended to their followers and appear in their followers’ news feeds. Although early trend discoverers receive fewer upvotes, likes, and favorites than PIP trend discoverers, they still outperform regular users in these metrics.
| Upvotes | Likes | Favorites | |
|---|---|---|---|
| Early trend discoverers | 124.00 | 26.00 | 28.00 |
| PIP trend discoverers | 11,587.00 | 1425.50 | 1647.00 |
| Overlapping discoverers | 31,043.00 | 4722.00 | 5942.00 |
| Regular users | 67.00 | 15.00 | 16.00 |
| High-follower users | 3580.00 | 607.00 | 986.00 |
4.4.1.5. Content Features
Using the variety calculation method described in the Methods section, this study measures the variety of answers provided by early trend discoverers, PIP trend discoverers, and regular users. For each user, we extract all questions they answered and count the question tags for those questions. Information entropy is used to measure the variety of these tags. The results are illustrated in Figure 9.
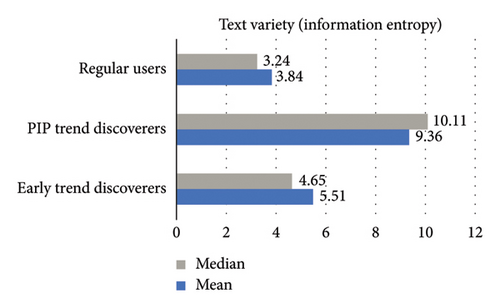
Both early and PIP trend discoverers have higher information entropy than regular users. Specifically, PIP trend discoverers answer questions with a more diverse distribution of question tags, indicating they engage with questions in a wider range of fields. Early trend discoverers have a slightly lower variety and regular users have the lowest variety in participating in answering questions more concentrated in specific fields.
A Mann–Whitney U test is conducted to assess differences between the three types of users. Significant differences in variety are observed between the types. The results are provided in S6 of the Supporting Information section.
4.4.2. Stack Overflow
On the Stack Overflow platform, we identify 13,273 early trend discoverers and 51 PIP trend discoverers. In addition, 4000 regular users are randomly selected as a comparative reference group. Since the Stack Overflow platform does not have to follow or have follower relationships, the comparison among these three user groups is based solely on four aspects: personal information, behavioral characteristics, influence, and content features.
PIP trend discoverers on the Stack Overflow platform have longer account histories and more complete personal information relative to other users, indicating a strong self-presentation awareness. PIP trend discoverers are highly engaged and frequently ask and answer questions across various domains. Early trend discoverers demonstrate a strong level of engagement, ranking just behind PIP trend discoverers in terms of account age, self-representation, question-asking, answer provision, and the variety of question domains. Early trend discoverers often prioritize the quality of their knowledge contributions, and therefore, they have a higher influence per answer compared with PIP trend discoverers. Additional details are provided in S7 of the Supporting Information section.
5. Conclusions and Discussion
5.1. Key Roles on Q&A Platforms
This study proposes a method for identifying PIP trend discoverers and categorizes trend discovery behavior into two types: PIP trend discovery and early trend discovery. On the Zhihu platform, we identify 3298 PIP trend discoverers and 62,926 early trend discoverers. In addition, on the Stack Overflow platform, we identify 51 PIP trend discoverers and 13,273 early trend discoverers.
Our findings indicate that questions involving trend discoverers are significantly more popular than those involving regular users. On Zhihu, questions answered by early trend discoverers (median = 12) and PIP trend discoverers (median = 7) exhibit notably higher popularity than those without trend discoverer participation (median = 4; median = 3). The Mann–Whitney U test confirms that questions responded to by trend discoverers are significantly more popular compared with those responded to by regular users, even when the number of answering activities is controlled for. On Stack Overflow, the median number of answers for questions with early trend discoverer participation is 1.68, whereas the median number is 1.51 for questions without their involvement; this difference is significant according to the Mann–Whitney U test. However, for PIP trend discoverers, the difference is not significant.
This study further conducts an analysis of trend discoverers’ characteristics across five dimensions: personal information, social relationships, behavioral traits, influence, and the diversity of textual content in responses. First, trend discoverers exhibit a strong desire for self-presentation. Both early trend discoverers and PIP trend discoverers tend to display all personal information on their profiles, including in optional fields. Second, trend discoverers demonstrate higher engagement in both asking and answering questions. The numbers of answers provided by PIP trend discoverers often reach hundreds or even thousands, whereas regular users typically contribute only a few responses. Third, trend discoverers receive more recognition than regular users; PIP trend discoverers’ answers garner more upvotes, likes, and favorites on Zhihu compared with early trend discoverers, and early trend discoverers on Stack Overflow achieve higher reputation scores and obtain more upvotes than PIP trend discoverers. Fourth, trend discoverers tend to answer questions across a wide range of topics, demonstrating higher information entropy compared with regular users. This indicates that trend discoverers are more inclined to engage with and discuss a variety of subjects rather than focusing on a single field.
The behavior mechanisms behind PIP trend discoverers and early trend discoverers differ significantly. PIP trend discoverers exert immediate influence on the number of answers to questions, whereas early trend discoverers aim to identify questions with potential for explosive growth. In this study, user characteristic analysis reveals that early trend discoverers are similar to regular users but possess the ability to pinpoint future hot topics or questions. Early trend discoverers have infrequently been considered in research on Q&A platforms and are difficult to identify using traditional key user identification methods. Early trend discoverers hold considerable value in predicting the popularity of questions. By focusing on early trend discoverers, our study provides a more accurate identification of influential users, enhancing the understanding of user engagement dynamics and content popularity trends. In addition, according to the study’s results, most PIP trend discoverers drive discussions through their answering behavior and by leveraging their follower base. Although they differ in terms of when they participate in the discussion and the timing of the effects of such participation, both types of trend discoverers can drive other users to provide a higher overall number of responses. They shape trends in Q&A and discussions through their actions, contributing to the promotion of overall engagement and activity on platforms.
Although PIP trend discoverers have numerous followers, they are not equivalent to traditional opinion leaders, whose influence is primarily based on the number of fans. The follower number can indicate opinion leader status [46]. The role of opinion leaders primarily highlights the commercial value of influencing user attitudes toward products or consumer behavior. By contrast, PIP trend discoverers can stimulate their followers’ desire to participate in answering questions. In personalized recommendation systems based on social relationships, platforms push questions answered by PIP trend discoverers to their followers. Browsing PIP trend discoverers’ answers may prompt followers to focus on hot topics. Followers’ responses may endorse the views of PIP trend discoverers, provide different perspectives, or contradict the discoverers because PIP trend discoverers lead the discussion trend. Notably, the effect of PIP trend discoverers is often immediate. This may not be solely because of their large follower base; it may also be related to their sensitivity to external situations and their ability to engage in discussions of controversial topics at opportune times.
5.2. Research Implications
This study contributes to user analysis research by offering insights into the observational aspects of user roles in Q&A systems. The concept of trend discoverers was initially introduced to discuss platforms with rating or commenting capabilities; however, trend discoverers likely exist across social media platforms. This study successfully adapts the concept to Q&A platforms and introduces the notion of PIP trend discoverers, confirming the feasibility of identifying these users across different platforms. Thus, this study broadens the scope and applications of the term “trend discoverers” and enhances the literature on aspects of user behavior, including analyses of item popularity, on all platforms, not just Q&A platforms.
From a methodological standpoint, our detection approach is more streamlined and may exhibit greater efficiency compared to previous methods that rely on network structure or user influence. Our method relies solely on response behavior data, avoiding the complexities associated with semantic data and user social relationship data. Furthermore, online platforms have increasingly enhanced privacy protections, and therefore, accessing user social relationship data is becoming increasingly difficult [47].
Unlike Medo’s research, which considered reviews and products [18], this study considers answers and questions. Reviewers represent a subset of actual consumers, whereas answerers encompass all participants on a platform and reflect the precise sequence of participant engagement. Therefore, our method allows for more accurate identification of trend discoverers.
From a practical perspective, the results of this study have considerable implications for the development of Q&A platforms. For regular users, following trend discoverers’ discussions presents the users with diverse viewpoints, enabling them to learn and gain new knowledge. In addition, by observing and participating in trend discoverers’ discussions, regular users remain up to date on the latest trends and topics and thereby remain aware of current events and hot topics.
For Q&A platforms, lurkers represent a broad range of potential contributors from whom ideas and feedback can be obtained [48]. By identifying trend discoverers, platforms can boost discoverers’ visibility to encourage greater participation among lurkers. In addition, the activities of trend discoverers can help platforms identify and recommend high-quality questions and topics, enabling regular users to quickly identify content that interests them and thereby enhancing their engagement. Furthermore, trend discoverers can reveal future trends in question popularity. Identifying trend discoverers can enable platforms and relevant regulatory bodies to enhance their sentiment monitoring capabilities.
5.3. Limitations and Directions for Future Studies
This study does not consider user-following network data. Due to the privacy protection policies enforced by social network platforms, obtaining social network data is often challenging. To reduce the complexity of the user identification algorithm, our research method avoids using user-following data. Nevertheless, having access to these data could aid in conducting a more detailed analysis of user characteristics and enable a further understanding of the process of user influence.
This study demonstrates that trend discoverers significantly affect question popularity. Our research focuses on establishing the existence of this relationship rather than quantifying the exact degree of influence. Future research should incorporate the identification of trend discoverers as a predictive factor for question popularity to enhance the accuracy of prediction models.
Conflicts of Interest
The authors declare no conflicts of interest.
Funding
This work was supported by the Fundamental Research Funds for the Central Universities (Grant No. 1233300009) and the Special Project for Academic Seminar of the Zhejiang Federation of Humanities and Social Sciences (Grant No. 24XSYT45).
Acknowledgments
The authors have nothing to report.
Endnotes
1Stack Overflow data source: https://archive.org/details/stackexchange.
Supporting Information
Additional supporting information can be found online in the Supporting Information section.
Open Research
Data Availability Statement
The data used to support the findings of this study are available from the corresponding author upon reasonable request.


