Numerical Investigation of Supercooled Large Droplets Impingement Characteristics of the Rotating Spinner
Abstract
Aircraft engine icing caused by supercooled large droplets (SLD) poses a significant threat to flight safety. In this paper, the SLD impingement characteristics of the rotating spinner were investigated using FLUENT UDS and the governing equations for water droplet motion were solved based on the Eulerian method. The droplet breakup was simulated using the number density equation, while the droplet rebound and splashing were simulated using a semiempirical model. The effects of rotational speed, droplet diameter, and inflow velocity on the SLD impingement characteristics of the rotating spinner were studied. Some new valuable insights have been found for the SLD impingement. The results indicated that as the rotational speed increases, the local collection efficiency of the rotating spinner decreases. Higher rotational speed results in reduced droplet impingement angle and stronger droplet rebound and splashing. For the droplets with diameters smaller than 111 μm, the local collection efficiency increases with the increase of the droplet diameter. However, when the droplet diameter exceeds 111 μm, the local collection efficiency decreases near the leading edge of the rotating spinner. Additionally, the local collection efficiency decreases as the inflow velocity increases near the leading edge of the rotating spinner. However, higher inflow velocities lead to larger droplet impingement angles, resulting in higher local collection efficiency near the tail of the rotating spinner. The critical impingement angle increases with the increase of the inflow velocity, leading to a more pronounced rebound and splashing of SLD. The research in this paper provides useful help for ice shape prediction and anti-icing system design of rotating spinner in SLD environment.
1. Introduction
The icing of SLD has a significant impact on flight safety and can lead to flight accidents in extreme cases. An example of such an accident occurred in 1994 when an ATR-72 aircraft experienced SLD icing, leading to an uncontrolled flight condition and subsequent crash [1]. The adverse effects of icing caused by SLD have prompted significant attention from regulatory agencies and the aviation industry worldwide. To ensure the safety of aircraft operating in SLD environments, the Federal Aviation Administration (FAA) revised FAR 25 in 2014, and Appendix O was added in FAR 25. This new regulation requires aircraft to meet the specific requirements for SLD icing conditions outlined in Appendix O, which poses significant challenges for aircraft compliance verification [2]. The rotating spinner is a critical part of the aircraft engine, and its icing can result in a reduction in effective flow area and loss of engine thrust. Additionally, the ingestion of shedding ice can potentially damage the compressor blades, cause structural damage to the engine, and even lead to combustion chamber flameout, resulting in a series of hazardous consequences [3]. Therefore, it is necessary to conduct in-depth research on the icing of the rotating spinner.
Numerical simulation is one of the effective methods to study the icing of the rotating spinner. Generally, several key steps are included in the icing numerical simulation such as flow solution, water droplet impingement solution, and ice accretion solution. The impingement characteristics of water droplets have an important effect on the simulation of icing, as they significantly influence the ice accretion calculation. Physically, the supercooled large droplets have a large inertia, which makes its trajectory easily deviate from its original path. Therefore, the SLD may have a larger impingement range. Besides, the SLD display various complex phenomena, including deformation, breakup, rebound, and splashing. Thus, the splashing droplets can reimpinge on the surfaces, posing additional challenges for the icing simulation of SLD.
The methods used to solve the droplet impingement characteristics can be categorized into the Lagrangian method and the Eulerian method. The SLD exhibit special physical phenomena such as deformation, breakup, rebound, and splashing, which can be directly described by the Lagrangian method. The Lagrangian method was adopted to calculate the impingement characteristics of SLD by Wright [4] and Takahashi et al. [5]. However, when dealing with the droplet impingement characteristics for three-dimensional geometry, the Lagrangian method usually requires extensive computational resources and it is also difficult to deal with complex geometric models. Therefore, the Eulerian method has received more and more attention. Honsek et al. [6] proposed a novel computational method for analyzing the impingement characteristics of SLD. The method incorporates a source term in the momentum equation to simulate the effects of droplet rebound and splashing. This method has been applied in the FENSAP-ICE icing software. Iuliano et al. [7] modified the convection term of the water droplet motion equations to simulate the rebound and splashing of SLD. In order to describe the motion of water droplets after rebound and splashing, Bilodeau et al. [8] decoupled the droplet wall boundary conditions before and after the impact based on the assumption that no interaction between the rebound and splashing water droplets and other water droplets. Inspired by Honsek et al.’s work, Kim et al. [9] incorporated the number density equation in conservation form to simulate the breakup of SLD. More recently, a hybrid Lagrangian-Eulerian approach was adopted by Bellosta et al. [10] to calculate the impingement characteristics of SLD. However, it should be noted that these studies primarily focus on static parts and do not specifically address the impingement characteristics of SLD for rotating parts.
In recent years, the icing of rotating part has received more attention and numerical simulations of rotating part icing have been conducted by scholars. Dong et al. [11] employed a two-dimensional axisymmetric model to simulate icing on a rotating spinner and concluded that the rotational speed has minimal influence on local collection efficiency and ice shape. Mu et al. [12] developed a three-dimensional thermodynamic model to investigate ice accretion on the rotating surface. The results demonstrated that the local collection efficiency and subsequent ice shape are significantly affected by the droplet diameter. Based on the previous studies, Gao et al. [13] conducted a numerical simulation to study the impingement characteristics of rotating spinners with three different shapes. They observed that the conical-elliptical spinner exhibits the highest sensitivity of local collection efficiency to inflow velocity, while the conical spinner showed the least sensitivity. Besides, the icing on other rotating parts such as the rotating wing [14], rotating blade [15, 16], and wind turbine blades [17] have been numerically investigated using the Eulerian method. It is worth noting that although these studies have contributed valuable insights into the icing on the rotating parts, the icing caused by SLD was not considered.
In terms of icing experiments, Chen et al. [18] conducted a rotating spinner icing experiment and observed that an increase in rotational speed results in a more intricate ice morphology on the spinner surface. Specifically, the ice exhibits a granular and needle-like appearance. The researchers also noted that higher rotational speeds were associated with thicker ice formation. Zheng et al. [19] conducted an icing experiment on a full-scale rotating spinner which is coated with a hydrophobic material. Their study revealed the significant influence of rotational speed on the dimensions of ice columns formed on the rotating spinner. Li et al. [20] conducted an icing experiment on a rotating spinner, considering three different spinner shapes: conical, elliptical, and conical-elliptical. Interestingly, the conical spinner demonstrates the largest icing area, but the least amount of ice mass. In the glaze icing condition, the centrifugal force results in the formation of needle-like ice structures on the spinner surface. However, few experiments have been carried out on the rotating spinner icing caused by SLD.
In summary, remarkable progress has been made in the research on the icing of rotating spinner. However, to the authors’ knowledge, there are few studies concentrated on the effect of SLD dynamics on the impingement characteristics of the rotating spinner. In this paper, the user-defined scalar (UDS) of FLUENT was used to solve the droplet motion equation based on the Eulerian method. The number density equation was also incorporated to model the breakup of SLD. The effects of rotational speed, droplet diameter, and inflow velocity on the impingement characteristics of the rotating spinner were analyzed in detail.
2. Numerical Method
2.1. Droplet Motion Equation
2.2. Droplet Drag Model
2.3. Droplet Breakup Model
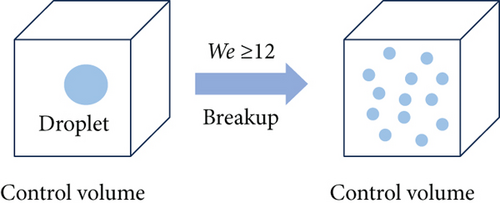
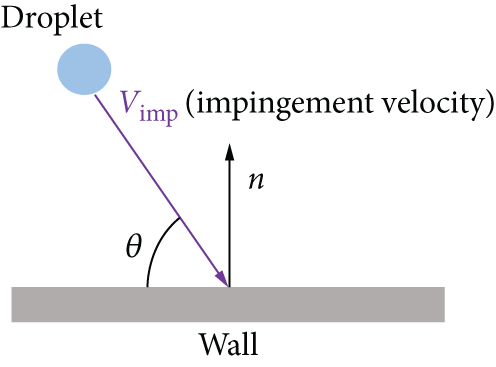
2.4. Rebound and Splashing Models
2.5. Droplet Terminal Velocity
2.6. Solving Method
In the flow solution, the steady Reynolds-averaged Navier-Stokes equations were solved using FLUENT and a rotating coordinate was employed. The SIMPLE algorithm with a pressure-based solver was employed, and the standard k-ε turbulence model with standard wall function was adopted.
After achieving convergence in the flow solution, the motion equation and number density equation of water droplets were solved using FLUENT UDS. This involved solving five different UDS equations, including the mass conservation equation, the number density equation, and the momentum equations in three directions, to simulate the water droplet impingement characteristics. In the discretization of space, a second-order upwind scheme was employed.
3. Method Validation
Due to the lack of available measured data on droplet impingement characteristics of the rotating spinner, a three-dimensional sphere and a NACA23012 airfoil were selected to validate the numerical method used in this paper. The case for a three-dimensional sphere was used to validate the accuracy of the three-dimensional solution of the water droplets. And the case for the NACA23012 airfoil was used to validate the accuracy of the SLD model.
3.1. Case for Three-Dimensional Sphere
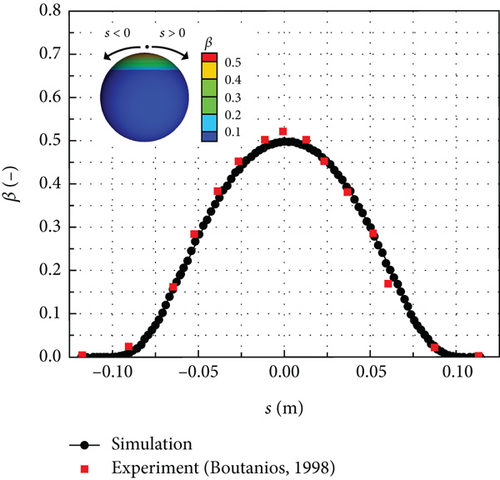
This case was derived from the water droplet impingement characteristic experiment conducted by Bidwell and Mohler in the Icing Research Tunnel (IRT) of NASA [26]. The diameter of the sphere used in the experiment was 15.04 cm. The inflow velocity was set to 75 m/s, while the inflow static temperature and static pressure were 280.14 K and 95840 Pa, respectively. The median volume diameter (MVD) of the droplets in the experiment was 18.6 μm. To accurately represent the particle size distribution in the experiment, the Langmuir-D distribution [27] was selected. The distribution of the local collection efficiency is shown in Figure 3. The horizontal coordinate “s” represents the arc length. There is a good agreement between the numerical simulation result and the experiment result. The impingement limit obtained from the numerical simulation agrees well with the experimental result, and the local collection efficiency at the peak value is only 4.2% lower than that observed in the experiment.
3.2. Case for NACA23012 Airfoil
This case was derived from the NACA23012 airfoil SLD impingement characteristic experiment conducted by Papadakis et al. in the IRT of NASA [28]. The NACA23012 airfoil has a chord length of c = 0.914 m. The inflow angle of attack was set to 2.5°, while the inflow velocity was set to 78.23 m/s. The inflow total temperature and static pressure were 268.03 K and 94803 Pa, respectively. Additionally, the LWC was 0.0005 kg/m3. Two different MVD of 111 μm and 236 μm were used for specific conditions. A 10-bin droplet distribution was adopted as the particle size distribution.
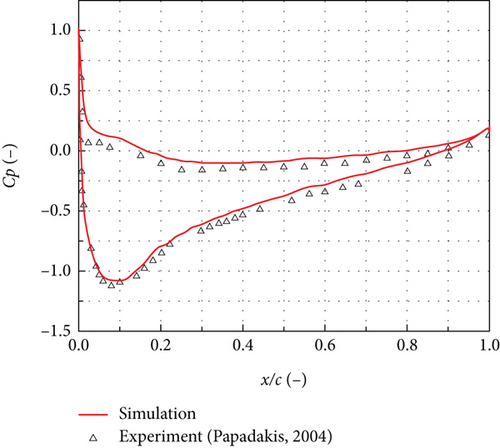
Figures 5(a) and 5(b) present the local collection efficiency of NACA23012 airfoil for MVD = 111 μm and MVD = 236 μm, respectively. The horizontal coordinate “s” represents the arc length from the wall to the airfoil leading edge. Positive values indicate the pressure surface, while negative values indicate the suction surface of the airfoil. When the effects of rebound and splashing were not considered, only the peak collection efficiency agrees well with the experimental result. However, when the effects of rebound and splashing were considered, the local collection efficiency on the airfoil surface is much closer to the experimental result.
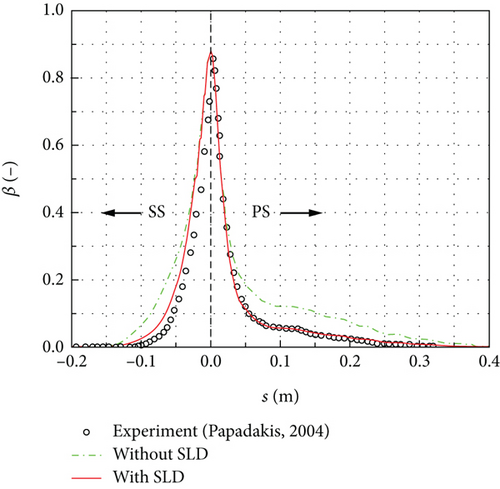
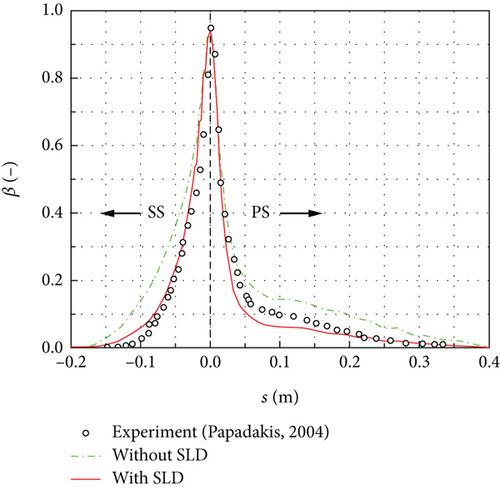
Furthermore, on the suction surface, the numerical simulation results for both MVD = 111 μm and MVD = 236 μm exhibit a good agreement with the experimental results. On the pressure surface, the numerical simulation results for MVD = 111 μm also demonstrate good agreement with the experimental results. For MVD = 236 μm, the numerical simulation result on the pressure surface is slightly lower than the experimental result. However, the maximum deviation between them is less than 0.06. Therefore, it can be concluded that the numerical method used in the paper is reasonably reliable.
4. Geometry Model and Boundary Conditions
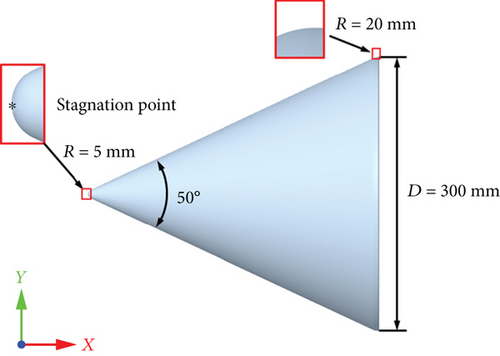
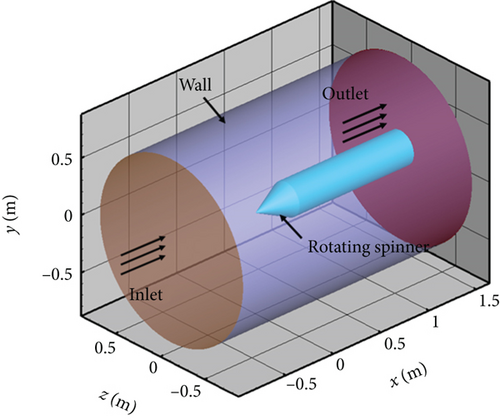
In this paper, a conical rotating spinner was employed, as shown in Figure 6. The top and bottom portions of the rotating spinner are smoothly connected using circular arcs. The maximum diameter of the rotating spinner D is 300 mm, and its rotation axis is the x-axis. The computational domain is cylindrical, with a bottom surface diameter of 4D and a height of 8D. To minimize the influence of the outlet boundary on the numerical result, the tail of the rotating spinner was extended, as shown in Figure 7.
To investigate the effects of rotational speed, droplet diameter, and inflow velocity on the SLD impingement characteristics, conditions were chosen based on the freezing drizzle icing conditions specified in Appendix O of FAR 25. The ambient static pressure was standard atmospheric pressure, the LWC was 0.2 g/m3, and the ambient static temperature was 263.15 K.
For the air phase, the velocity was imposed on the inlet, the static pressure was imposed on the outlet, and the no-slip was imposed on the wall.
For the wall boundary condition of the rotating spinner, Vwdr · n < 0 indicates the water droplet impingement zone; thus, the boundary values were set equal to the value of the first layer grid near the solid surface. Conversely, Vwdr · n ≥ 0 indicates that there is no water droplet impingement; thus, the boundary values should be set to zero. However, the boundary value was taken as 10-9 times the value of the first layer grid near the solid surface to prevent numerical troubles. The outlet boundary conditions were specified with gradients of all parameters as zero in the normal direction of the boundary [29].
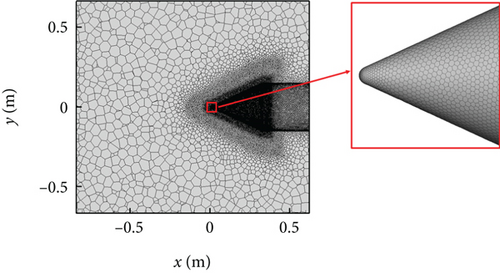
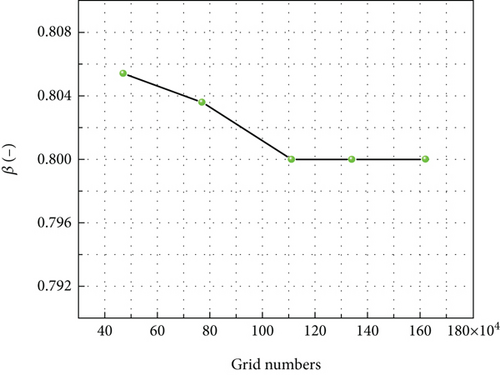
The polyhedral mesh offers advantages such as faster convergence and fewer grids in 3D numerical simulations. In this paper, FLUENT MESHING was utilized to construct the computational mesh, as shown in Figure 8. To enhance the resolution of the fluid domain near the rotating spinner, the body of influence (BOI) method was employed for mesh refinement. A grid independence test was conducted with varying the total number of grids: 0.47 million, 0.77 million, 1.11 million, 1.34 million, and 1.62 million. The local collection efficiency at the stagnation point on the rotating spinner was monitored, with the monitoring point indicated by a black marker in Figure 6. The grid independence result is presented in Figure 9. It is observed that the local collection efficiency exhibits no significant change since the total number of grids reached 1.11 million. Therefore, a total number of grids of 1.11 million was selected in this paper.
5. Results and Discussion
5.1. Effect of Rotational Speed
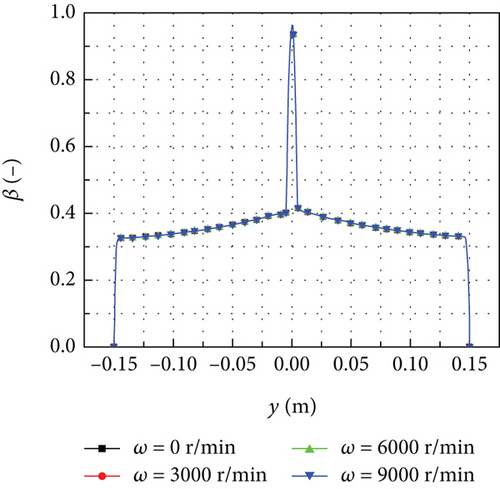
In this section, numerical simulations were conducted for different rotational speeds: ω = 0 r/min (stationary condition), ω = 3000 r/min, ω = 6000 r/min, and ω = 9000 r/min. At the same time, two different droplet diameters of d = 20 μm and d = 111 μm were considered. The specific working conditions are shown in Table 1. To analyze the variation of local collection efficiency, an intersection line was formed between the plane with Z = 0 and the surface of the rotating spinner, as shown in Figure 10(a). The distributions of local collection efficiency on the intersection line for d = 20 μm are shown in Figure 10(b).
| Case | ω (r/min) | Va,∞ (m/s) | d (μm) |
|---|---|---|---|
| 1 | 0 | 70 | 20 |
| 2 | 3000 | 70 | 20 |
| 3 | 6000 | 70 | 20 |
| 4 | 9000 | 70 | 20 |
| 5 | 0 | 70 | 111 |
| 6 | 3000 | 70 | 111 |
| 7 | 6000 | 70 | 111 |
| 8 | 9000 | 70 | 111 |
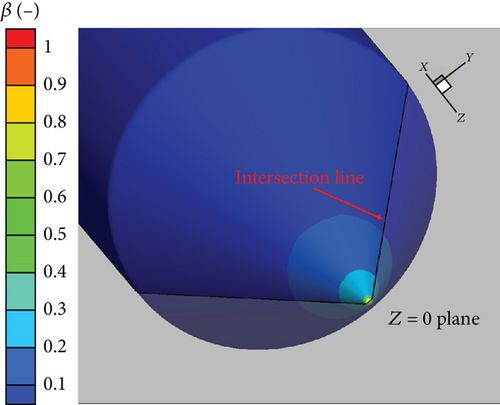

Figure 10(b) shows that the maximum local collection efficiency is observed at the stagnation point of the rotating spinner and gradually decreases along the generatrix of the spinner until reaches zero at the tail. Comparing the results of ω = 3000 r/min with that of the stationary condition, there is no significant change in the local collection efficiency. When the rotational speed increases to 6000 r/min, there is a noticeable decrease in the local collection efficiency at the tail of the rotating spinner, while the impingement limit remains unchanged. At the rotational speed of 9000 r/min, the droplet impingement limit shifts forward. Specifically, the droplet impingement limit moves forward by 10.8% along the generatrix of the rotating spinner compared with the stationary condition. The effect of rotational speed on the local collection efficiency is primarily observed near the tail of the rotating spinner. Quantitatively, the effect of rotational speed on the local collection efficiency is no more than 0.05.
Figure 11 shows the local collection efficiency at different rotational speeds for d = 111 μm. When the effect of rebound and splashing was not considered, as shown in Figure 11(a), the local collection efficiency remains nearly unchanged for different rotational speeds. This phenomenon can be attributed to the significant inertia of the SLD and the relatively weak influence of air resistance on their movement. However, when the effect of rebound and splashing was considered, as shown in Figure 11(b), the local collection efficiency exhibits a different behaviour. As the rotational speed increases, the local collection efficiency remains nearly unchanged near the stagnation point but significantly decreases in other areas of the rotating spinner. By comparing the results with that of the stationary condition, it is observed that the total mass flow rate of collected water W decreases by 9.78%, 24.02%, and 32.95% for rotational speeds of ω = 3000 r/min, ω = 6000 r/min, and ω = 9000 r/min, respectively. Based on these findings, it can be concluded that the rotational speed has a remarkable influence on the SLD impingement characteristics of the rotating spinner.
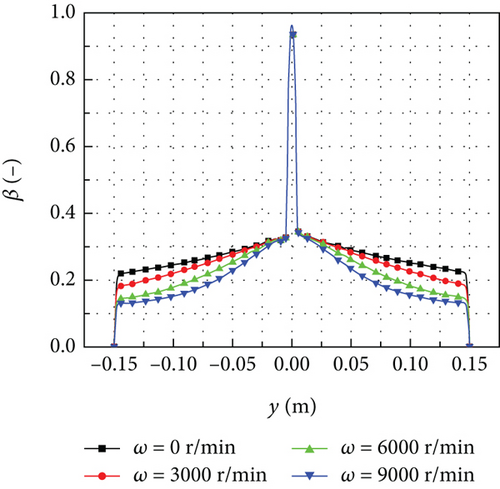
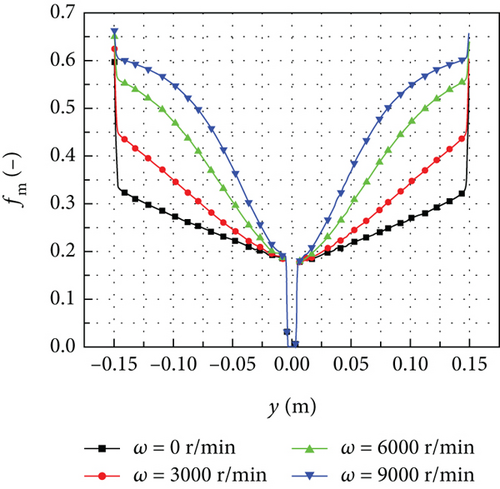
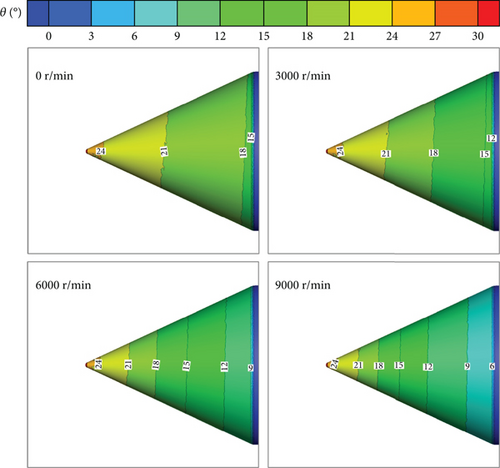
The distributions of mass loss coefficient at different rotational speeds for d = 111 μm are shown in Figure 12. Near the stagnation point of the rotating spinner, the mass loss coefficient is zero, indicating that there is no loss of droplet mass. However, in other areas, as the rotational speed increases, the droplet mass loss coefficient also increases. This increase in the mass loss coefficient leads to a decrease in the local collection efficiency on the rotating spinner surface. Figure 13 shows the contours of droplet impingement angle at the rotating spinner surface for different rotational speeds. It is evident that the impingement angle at the stagnation point remains relatively constant. However, in other areas, the impingement angle decreases as the rotational speed increases. This decrease in impingement angle is caused by the change in the relative velocity of the droplets due to the increase in the rotational speed. According to equation (12), the decrease in the impingement angle results in an increase in the droplet mass loss coefficient, making the droplet more likely to rebound and splash.
5.2. Effect of Droplet Diameter
In this section, numerical simulations were conducted for different droplet diameters: d = 20 μm, d = 52 μm, d = 111 μm, d = 154 μm, d = 236 μm, and d = 300 μm. The specific working conditions are shown in Table 2. To make it clear, the rotating spinner was divided into the upper and lower surfaces according to the different values of the y-coordinate. Figure 14 shows this division, where the negative direction of the y-axis represents the direction of gravity. Figure 15 shows the droplet trajectory and contours of the droplet impingement angle at the rotating spinner surface. It is evident that for the droplets with d = 20 μm, the droplet trajectories are easily influenced by the airflow, resulting in small impingement angles at the rotating spinner surface. However, as the droplet diameter increases, the inertia force becomes stronger while the air resistance decreases. Consequently, the droplet trajectory becomes less susceptible to the airflow, leading to the larger droplet impingement angles at the rotating spinner surface. When the droplet diameter is larger than 154 μm, the influence of gravity on the droplet trajectory becomes significant. The droplet’s trajectory shifts in the direction of gravity, causing the impingement angle to be distinctly greater on the upper surface of the rotating spinner compared with that on the lower surface.
| Case | ω (r/min) | Va,∞ (m/s) | d (μm) |
|---|---|---|---|
| 9 | 3000 | 70 | 20 |
| 10 | 3000 | 70 | 52 |
| 11 | 3000 | 70 | 111 |
| 12 | 3000 | 70 | 154 |
| 13 | 3000 | 70 | 236 |
| 14 | 3000 | 70 | 300 |
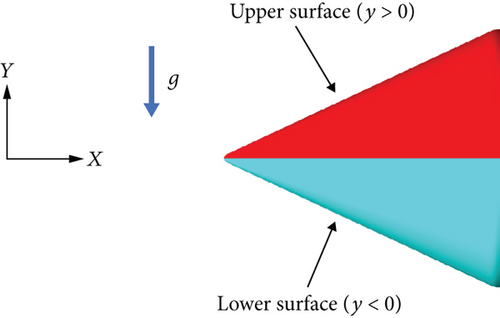
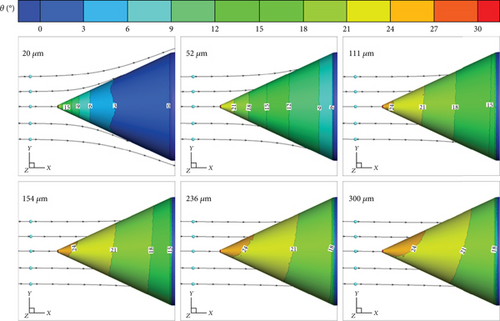
Figure 16 shows the distributions of the local collection efficiency for different droplet diameters. Without considering the effect of rebound and splashing, the droplet trajectory is not easily influenced by the airflow as the droplet diameter increases. Consequently, more droplets hit the rotating spinner surface, leading to an increase in the local collection efficiency, as shown in Figure 16(a). However, as the droplet diameter increases, the influence of droplet diameter on the local collection efficiency gradually diminishes. For instance, the total mass flow rate of collected water W for the droplet with a diameter of 52 μm is 359.21% higher than that of the droplet with a diameter of 20 μm. When comparing the droplet with a diameter of 300 μm with the droplet with a diameter of 236 μm, the increase in W is only 2.08%. Moreover, as the droplet diameter increases, the influence of gravity on the local collection efficiency becomes more prominent. When the droplet diameter is small, the local collection efficiency on the upper and lower surfaces of the rotating spinner is relatively similar. However, as the droplet diameter increases, the local collection efficiency on the upper surface of the rotating spinner becomes significantly higher than that on the lower surface. This disparity is caused by the shift in the droplet trajectory in the direction of gravity.
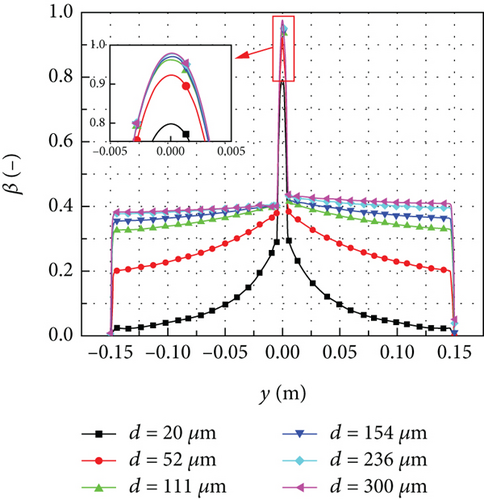
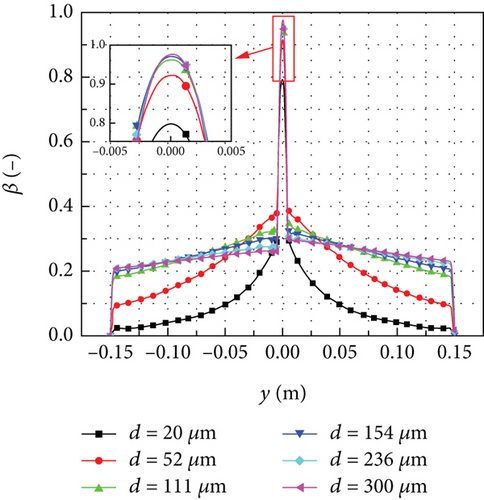
In Figure 16(b), when the effect of rebound and splashing is considered, the local collection efficiency demonstrates some notable patterns. For the droplets with a diameter smaller than 111 μm, the local collection efficiency increases as the diameter increases. However, for the droplets with a diameter larger than 111 μm, the local collection efficiency decreases as the droplet diameter increases near the leading edge of the rotating spinner. At the tail of the rotating spinner, the local collection efficiency slightly increases with the increase of the droplet diameter.
Figure 17 shows the distributions of the mass loss coefficient for different droplet diameters. The mass loss coefficient exhibits significant variations for different droplet diameters near the leading edge of the rotating spinner but tends to become consistent near the tail of the rotating spinner. For example, at the position of y = 0.05 m, the mass loss coefficient for the droplet with a diameter of 236 μm is 29.87% higher than that of the droplet with a diameter of 111 μm. This deviation reduces to 13.98% at the position of y = 0.1 m. Additionally, due to the influence of gravity, the droplet with a larger diameter exhibits smaller impingement angles on the lower surface of the rotating spinner compared with that on the upper surface. Consequently, the droplets on the lower surface of the rotating spinner are more prone to rebound and splash, resulting in a higher mass loss coefficient.

5.3. Effect of Inflow Velocity
In this section, numerical simulations were conducted for different inflow velocities: Va,∞ = 50 m/s, Va,∞ = 70 m/s, and Va,∞ = 90 m/s. At the same time, two different droplet diameters of d = 20 μm and d = 111 μm were considered. The specific working conditions are shown in Table 3. The distributions of the local collection efficiency for different inflow velocities when d = 20 μm are shown in Figure 18. As the inflow velocity increases, the local collection efficiency also increases. For instance, the increase in the local collection efficiency for an inflow velocity of Va,∞ = 90 m/s is 155.37% higher than that of Va,∞ = 50 m/s at the position of y = −0.09 m.
| Case | ω (r/min) | Va,∞ (m/s) | d (μm) |
|---|---|---|---|
| 15 | 3000 | 50 | 20 |
| 16 | 3000 | 70 | 20 |
| 17 | 3000 | 90 | 20 |
| 18 | 3000 | 50 | 111 |
| 19 | 3000 | 70 | 111 |
| 20 | 3000 | 90 | 111 |
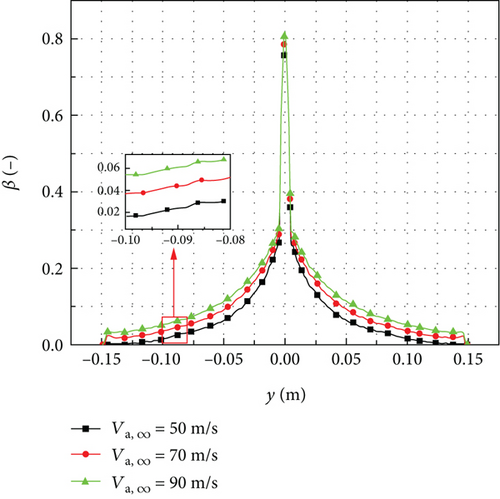
Figure 19 shows the distributions of local collection efficiency for different inflow velocities when the droplet diameter is 111 μm. When the effects of rebound and splashing are not considered, as shown in Figure 19(a), the local collection efficiency is less influenced by the inflow velocity. For instance, the increase in local collection efficiency for an inflow velocity of Va,∞ = 90 m/s is only 6.19% higher than that of Va,∞ = 50 m/s at the position of y = −0.09 m. The observed phenomenon can be explained by the dominance of inertia force over air resistance in larger droplet diameters. When the droplet diameter is larger, the influence of air resistance on the droplet trajectory becomes less significant. Consequently, the variation of local collection efficiency on the rotating spinner surface is not obvious. However, when the effect of rebound and splashing was considered, as shown in Figure 19(b), the local collection efficiency decreases as the inflow velocity increases near the leading edge of the rotating spinner. At the tail of the rotating spinner, the local collection efficiency slightly increases with higher inflow velocity.
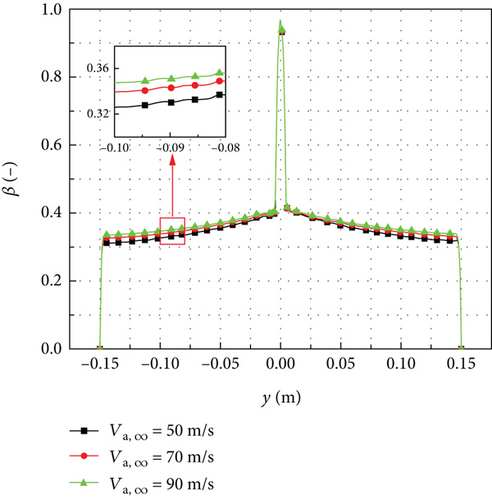
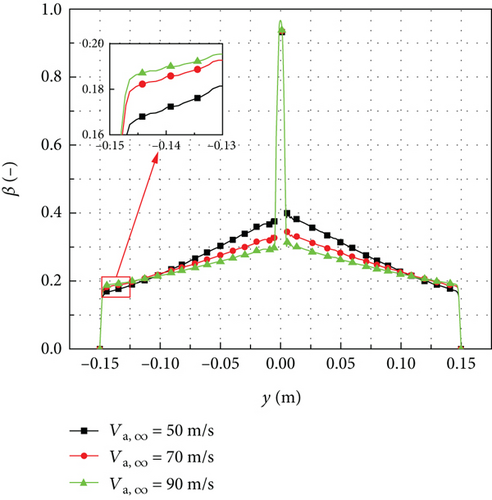
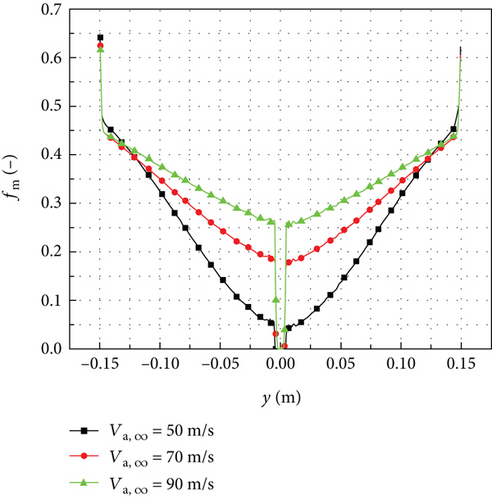
Figure 20 shows the mass loss coefficient distributions for different inflow velocities when the droplet diameter is 111 μm. The mass loss coefficient increases as the inflow velocity increases, leading to a decrease in local collection efficiency near the leading edge of the rotating spinner. As the rotating radius increases, the mass loss coefficient for different inflow velocities gradually becomes similar. However, at the tail of the rotating spinner, the mass loss coefficient for an inflow velocity of Va,∞ = 50 m/s is slightly higher than that of Va,∞ = 90 m/s, resulting in a higher local collection efficiency with the higher inflow velocity.
The relationship between the mass loss coefficient and the droplet impingement angle, as well as the impingement velocity Vimp, is shown in Figure 21. It is evident that an increase in the droplet impingement velocity leads to a higher kinetic energy and mass loss coefficient. As a result, the droplet mass loss coefficient increases as the inflow velocity increases, particularly near the leading edge of the rotating spinner. Furthermore, the increase in inflow velocity also affects the critical impingement angle for droplet rebound and splashing. When the droplet impingement velocity is 50 m/s, the critical impingement angle must be less than 28° for rebound and splashing to occur. However, as the droplet impingement velocity reaches 90 m/s, the critical impingement angle increases to 58°. This indicates that droplets are more likely to rebound and splash for higher inflow velocities.
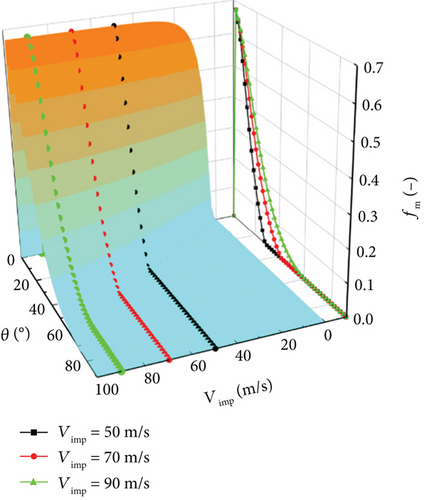
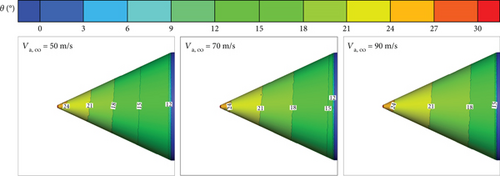
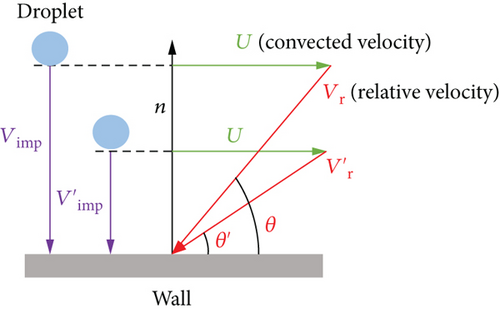
Figure 22 shows the contours of droplet impingement angles for different inflow velocities. The result reveals that increasing the inflow velocity leads to higher droplet impingement angles, particularly near the tail of the rotating spinner. To further explain the relationship between the impingement velocity and the impingement angle, Figure 23 provides a schematic diagram illustrating the variation of droplet impingement angles. When the convected velocity on the rotating spinner surface remains constant, an increase in the absolute impingement velocity of the droplets results in a larger impingement angle between the relative impingement velocity of the droplets and the wall. As the inflow velocity increases, it not only intensifies droplet rebound and splashing but also results in larger droplet impingement angles due to the higher convected velocity at the tail of the rotating spinner. Consequently, the higher impingement angle results in a decrease in the mass loss coefficient, and the droplets with lower inflow velocities exhibit higher mass loss coefficients.
6. Conclusions
In this paper, FLUENT UDS was employed to solve the SLD motion governing equations based on the Eulerian method to investigate the SLD impingement characteristics of the rotating spinner. The effects of rotational speed, droplet diameter, and inflow velocity on the impingement characteristics of the rotating spinner were analyzed in detail. The conclusions can be drawn as follows:
For the droplet with a diameter of 20 μm, the rotational speed has minimal influence on the droplet impingement characteristics. However, for the droplets with a diameter of 111 μm, an increase in rotational speed results in a reduction in the droplet impingement angle and an increase in the droplet mass loss coefficient. Thus, the local collection efficiency decreases with higher rotational speeds. Compared with the stationary condition, the total collection quality of the water droplets decreases by 9.78%, 24.02%, and 32.95% for ω = 3000 r/min, ω = 6000 r/min, and ω = 9000 r/min, respectively.
When the droplet diameter is less than 111 μm, the change in droplet diameter has a significant influence on the local collection efficiency. As the droplet diameter increases, the local collection efficiency on the rotating spinner surface also increases. When the droplet diameter exceeds 111 μm, the phenomena of droplet rebound and splashing become more pronounced. The local collection efficiency near the leading edge of the rotating spinner decreases with the increase of the droplet diameter.
For the droplet with a diameter of 111 μm, the critical impingement angle of the droplet with an impingement velocity of 90 m/s is 30° higher than that of the droplet with an impingement velocity of 50 m/s. As a result, the droplets are more likely to rebound and splash. The local collection efficiency near the leading edge of the rotating spinner decreases as the inflow velocity increases. Near the tail of the rotating spinner, higher inflow velocity results in larger droplet impingement angles, leading to higher local collection efficiency in that region.
Conflicts of Interest
The authors declare that there is no conflict of interest regarding the publication of this paper.
Acknowledgments
This work was supported by the National Key R&D Program of China (2022YFB4301004).
Open Research
Data Availability
The data that support the findings of this study are available from the author.


