Penicillin-Binding Proteins and Graphene/Chitosan Nanocomposite-Based Electrochemical Assay for Multiple Beta-Lactam Antibiotics Detection in Milk
Abstract
Beta-lactam antibiotics (BLAs) are not only important in animal husbandry but are also unavoidable contaminants in milk. The gradual accumulation of BLAs in the human body due to increased milk intake can cause direct harm to human health. Therefore, developing selective and sensitive methods for rapid BLA detection is essential. In this study, a specific electrochemical receptor sensor based on penicillin-binding proteins (PBPs) was established. PBP1a and PBP2x, which have high affinity and specificity for the six BLAs, were used as the receptors and their performance was compared. The sensor was fabricated by sequentially immobilizing a graphene/chitosan nanocomposite, penicillin G (PENG), and Nafion on the surface of a glassy carbon electrode using a convenient casting approach. The mechanism of the electrochemical receptor sensor involved direct competitive inhibition of the binding of the graphene/chitosan/PENG composite to the PBPs by the free BLAs in the solution. The PENG-PBPs complex resisted the interaction between [Fe(CN)6]3−/4− ions and the glassy carbon electrode, thereby decreasing the current signal of the BLAs. The BLA concentration was quantified using differential pulse voltammetry mode. The graphene/PENG/chitosan/Nafion-based electrochemical assay demonstrated good selectivity against other antibiotic residues frequently detected in milk. Under optimized conditions, the detection limits of this method ranged from 0.24 to 1.39 ng·mL−1, which are much lower than the maximum residue limits set by China and the EU. Moreover, the sensor showed a satisfactory recovery rate of 98.8 ± 5.8%–103.2 ± 7.1%. The total analysis time involved only one incubation step, and the entire analysis could be completed within 35 min.
1. Introduction
Beta-lactam antibiotics (BLAs), including natural penicillin and its derivatives, are extensively utilized globally due to their potent bactericidal activity against both Gram-negative and Gram-positive bacteria, low toxicity, broad applicability, and high clinical efficacy [1]. However, the presence of BLA residues in animal-derived food products is common [2]. Farmers frequently misuse these antibiotics as growth-promoting feed additives for livestock and for food preservation, driven by profit motives and the treatment of diseases such as mastitis [3]. The misuse, improper application, and noncompliance with the withdrawal period result in BLA residues in animal-derived foods, such as milk and animal tissues, posing significant health risks to humans, including allergic reactions, dysbiosis, and bacterial resistance [4]. Studies have indicated that BLAs often exceed the maximum residue limits (MRLs) in milk, posing a serious threat to human health. Pasteurization can only eliminate 10%–20% of the remaining BLAs in milk [5, 6]. To mitigate the high risk to public health, stringent MRLs for BLAs in milk have been established in China and the European Union (EU). The MRLs for penicillin G, ampicillin, cefquinome, ceftiofur, and cefalexin in milk range from 4 to 100 µg·kg−1 both in China and EU (GB 31650-2019 and 96/23/EC), while the MRLs for dicloxacillin in milk was established in EU as 30 µg·kg−1 (37/2010/EC). These factors underscore the importance of developing simple, accurate, and sensitive methods for the detection of BLAs to ensure food safety.
Numerous analytical methods have been developed for determining BLA residues in milk, primarily based on gas chromatography (GC), thin film GC, capillary electrophoresis, and high-performance liquid chromatography (HPLC) with various detectors, such as ultraviolet detectors and mass spectrometry (MS) [7, 8]. These methods are accurate, sensitive, and capable of detecting multiple BLAs simultaneously. However, they are expensive and complex; for example, GC-MS requires large volumes of organic solvents and derivatization reagents, which limits their application for onsite and rapid analysis. In addition, complex and time-consuming sample pretreatment is necessary before instrumental detection [9, 10]. Therefore, there is a need for simple, cost-effective, and sensitive methods for the quick determination of BLA residues in milk.
Several commercial test kits and strips have been developed to replace traditional microbial inhibitor methods, which are time-consuming, unstable, and nonspecific [11]. Enzyme inhibition methods, based on the specific inhibitory effect of BLAs on certain enzymes, are more rapid [12]. Immunoassays, which use antibodies, offer the advantages of simplicity, convenience, and reliability, and have been rapidly developed as alternatives to microbial inhibitor and enzyme inhibition methods [13]. However, antibodies can only recognize a single antibiotic or a class with the same characteristic structure. The main challenge is producing a broad-spectrum antibody with wide specificity to BLAs with different characteristic structures [14].
Receptor binding assays are a promising candidate because they have a similar recognition mechanism to immunoassays but enable the simultaneous detection of multiple analytes without needing antibodies to bind BLAs [15]. The principle of receptor assays is based on the specific affinity interaction between receptor proteins and analytes. Receptor proteins, known as penicillin-binding proteins (PBPs), are bacterial proteins inhibited by BLAs [16]. The inhibition of PBPs by BLAs occurs at the final stages of bacterial peptidoglycan synthesis, where the carbonyl group of the β-lactam ring of BLAs covalently binds to the hydroxyl group of the PBP active-site serine, forming a very stable acyl-enzyme intermediate [17]. Based on their molecular mass, PBPs can be classified into high-molecular-mass (HMM) PBPs and low-molecular-mass (LMM) PBPs. HMM-PBPs have an average molecular weight of around 50–100 kDa (PBP1a, PBP2x, and PBP2a), while LMM-PBPs range from 30 to 40 kDa (PBP3) [18]. Generally, HMM-PBPs are primarily used in BLA-specific receptor binding assays. However, different PBPs exhibit significant differences in chemical affinity to BLAs [16]. Therefore, comparing the chemical affinity of different PBPs to BLAs is crucial for developing receptor assays. In previous studies, PBP2x ∗, PBP3, and PBP-BlaR have been employed in developing optical biosensor assays, microplate assays, direct competitive enzyme-linked immunosorbent assays (ELISAs), and gold immunochromatographic assays for simultaneously detecting multiple BLAs in milk [18–22]. However, these methods require digoxigenin, horseradish peroxidase, or bovine serum albumin-labeled BLAs for surface plasmon resonance sensing or visual semiquantitation. In addition, the effect of different PBPs’ affinity to BLAs on assay development has been rarely reported.
In this work, we modified a glassy carbon electrode by sequentially depositing a graphene (GO)/chitosan nanocomposite, penicillin G (PENG), and Nafion to achieve electrochemical signal detection. Using the lab-fabricated electrode, we developed an electrochemical receptor sensor based on the mechanism of direct competitive inhibition of the binding of PENG to PBPs by free BLAs. The electrochemical signal was obtained using the [Fe(CN)6]3−/4− ion, with GO serving as an effective electron transfer mediator. Cyclic voltammetry and differential pulse voltammetry were used to study the electrochemical behavior of the modified electrode. Two types of PBPs, PBP1a and PBP2x, were compared in terms of sensitivity and linear range of the developed receptor assay. The aims of this study were to (1) reveal the effect of PBP on the sensitivity of the electrochemical receptor assay and (2) provide a sensitive and rapid electrochemical method for the quantitative detection of PENG, ampicillin, cefquinome, dicloxacillin, ceftiofur, and cefalexin in milk.
2. Experimental Work
2.1. Materials and Apparatus
All chemicals used in this research were of analytical grade or better and applied as received without further purification. Penicillin G (PENG), ampicillin (AMP), cefquinome (CEFQ), dicloxacillin (DICL), ceftiofur (CEFT), and cefalexin (CEFL) were purchased from Aladdin (Shanghai, China). Prof. Bo Zhao from Nanjing Normal University kindly provided GO. Low molecular weight chitosan and bovine serum albumin (BSA) were from Sigma-Aldrich, Inc. (St. Louis, MO, USA). All other chemicals were from Sinopharm Chemical Reagent China (Beijing) Co., Ltd. Milli-Q water (18.25 M·cm−2) was used throughout all experiments.
Phosphate buffer solution (PBS) was prepared by dissolving 8 g of NaCl, 0.2 g of KCl, 1.44 g of Na2HPO4, and 0.24 g of KH2PO4 in 1 L of Milli-Q water, the pH of which was 7.4 unless otherwise stated. Individual stock solutions of BLAs (PENG, AMP, CEFQ, DICL, CEFT, and CEFL, 500 μg·mL−1) and BSA solution (50 mg·mL−1) were prepared in Milli-Q water. The glutamate solution, which was for the regeneration of the glassy carbon electrode (GCE), was prepared in 0.1 M HCl solution at a concentration of 14.7 mg·mL−1 and its final pH was 2.8. Individual K3[Fe(CN)6] (2 mM), PBP1a (1 mg·mL−1), and PBP2x (1 mg·mL−1) solutions were prepared in the PBS solution (pH = 7.4). All solutions were stored at 4°C before use.
2.2. Instruments
An electrochemical CHI 852C workstation (CHI Instruments, Chenhua, Shanghai, China) coupled with a conventional three-electrode configuration was employed for all electrochemical experiments. The three-electrode cell system consists of a bare or modified GCE working electrode (diameter: 3 mm), a platinum auxiliary electrode, and a saturated calomel reference electrode. Cyclic voltammetry (CV) and differential pulse voltammetry (DPV) were carried out in a 2 mM K3[Fe(CN)6] solution containing 0.1 M KCl. The CV mode (−0.2–0.6 V, 50 mV/s) was employed to evaluate the electrochemical performance of the GCE electrode before and after modification. The DPV mode was used to detect BLAs. The sweep potential was −0.1–0.5 V, amplitude was 50 mV, and pulse period was 50 ms. All experiments were carried out at room temperature (25 ± 2°C).
2.3. Fabrication of Electrochemical Receptor Sensor
2.3.1. Preparation of Graphene/Chitosan Nanocomposite
In brief, 84.6 mg of chitosan was dissolved in 60 mL of 0.05 M HCl solution at 80°C under stirring. The chitosan solution was equally divided into two parts and adjusted by 0.1 M NaOH solution. Then, GO was added in 2 mL of chitosan solution under ultrasonication for 1 h to form a uniform GO/chitosan solution. To obtain optimal performance of the new sensor, the pH value of the chitosan solution (5.0, 6.0, 7.0, and 8.0), the concentration of GO (0.5, 1.0, 1.5, 2.0, and 2.5 mg·mL−1), and the effect of Nafion to the repeatability and stability of the sensor were optimized.
2.3.2. Fabrication of Graphene/Chitosan/Penicillin G/Nafion-Modified Electrochemical Receptor Sensor
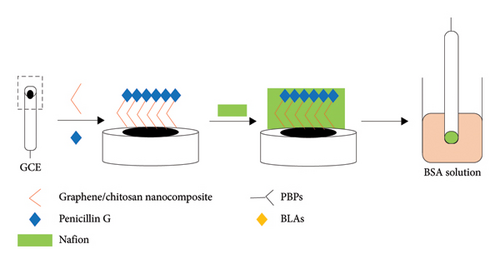
The GO/chitosan/penicillin G/Nafion (G/C/PENG/N)-modified electrochemical receptor sensor was fabricated by a simple casting method. First, the bare GCE electrode was mechanically polished with wet lens paper and then sequentially polished with alumina powder with particle sizes of 0.3 μm and 0.05 μm. After cleaning, the electrode was rinsed with Milli-Q water and ethanol three times under ultrasonication (five min each time). Then, the cleaned electrode was dried at room temperature under a gentle nitrogen stream. The fabrication process was as follows (Figure 1(a)): 4 μL of GO/chitosan solution was cast onto the freshly polished GCE surface. Then, 2 μL of 0.2 mg·mL−1 PENG solution was evenly mixed with the GO/chitosan solution and dried in the oven at 37°C. After that, 2 μL of Nafion (5%, w/v) was cast on the modified GCE electrode and dried at room temperature. The electrode was immersed into 0.5 mL of BSA solution (5%, w/v) for 30 min at 37°C to avoid any nonspecific binding between the nanocomposite material and the electrode. The G/C/PENG/N electrochemical sensor was obtained and rinsed with the PBS solution (pH = 7.4) for further use. The lab-made G/C/PENG/N sensor was activated in a 1 mM HNO3 solution by running 10 cycles of CV before the first-time use.
2.4. Preparation of Penicillin-Binding Proteins
The penicillin-binding proteins (PBPs), which were named PBP1a and PBP2x, were synthesized and provided by Dr. Huang Lu from Nanjing Normal University [23].
2.5. Detection of Beta-Lactam Antibiotics by Graphene/Chitosan/Penicillin G/Nafion Electrochemical Receptor Sensor
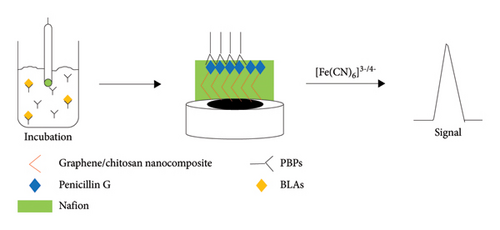
Detection procedures are shown in Figure 1(b). First, 10 μL of PBP (PBP1a or PBP2x) was mixed with BLAs stock solution and PBS solution (pH = 7.4) to form a 50 μL solution. Then, the G/C/PENG/N sensor was incubated in the abovementioned solution for 30 min and subsequentially rinsed with 100 μL of PBS solution (pH = 7.4). The incubated sensor was measured in 1 mL of 2 mM K3[Fe(CN)6] solution, which contained 0.1 M KCl, in DPV mode.
2.6. Optimization Sensing Parameters to G/C/PENG/N Electrochemical Sensor
The effect of the KCl (0, 0.05, 0.1, 0.25, and 0.5 M) in the K3[Fe(CN)6] solution, incubation time (10, 20, 30, 40, 40, 50, and 60 min), and volume of the PBP solution (1, 5, 10, 15, and 20 μL) were optimized.
2.7. Detection of Beta-Lactam Antibiotics in Milk Samples
Organic bovine milk and skimmed bovine milk from two different brands were purchased from a local supermarket in Ningbo, China. The BLA residues in milk samples were detected directly according to the protocol in Section 2.5 without any pretreatment. To test the reliability and applicability of the lab-made electrochemical sensor, it was also employed for the detection of PENG, AMP, CEFQ, DICL, CEFT, and CEFL, which were spiked in the milk samples individually, at two concentration levels based on the analytical sensitivity of the developed electrochemical method. The PBS solution (pH = 7.4) was set as the control. For each sample, triplicate measurements were carried out.
3. Results and Discussion
3.1. Principle of the Graphene/Chitosan/Penicillin G/Nafion Electrochemical Receptor Sensor for Beta-Lactam Antibiotics Detection
The whole sensing principle of the GO/chitosan/penicillin G/Nafion (G/C/PENG/N) electrochemical receptor sensor is shown in Figure 1(b). Initially, the GO/chitosan nanocomposite was fabricated on the bare GCE due to its high electrochemical activity [24]. An exceeded amount of PENG was then bonded to the GO/chitosan nanocomposite to occupy all interaction sites, preventing interference from BLAs in the sample with the interaction between BLAs and the nanocomposite material. An extra layer of Nafion above the G/C/PENG layer acted as the dispersant and adhesive to increase the stability of the thin film structure [25]. The PENG on the sensor surface competes with the free BLAs in the sample solution for interaction with the PBPs. PBPs are partly comprised of serine and cysteine, which have rich hydroxyl groups and sulfhydryl groups, respectively [16, 26]. These groups can covalently bind to the carboxyl group on the beta-lactam ring of BLAs. Consequently, the PENG-PBPs complex formed on the sensor surface impedes the interaction between [Fe(CN)6]3−/4− ions and the GCE electrode, thereby reducing the BLAs current signal. A lower concentration of BLAs in the sample solution results in more PENG-PBPs’ complex formation and a lower current signal. BLAs in the sample can be quantified based on the linear relationship between their concentration and current signal intensity.
The representative electrochemical behavior of the G/C/PENG/N sensor is shown in Figure S1. Curves a and b demonstrate the CV response of the bare GCE electrode and G/C/PENG/N sensor, respectively. The response signal of the electrode significantly increased after modifying it with the G/C/PENG layer, owing to the excellent electronic conductivity of GO. A C/PENG/N sensor without GO was also fabricated (curve c), and its electrochemical signal was much lower than that of the G/C/PENG/N sensor, further confirming the superior electronic conductivity of GO. Curve d displays the CV response of the G/C/PENG/N sensor after incubation with 10 μL of PBPs for 30 min. The electron transfer on the electrode surface was markedly weakened after the formation of the PENG-PBPs complex. The peaks in curve a are stable and constant, indicating that the G/C/PENG/N sensor was well-fabricated.
3.2. Characterization
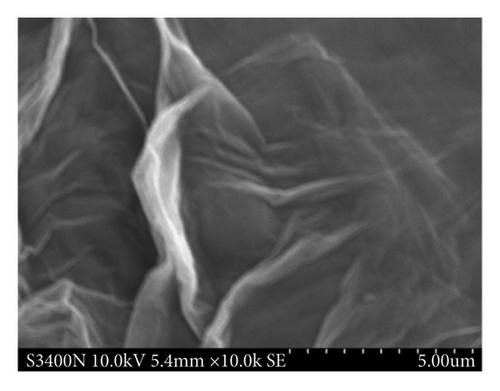
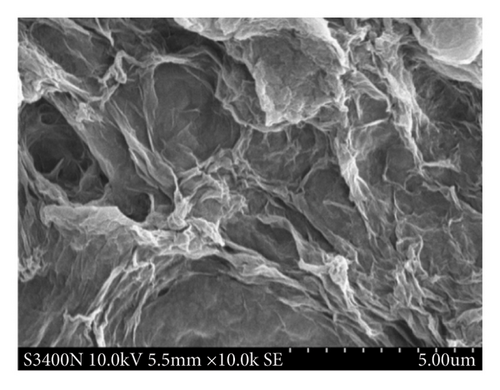
Figure 2 shows the morphology and size of the GO and GO-PBP1a composite (GO@PBP1a), observed at high magnification (10, 000x) using scanning electron microscopy (SEM, ZEISS Sigma 300, Germany). The GO image reveals its typical two-dimensional morphology, characterized by crumbled and folded textures with irregular edges and rough surfaces [27]. The synthesized GO@PBP1a exhibits a similar morphology to GO; however, the folded textures in GO@PBP1a are wider and thicker, resulting in a loss of the characteristic “white gauze” appearance of GO [28].
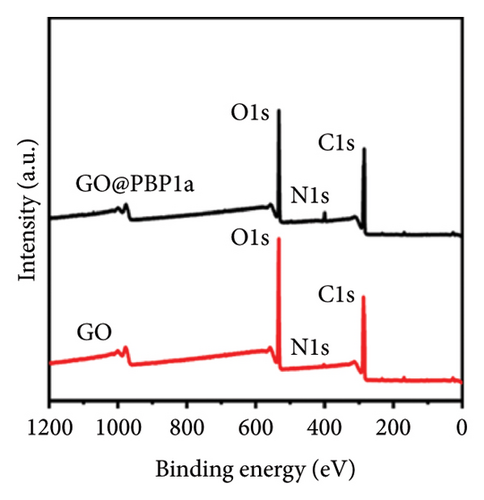
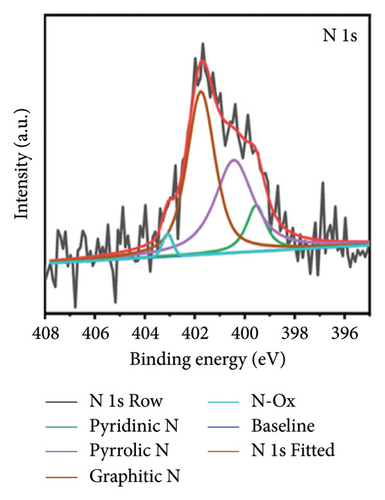
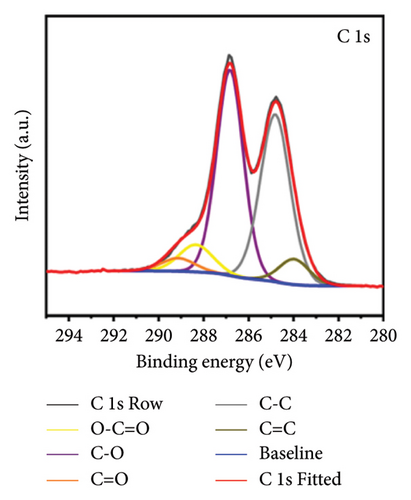
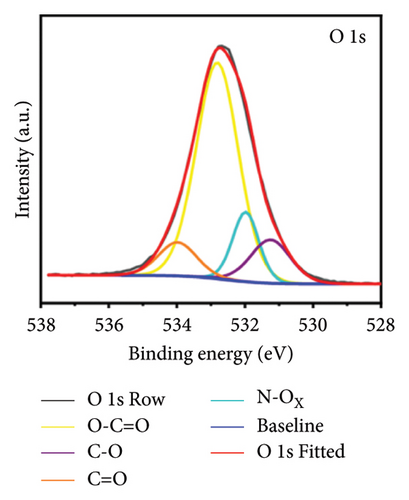
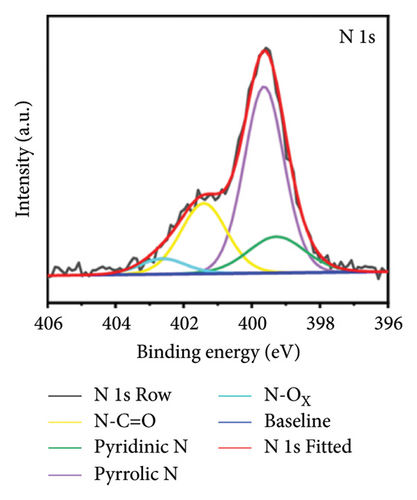
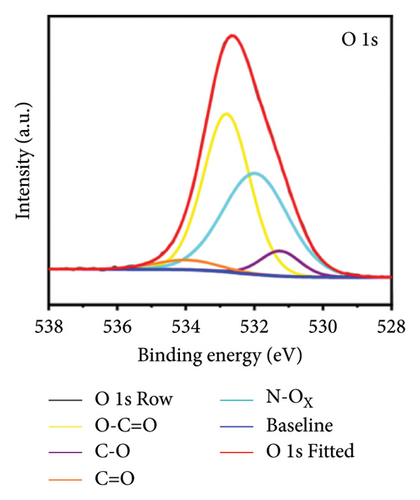
X-ray photoelectron spectroscopy (XPS, Thermo Scientific K-Alpha, USA) was used to determine the elemental composition of the sensor surface, focusing on GO and GO@PBP1a (Figure 3(a)). The XPS spectra were deconvoluted using Lorentzian and Gaussian functions (Figures 3(b), 3(c), 3(d), 3(e), 3(f), and 3(g)) [29, 30]. It has been reported that doping GO with more electronegative atoms (e.g., N and F) decreases the electron density around carbon atoms, causing a positive shift in the binding energy peak [30–32]. However, this shift was not observed in this study, which may be attributed to the small amount of nitrogen atoms incorporated. Nonetheless, the characteristic N 1s peak around 400 eV was detected following the interaction of GO with PBP1a (Figure 3(a)). The deconvoluted N 1s peaks for GO and GO@PBP1a included pyridinic N (399.58 eV and 399.28 eV), pyrrolic N (400.38 eV and 399.64 eV), graphitic N (401.78 eV), N-OX (403.08 eV and 402.62 eV), and N-C=O (401.41 eV) (Figures 3(c) and 3(e)) [33–37]. The acylamino (N-C=O) peak is indicative of protein. The C 1s and O 1s peaks for both GO and GO@PBP1a were consistent at 285.08 eV (Figures 3(c), and 3(f)) and 533.08 eV (Figures 3(d) and 3(g)), respectively. These XPS results are consistent with the deconvoluted values reported in the literature, confirming the successful incorporation of GO in the fabrication of the new electrochemical sensor and indicating that GO does not adversely affect the physicochemical properties of PBP1a.

3.3. Optimization of the Fabrication Process of the Graphene/Chitosan/Penicillin G/Nafion Electrochemical Receptor Sensor
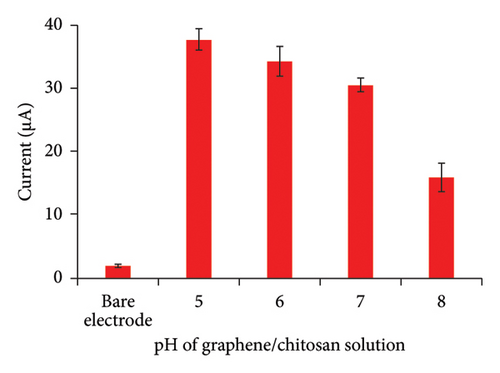
The optimization process began with adjusting the pH of the GO/chitosan solution. As shown in Figure 4(a), the signal intensity of PENG significantly increased after modifying the GCE with the GO/chitosan film, compared to the bare electrode. This increase indicates that the GO/chitosan layer notably enhanced the electronic conductivity of the activated G/C/PENG/N sensor. Generally, the G/C/PENG/N sensor fabricated in acidic solutions (pH = 5.0 and 6.0) exhibited 12–24% higher signal intensity compared to those prepared in neutral solutions [38]. This improvement is attributed to the enhanced electron transfer in GO, which disperses and stabilizes better in acidic environments. Conversely, the signal intensity dropped significantly when the sensor was prepared in a basic solution, indicating that a basic environment is unsuitable for GO dispersion [39]. We did not optimize the pH lower than 5.0 due to potential adverse effects on chitosan solubility. Therefore, GO/chitosan in a pH = 5.0 solution was selected for further sensor fabrication.
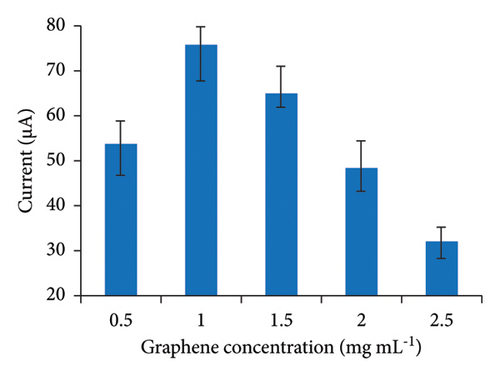
Graphene concentration was optimized by preparing the GO/chitosan mixture with concentrations of 0.5, 1.0, 1.5, 2.0, and 2.5 mg·mL−1 in a pH = 5.0 chitosan solution. As illustrated in Figure 4(b), sensor sensitivity increased with the GO concentration from 0.5 mg·mL−1 to 1.0 mg·mL−1, due to improved conductivity on the sensor surface. However, higher GO concentrations also increased solution viscosity, making it challenging to form a uniform GO/chitosan film on the electrode surface, which adversely affected electronic conductivity. Consequently, the optimal GO concentration was determined to be 1 mg·mL−1.
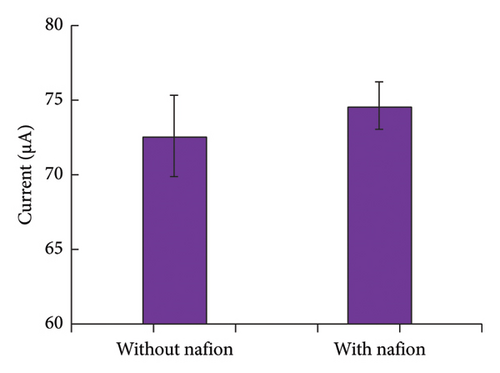
The effect of Nafion on the repeatability and stability of the sensor was evaluated by performing five consecutive measurements of the G/C/PENG/N sensor in DPV mode over five days, as shown in Figure 4(c). Although Nafion did not significantly enhance the signal intensity of the G/C/PENG/N sensor, it substantially improved the repeatability of the lab-made electrochemical sensor by reducing the relative standard deviation (RSD) from 3.76% to 2.11%.
3.4. Optimization of the Sensing Conditions
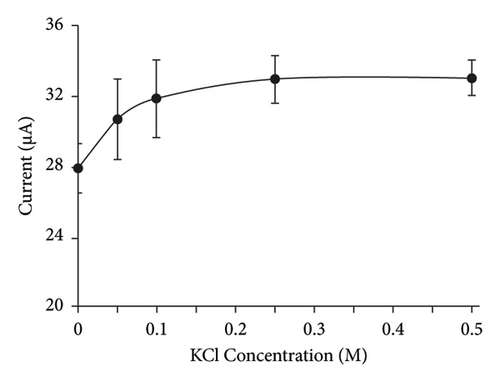
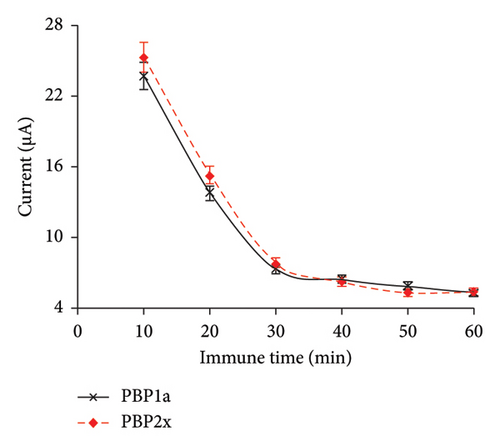
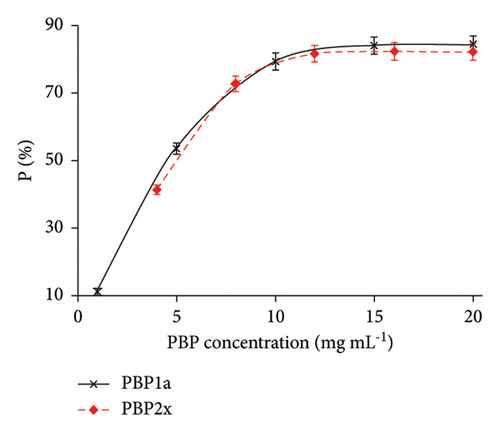
To enhance the electrochemical sensor’s sensitivity and reduce detection time, we optimized three parameters: ion strength in the K3[Fe(CN)6] solution, incubation time, and PBP concentration. First, we varied the KCl concentration (0.05, 0.1, 0.25, and 0.5 M) to adjust the ion strength in the K3[Fe(CN)6] solution. The electron transfer rate in the sensing system improved as the KCl concentration increased from 0.05 M to 0.1 M. However, higher KCl concentrations did not lead to further significant improvements in sensing sensitivity. Thus, 0.1 M KCl was selected for subsequent experiments (Figure 5(a)). Next, we optimized the incubation time by varying it from 10 to 30 min. The detection signal decreased markedly when the incubation time was extended beyond 30 min, due to the rapid interaction between the PBPs and PENG on the electrode surface (Figure 5(b)). After 30 min, the signal stabilized, indicating that no additional PBPs-PENG interactions were occurring on the electrode surface. No significant difference was observed in the interaction times between the PBP1a-PENG and PBP2x-PENG systems, likely due to the structural similarity between PBP1a and PBP2x [23].
3.5. Study of the Graphene/Chitosan/Penicillin G/Nafion Electrochemical Receptor Sensor for BLAs Sensing
Under optimal sensing conditions, the lab-made G/C/PENG/N electrochemical receptor sensor was employed for the detection of BLAs in spiked milk samples to evaluate its performance. The spiked milk samples were prepared by mixing 10 μL of a 1 mg·L−1 PBPs solution with a specific volume of BLAs stock solution (500 μg·mL−1) in full-fat milk, achieving final BLA concentrations ranging from 1 to 200 ng·mL−1. The final volume of each milk sample was 50 μL. As shown in Table 1 and Figure S2, the G/C/PENG/N electrochemical sensor demonstrated high sensitivity for BLAs detection with both PBP1a and PBP2x. The limits of detection (LODs) for PENG, AMP, CEFQ, DICL, CEFT, and CEFL were found to be of 0.24–1.39 ng·mL−1 and 0.31–1.43 ng·mL−1 by using PBP1a and PBP2x, respectively. These LODs are below the MRLs set by the China and EU, indicating excellent sensing performance.
| PBP | Analytes | Regression equation | Linear range (ng mL−1) | Correlation coefficient (R2) | LOD (ng mL−1) | LOQ (ng mL−1) | RSD (%) (n = 3) | MRL of China (ng mL−1) | MRL of EU (ng mL−1) |
|---|---|---|---|---|---|---|---|---|---|
| PBP1a | PENG | y = 1.8662x + 2.3689 | 1–200 | 0.9980 | 0.37 | 1.2 | 2.1–7.8 | 4 | 4 |
| AMP | y = 1.7272x + 3.3616 | 1–200 | 0.9978 | 0.36 | 1.0 | 3.3–8.2 | 4 | 4 | |
| CEFQ | y = 1.4399x + 2.396 | 5–200 | 0.9988 | 1.39 | 3.2 | 1.9–6.5 | 20 | 20 | |
| DICL | y = 1.5828x + 1.5251 | 5–200 | 0.9983 | 1.26 | 2.9 | 3.0–8.2 | — | 30 | |
| CEFT | y = 1.5319x − 4.0184 | 1–200 | 0.9976 | 0.31 | 1.0 | 2.8–7.1 | 100 | 100 | |
| CEFL | y = 1.6067x − 1.1945 | 1–200 | 0.9991 | 0.24 | 0.9 | 3.5–7.0 | 100 | 100 | |
| PBP2x | PENG | y = 1.808x − 0.3981 | 1–200 | 0.9972 | 0.31 | 1.0 | 1.8–6.5 | 4 | 4 |
| AMP | y = 1.6746x − 0.1628 | 1–200 | 0.9951 | 0.39 | 1.2 | 2.8–7.7 | 4 | 4 | |
| CEFQ | y = 1.3949x + 2.3497 | 5–200 | 0.9972 | 1.43 | 4.2 | 3.3–8.2 | 20 | 20 | |
| DICL | y = 1.5243x − 1.1697 | 5–200 | 0.9985 | 1.31 | 3.9 | 3.0–7.3 | — | 30 | |
| CEFT | y = 1.4954x − 3.6191 | 1–200 | 0.9979 | 0.34 | 1.2 | 2.8–6.9 | 100 | 100 | |
| CEFL | y = 1.4251x − 1.8696 | 1–200 | 0.9974 | 0.40 | 1.4 | 3.2–9.1 | 100 | 100 | |
In addition, the G/C/PENG/N electrochemical assays exhibited wide linear ranges and high correlation coefficients, spanning two orders of magnitude and exceeding 0.9951, respectively. The assay also demonstrated satisfactory repeatability, with RSDs below 9.1%. Both PBP1a and PBP2x performed similarly for BLAs sensing in the G/C/PENG/N electrochemical receptor assay. However, minor differences were observed between the two proteins. Specifically, the calibration curve slopes for CEFL were less consistent compared to the other five BLAs, suggesting significant differences in binding affinity between PBP1a-CEFL and PBP2x-CEFL (Figure S2) [18]. Based on these results, PBP1a is used for simultaneous detection of multiple BLAs due to its more consistent performance.
The developed electrochemical assay was compared with other reported biochemical methods in terms of sensitivity, linear range, and assay time (Table 2). In general, our method demonstrated higher sensitivity and a broader linear range compared to PBP-based immunoassay [18, 19], microplate receptor assay [22], and the electrochemical assays based on PBP2x and PBP B1aR [20, 21]. Furthermore, our method is comparable to other receptor-based methods regarding speed, requiring approximately 30 min for the determination of a single sample. It is worth noting that immunoassays are typically the fastest due to their short incubation time and the possibility of integrating the incubation and migration steps into a single procedure. In addition, this study focused on only six BLAs, and further development should include a wider range of BLAs with diverse structures to enhance the method’s applicability.
| Assays | Analytes | Assay time | Electrode material | Linear range (ng mL−1) | LOD (ng mL−1) | Sample | References |
|---|---|---|---|---|---|---|---|
| PBP B1aR-immunoassay | 21 BLAs | 5–10 min | — | Not provided | Not provided | Milk and chicken | [18] |
| PBP-immunoassay | 15 BLAs | 5–10 min | — | Not provided | 0.25–100 | Milk | [19] |
| PBP 3-microplate receptor assay | 27 BLAs | >18 h | — | Not provided | 0.70–27.40 | Milk | [22] |
| PBP 2x-electrochemical assay |
|
>30 min | Tetradentate metal chelator-modified magnetic beads-coated screen-printed carbon electrodes | Not provided | 4.3 | Milk (1 : 1 P&D buffer-diluted Ca-enriched whole UHT milk) | [20] |
| PBP B1aR-electrochemical assay |
|
>45 min | Graphene thionine-coated glassy carbon electrode | 0.1–8 (cefquinoxime) | 0.06–17.16 | Milk | [21] |
| PBP1a/PBP2x-electrochemical receptor assay |
|
>30 min | Graphene/chitosan/Nafion-coated glassy carbon electrode | 1–200 | 0.24–1.39 | Milk | This work |
3.6. Selectivity, Repeatability, Preservability, and Reproducibility of the Graphene/Chitosan/Penicillin G/Nafion Electrochemical Receptor Sensor
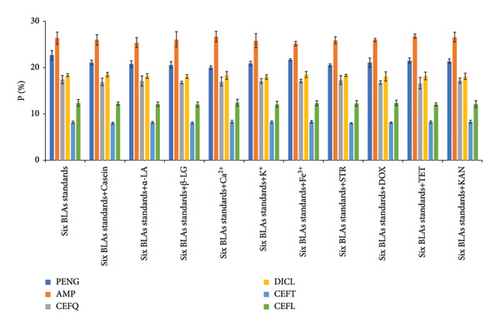
To evaluate the selectivity of the G/C/PENG/N sensor, we assessed its electrochemical responses in a mixed solution containing 10 ng·mL−1 of each BLAs’ standard (PENG, AMP, CEFQ, DICL, CEFT, and CEFL) along with selected interferents. These interferents included various proteins (casein (CAS), α-lactalbumin (α-LA), β-lactoglobulin (β-LG)) and metal ions (K+, Ca2+, and Fe3+), which are commonly found in milk. In addition, structurally similar compounds (streptomycin (STR), doxycycline (DOX), tetracycline (TET), and kanamycin (KAN)) were introduced, as they are also widely used antibiotics and could potentially interfere with the detection of the target BLAs. As shown in Figure 6, these coexisting components had negligible impact on the detection of the target BLAs, despite their concentrations being at least an order of magnitude higher than that of the BLAs. This high selectivity is attributed to the strong binding affinity and specificity between PBPs and BLAs, demonstrating the sensor’s excellent selectivity and potential for accurately detecting the six targeted BLAs.
The repeatability and stability of the G/C/PENG/N sensor were assessed through five consecutive measurements of PENG-spiked full-fat milk samples (100 ng·mL−1) over five days using the DPV method. The sensor was stored at room temperature in ambient air. The RSDs for five consecutive measurements were below 7.6%, indicating excellent repeatability of the G/C/PENG/N sensor (Figure S3a). In addition, the sensor retained its performance with an RSD of 9.3% over five days of storage (Figure S3b), demonstrating good stability and preservability under ambient conditions. The G/C/PENG/N film remained unaffected by environmental temperature, humidity, or air oxidation.
The reproducibility of the electrochemical sensors prepared according to the same protocol was evaluated both within the same day and across different days. Results from five different G/C/PENG/N sensors prepared on the same day yielded an RSD of 6.9% based on triplicate measurements for each sensor (Figure S4a). Reproducibility was also assessed for sensors fabricated over three different days, yielding an RSD of 11.1% (Figure S4b). These results confirm that the sensor fabrication process and the corresponding electrochemical measurements are both reproducible and reliable.
3.7. Real Sample Analysis
The developed G/C/PENG/N electrochemical receptor assay was applied to detect BLAs in three types of milk samples: organic milk, skimmed milk 1, and skimmed milk 2. This application aimed to evaluate the method’s reliability and practical applicability in fundamental sample analysis. The initial analysis revealed that the BLA residues in these milk samples were below the method’s LOD. This outcome may be attributed to the high-quality production of milk from renowned brands, potentially resulting in very low or undetectable BLA residues.
To assess the accuracy and precision of the G/C/PENG/N electrochemical method, BLAs were spiked into the three milk samples at two concentration levels: 3–10 ng·mL−1 and 20–50 ng·mL−1 (Table 3). For comparison, a spiked PBS solution was used as the control. The results are summarized in Table 3. The G/C/PENG/N electrochemical assay demonstrated better accuracy and precision in the skimmed milk samples and the PBS control compared to the organic milk. This discrepancy is likely due to the lower matrix effect in the skimmed milk and PBS solution, compared to the more complex matrix of the organic milk. The direct analysis of organic milk without sample pretreatment led to increased matrix effects from components such as carbohydrates, fats, proteins, vitamins, and minerals. In addition, the spiking concentration of 3–10 ng·mL−1 is near the method’s limit of quantification (LOQ), leading to larger analytical errors. To improve recovery and precision in organic milk, additional sample pretreatment steps, such as fat removal through centrifugation or protein depletion with salts, could be implemented. However, these processes would extend the analytical time and may not meet the requirements for onsite food safety monitoring. Despite these challenges, recoveries of all six BLAs from organic milk were still higher than 48%, indicating that the developed method is adequate for practical applications.
| Analytes | PENG | AMP | CEFQ | DICL | CEFT | CEFL | ||||||
|---|---|---|---|---|---|---|---|---|---|---|---|---|
| Spike con. (ng mL−1) | 3 | 20 | 3 | 20 | 10 | 50 | 10 | 50 | 3 | 20 | 3 | 20 |
| Recovery ± RSD (%) | Recovery ± RSD (%) | Recovery ± RSD (%) | Recovery ± RSD (%) | Recovery ± RSD (%) | Recovery ± RSD (%) | |||||||
| Organic milk | 48 ± 11.4 | 55.5 ± 13.4 | 52.5 ± 10.1 | 54.8 ± 14.2 | 66.2 ± 7.1 | 67.6 ± 7.4 | 69.2 ± 6.5 | 68.3 ± 7.1 | 72.4 ± 5.7 | 72.6 ± 6.1 | 72.8 ± 4.9 | 71.8 ± 5.7 |
| Skimmed milk 1 | 76.4 ± 6.5 | 78.1 ± 8.2 | 79.7 ± 7.1 | 81.3 ± 7.8 | 85.3 ± 4.9 | 83.1 ± 4.3 | 84.9 ± 4.2 | 84.4 ± 5.3 | 98.8 ± 4.2 | 97.4 ± 3.8 | 104.1 ± 4.6 | 93.2 ± 4.4 |
| Skimmed milk 2 | 79.6 ± 7.4 | 77.3 ± 7.1 | 79.2 ± 6.3 | 81.7 ± 8.3 | 85.9 ± 5.6 | 84.7 ± 3.8 | 85.7 ± 4.1 | 86.1 ± 3.2 | 101.1 ± 4.5 | 99.4 ± 3.7 | 92.9 ± 4.2 | 93.4 ± 4.4 |
| PBS | 102.1 ± 6.2 | 98.8 ± 5.8 | 103.2 ± 7.1 | 101.2 ± 4.7 | 99.1 ± 4.3 | 100.3 ± 3.5 | 99.8 ± 2.7 | 99.4 ± 3.1 | 100.8 ± 3.1 | 101.1 ± 3.9 | 101.3 ± 2.7 | 99.8 ± 2.8 |
In contrast, BLA recoveries in skimmed milk samples were higher than 76.4%, with RSDs below 8.3%, demonstrating excellent applicability for analyzing BLAs in treated milk samples. As anticipated, the highest recoveries (98.8 ± 5.8%–103.2 ± 7.1%) were observed in the PBS solution due to its relatively simple and clean matrix. Overall, the data presented in Table 3 confirm that the G/C/PENG/N electrochemical assay is feasible for the quantitative detection of ultratrace levels of BLAs in both untreated and treated milk samples, supporting its potential for onsite food safety monitoring.
4. Conclusion
In this study, we successfully developed a G/C/PENG/N electrochemical receptor assay for the sensitive and selective detection of six BLAs in milk samples. The sensor demonstrated exceptional electrochemical performance due to the high electronic conductivity of graphene and the effective interaction between BLAs and PBPs. Our method achieved low LODs for six different BLAs, surpassing regulatory standards. The electrochemical assay also showed excellent selectivity, repeatability, and stability, with minimal interference from common milk components and other antibiotics. In addition, the method proved reproducible and reliable, with consistent results across different sensor batches and days. Real sample analysis revealed that the G/C/PENG/N sensor is highly effective for BLA detection in spiked milk samples. Future work could extend this method to detect a broader range of antibiotics and integrate sample pretreatment steps to enhance applicability in more complex matrices. Overall, the G/C/PENG/N electrochemical sensor presents a promising approach for rapid, sensitive, and selective monitoring of BLAs, advancing the field of food safety and environmental monitoring.
Conflicts of Interest
The authors declare that they have no conflicts of interest.
Acknowledgments
The Key R&D Program of Zhejiang (no. 2022C02028) and the One Health Interdisciplinary Research Project of Ningbo University (HZ202202) are gratefully acknowledged for financial support.
Open Research
Data Availability
The data used to support the findings of this study are available from the corresponding author upon request.


