Study of Asphalt Pavement Cracking in Different Road Sections of Morocco Using Electrical Resistivity Tomography
Abstract
Road pavements undergo various environmental factors such as temperature changes, precipitation, and traffic exposure, which can lead to cracks in asphalt pavements compromising road user safety and necessitating costly repairs. To gain a deeper understanding of the mechanisms behind asphalt pavement cracking, this study proposes the utilization of the electrical resistivity tomography method to measure the electrical resistivity of soil-supporting road pavements. Electrical resistivity measurements were conducted on soil-supporting road pavements at various times, both before and during the winter season, in four different road sections. Two of these sections were located on Regional Road N707 in the Ifrane region, while the other two were located on National Road N13 in the Azrou and Timahdite regions. The results of the geophysical campaign provided valuable insights into the impact of the winter season on soil resistance and the formation of cracks in asphalt pavements. To achieve this, electrical tomography was employed to generate 2D images of the electrical resistivity of the soil, which were subsequently compared to asphalt cracking data collected in the field through visual surveys and/or asphalt cores. The 2D analysis of the electrical resistivity images of the road pavements under study revealed a decrease in electrical resistivity values during the winter season. This decrease can be attributed to a combination of factors including asphalt pavement cracking, water infiltration during winter, and soil characteristics supporting the asphalt pavement. These findings offer valuable insights intro targeted maintenance and repair efforts.
1. Introduction
Roads play a vital role in economic and social progress by connecting communities and facilitating trade. However, Morocco, with its road network stretching 26,360 km and overseen by the Ministry of Equipment, Transport, and Logistics, faces significant financial challenges related to maintaining, rehabilitating, and managing its roads [1]. One of the main concerns for those responsible for public infrastructure is the need to increase the durability of road pavements, while minimizing operational costs and extending their service life.
In this context, asphalt road pavements are continuously exposed to seasonal weather changes, repeated vehicle loads, and water penetration through voids and cracks. These factors can lead to weak and saturated pavement structures, ultimately reducing the service life of asphalt road pavement [2]. Moreover, delays in pavement renovation encourage moisture infiltration, which alters the internal structure of bituminous materials and reduces their load-bearing capacity [3]. This, in turn, accelerates pavement deterioration, inevitably resulting in higher repair costs that can strain the budget of the state transportation department.
To address these challenges, it is essential to understand the dynamics of humidity and water circulation in pavement support soils following heavy rainfall, which is a significant factor contributing to the damage and cracking in asphalt pavements. This necessitates the application of a noninvasive method that can offer on-site monitoring of cracking dynamics in asphalt pavements.
Orlando et al. [4] assessed various geophysical methods for diagnosing rigid airport pavements. They employed electromagnetic (EM) and ground-penetrating radar (GPR) techniques to generate high-resolution images of pavements. Additionally, electrical resistivity tomography (ERT) was used to definitively identify the anomalous zones. Furthermore, a seismic tomographic survey was conducted to recover the mechanical properties of the pavement, encompassing both P- and S-wave data, thus enabling the determination of the elastic constants, including Poisson’s ratio. Alsharahi et al. [5] utilized a combination of a GPR survey and finite-difference time-domain (FDTD) simulation to assess and identify the factors responsible for road collapse in northern Morocco. Chambers et al. [6] studied the internal moisture dynamics of railway embankments using two-dimensional (2D) and three-dimensional (3D) resistivity measurements. Employing 2D sections and 3D tomograms allowed tracking of the development of seasonal moisture fronts with high spatial precision. They evaluated the moisture distribution on the sides of the embankment, crest, and base. Haryati and Alicia [7] investigated the subsurface conditions in both damaged and undamaged sections of road pavements using electrical resistivity measurements under real-world field conditions. The electrical resistivity of both damaged and undamaged pavements was measured and analyzed, with a specific focus on three types of defects: crocodile cracking in the bus parking area, rutting and potholes along the access road, and transverse cracking in the car park area. The results of this investigation indicate variations in the electrical resistivity values across different types of defects. Another study by Neyamadpour [8] employed 2D electrical resistivity imaging (ERI) using a Wenner–Schlumberger configuration to examine cracks on a road near Masjed Soleiman City in Iran. This approach delineates the vertical extension of the existing cracks in road structures. The inversion results revealed 17 distinct cracks, with depths ranging from 0.5 to 5.5 m. Moreover, in a study carried out by Jackson et al. [9], 2D ERI was used to monitor the evolution of moisture distribution in a road embankment after pavement construction. This observation highlights the accumulation of humid conditions in the lower part of the embankment, preceding an event of slope failure. Another study by Rasul, Zou, and Olofsson [10] analyzed the moisture in a cross section of the E18 highway in Sweden over a year using in situ ERT. The preinstalled ERT measurement line under the road surface asphalt layer exhibited high resistivity variations depending on weather conditions, water flow, and surface activities. Diallo et al. [11] conducted a study in Abu Dhabi combining ERT and multichannel analysis of surface waves (MASW) to characterize a road construction site and assess its infrastructure. This economical approach integrates geophysical and geotechnical tests to provide comprehensive and lateral characterization of subsurface materials. Nobahar et al. [12] investigated failures in highway embankment slopes in Mississippi, built with the highly shrink–swell Yazoo clay, resulting from geotechnical, climatic, and environmental factors. This poses maintenance problems for the Mississippi Department of Transportation. Different approaches, including ERI and finite element modeling (FEM), have been explored. UAV imagery and ERI were used to locate the problematic areas in the four failed embankments. The findings of this study offer crucial data for postfailure embankment evaluation, enhancing the understanding of failure mechanisms, identifying contributing parameters, informing decision-making, and selecting stabilization techniques, thereby enhancing transport infrastructure maintenance and longevity.
Building on previous studies, this research employed a nondestructive method known as ERT, which enables mapping of the spatial distribution of soil electrical properties underneath road pavements. ERT is characterized by its affordability, ease of use, and, most importantly, its nondestructive nature [13]. It is also particularly well suited for shallow-depth investigations [14] and is promising because of its ability to detect lithological variations [15]. In addition, it can be used to visualize changes in soil moisture by applying appropriate petrophysical relationships that relate resistivity to saturation [16, 17].
For this purpose, ERT was applied to four separate road sections, each presenting different types of cracking and damage in the asphalt pavement at different time intervals, both before and during the winter season. The results of the ERT investigations will be supplemented by visual assessments of asphalt pavement deterioration and core sampling.
Therefore, the main objective of this study was to investigate the relationship between soil electrical resistivity and the specific types of asphalt cracking observed in pavements. In addition, this study is aimed at assessing the impact of moisture dynamics and water circulation in the soil supporting the pavement, particularly during the winter season, to gain a deeper understanding of the factors influencing road durability, especially in the Moroccan context. The results of this research have the potential to improve road maintenance and construction practices, thus fostering the development of more resilient and durable infrastructure.
2. Location and Description of the Study Area
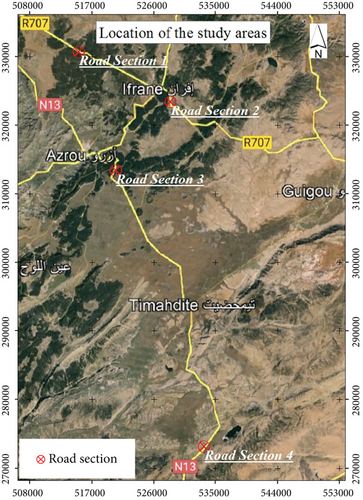
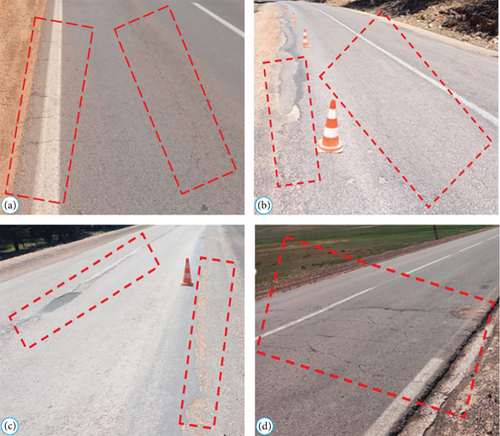
The study area encompasses four road sections, each exhibiting various types of asphalt pavement cracking and damage. The first section (A: Road Section 1), located 11 km northwest of Ifrane on Regional Road N707, displays signs of early longitudinal and transverse cracking. The second section (B: Road Section 2), situated 4 km southeast of Ifrane on the same road, exhibited advanced cracking of the asphalt pavement with fissures along the road axis and asphalt erosion along the road edges. The third section (C: Road Section 3), located 8 km southeast of Azrou on National Road N13, also displays advanced asphalt pavement cracking and erosion of the asphalt along the road edges. The fourth section (D: Road Section 4), positioned 23 km south of Timahdite on RN13, presents advanced cracking perpendicular to the road axis. The locations of the study areas are illustrated in Figure 1, while the different types of asphalt pavement cracking in the four road sections are shown in Figure 2.
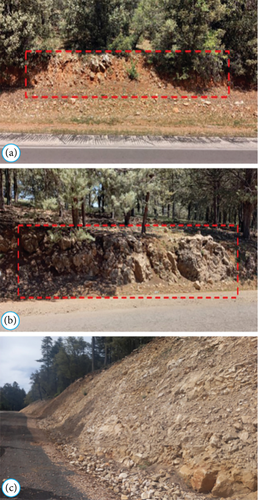
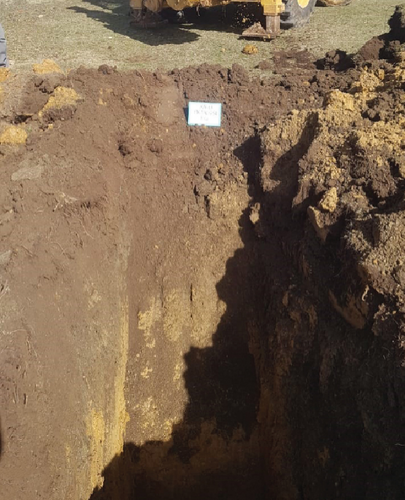
Regarding the composition of the soil supporting the road pavement, the first section consists of fractured limestone with clay joints, while the second and third sections rest upon fractured limestone, as illustrated in the outcrop shown in Figure 3. The fourth section reveals the soil identified as clayey loam, as reflected by the excavation conducted using an excavator, as indicated in Figure 4. These visual inspections of the various types of pavement cracking and damage in the four road sections as well as the nature of the soil supporting the road pavement provide an essential context for the application of ERT.
The study area is characterized by a humid climate, with average annual minimum temperatures ranging from 6°C to 10°C and average annual maximum temperatures ranging from 12°C to 20°C. Annual cumulative precipitation typically ranges between 500 and 700 mm [18].
3. Materials and Methodology
Following a visual inspection of various types of asphalt pavement cracking and damage in road sections, two geophysical campaigns were scheduled for November 2022 just before the start of the winter season and the other for February 2023 during the winter season. These campaigns were aimed at measuring in different road sections and at the same locations within the study areas.
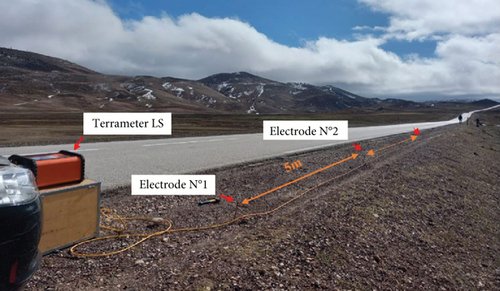
The equipment used to measure the electrical resistivity was an ABEM Terrameter LS with a multielectrode system. This system consists of 32 electrodes nailed to the shoulders of the road pavements studied along the resistivity measurement line established according to the Wenner configuration, with a spacing of 5.0 m between each electrode, as illustrated in Figure 5.
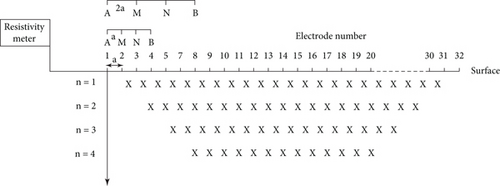
The principle of the Wenner configuration is to maintain the current and potential electrodes at the same distance from each other. At each stage, a measurement was recorded, and the sum of all these measurements at this first interelectrode spacing provided a profile of resistivity values. Next, the interelectrode spacing was increased by a factor of n = 2, and a second line of measurements was taken. This process was repeated until the maximum electrode spacing was reached [19–22] as shown in Figure 6 (see the Supporting Information (available here) for principles of electrical resistivity).
The electrical tomography profiles were interpreted using the RES2DINV resistivity and induced polarization interpretation software. These investigations were combined with visual surveys of the deterioration of asphalt pavements and core sampling. Figure 7 summarizes the methodology used in this study.

4. Results and Discussion
4.1. Road Section 1
Figure 8 presents the 2D electrical resistivity measurement results for the asphalt pavement, showing premature longitudinal and transverse cracks. Measurements were performed before and during the winter.


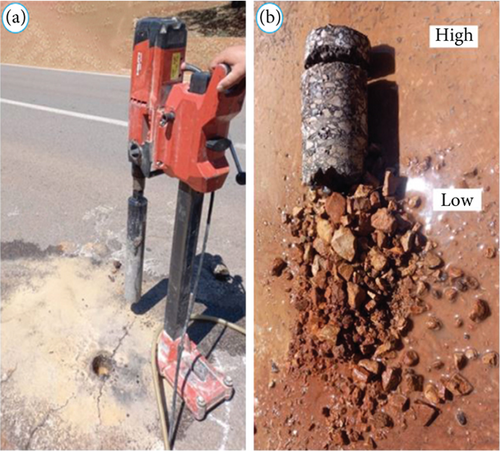
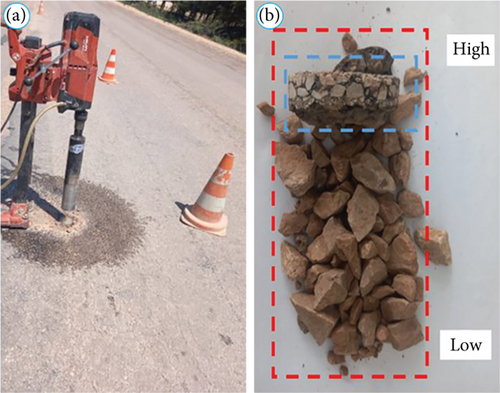
The measurement line extended over a total distance of 160 m, with cracks appearing at the beginning of the line for a length of 80 m. The electrical resistivity values under the defective pavement area varied from 50 to 95 Ω·m. In contrast, the resistivity values for the nondefective area were higher, ranging from 150 to 360 Ω·m. More specifically, in the profile in Figure 8(b), a decrease in electrical resistivity is observed over a distance of 20 m, between points 80 and 110 m, with resistivity values ranging from 50 to 70 Ω·m, indicated in blue. The resistivity values before the winter period varied from 150 to 300 Ω·m, as shown in green in the profile in Figure 8(a). Figure 9 presents the results of core sampling on the road pavement, revealing the presence of a 16-cm-thick layer of bituminous material resting on a gravelly subbase.
Examination of the visual inspection and the results obtained revealed several important points. In particular, a distinct surface formation discontinuity suggests the presence of a contact anomaly between two distinct soil types: a conductive soil (with resistivity values between 50 and 90 Ω·m) at the beginning of the profile and a resistant soil (with resistivity values between 150 and 300 Ω·m), primarily attributed to fractured limestone. Furthermore, there is an expansion of the conductive zone during the winter season, primarily due to rainwater infiltration and the specific characteristics of the supporting soil of the road pavement, which is composed of fractured limestone with clayey joints that enable water circulation. This environment promotes the creation of an area that is prone to asphalt pavement degradation. Premature cracking in the current pavement state can be attributed to the thickness of the bituminous layer, which offers resistance to deterioration. Conversely, undamaged pavement areas are associated with more resilient limestone formation.
4.2. Road Section 2
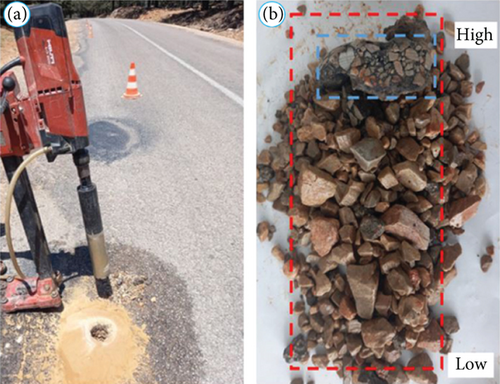
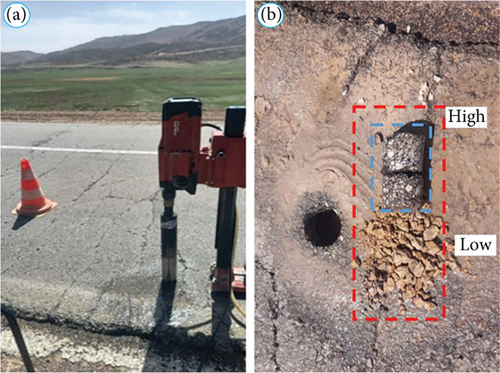
Figure 10 presents the results of 2D electrical resistivity measurements carried out on the asphalt pavement, showing advanced cracking, characterized by raveling and cracks along the road axis, with erosion of the asphalt pavement at the roadside. Measurements were performed before and during winter. The total measurement line was 160 m, and the damage was present along the line where the resistivity values under the defective pavement varied from 400 to 1400 Ω·m before the winter season, as shown in Figure 10(a), and from 150 to 700 Ω·m during the winter season, as shown in Figure 10(b). Figure 11 presents the results of core sampling on the road pavement, revealing the existence of a 4-cm-thick layer of bituminous material, highlighted in blue in the figure, resting on a subbase of gravel materials.


The examination of the visual surveys and the results mentioned above revealed several important points. The surface limestone terrain displays distinct discontinuities that are relatively hard in the middle of the profile but are conductive at both ends. Furthermore, a noticeable decrease in resistivity values was noted for the profile in Figure 10(a) in comparison with that in Figure 10(b), occurring both on the surface and at depth during the winter period. This decline can be attributed to the infiltration of water into the pavement through surface and edge cracks. This infiltration is facilitated by the characteristics of the road pavement supporting soil, which comprises fractured limestone, allowing infiltrated water to circulate. Additionally, the current advanced deterioration of the pavement can be ascribed to the insufficient thickness of the bituminous layer, which is incapable of effectively resisting deterioration.
4.3. Road Section 3
Figure 12 illustrates the results of resistivity measurements carried out on the asphalt pavement, showing advanced cracks parallel to the road axis with erosion of the asphalt pavement at the roadside. Measurements were performed before and during the winter. The total measurement line was 160 m, and the damage was present along the line where the resistivity values under the defective pavement varied from 390 to 980 Ω·m before the winter season, as shown in the profile in Figure 12(a), and from 350 to 880 Ω·m during the winter season, as shown in the profile in Figure 12(b). Figure 13 presents the results of core sampling on the road pavement, revealing the existence of a 4-cm-thick layer of bituminous material, framed in blue in the figure, resting on gravelly alluvial material.


The examination of the visual inspection and the results obtained revealed several important points. First, there is a decrease in the surface resistivity values in the profile in Figure 12(a) compared to the profile in Figure 12(b) during the winter season. This decrease is attributed to water infiltration into the pavement through surface and edge cracks, facilitated by the road pavement support soil, consisting of fractured limestone, which allows infiltrated water to circulate. Additionally, the current state of asphalt pavement, marked by advanced deterioration, can also be explained by the insufficient thickness of the asphalt layer, which proves ineffective in resisting deterioration.
4.4. Road Section 4
Figure 14 presents the results of resistivity measurements carried out on asphalt pavement, showing advanced cracking perpendicular to the road axis. Measurements were performed before and during winter. The total measurement line was 160 m, with cracks on the asphalt pavement present at the beginning of the line over a length of 40 m, as well as in the center of the line between 70 and 110 m. Figure 15 presents the results of core sampling on the road pavement, revealing the existence of a 12-cm-thick layer of bituminous material, framed in blue in the figure, resting on a subbase of gravel materials.


The analysis of the visual surveys and the results detailed above reveal several important points. Initially, the surveyed terrain displayed a substantial degree of homogeneity across a considerable surface distance, with heterogeneity appearing notably around 100 m from the pseudosection outset, as depicted in Figure 14(b), corresponding to the location of the surface water drain. Resistivity values beneath the defective pavement section range from 21.4 to 22.0 Ω·m whereas the nondefective section exhibits higher values ranging from 22.0 to 30.8 Ω·m. Notably, there is a drop in apparent resistivity values during the winter season shifting from 22.0–30.8 to 21.4–26.9 Ω·m attributed to water infiltration through surface and edge cracks. This infiltration leads to moisture accumulation in the road pavement support soil, which is primarily composed of clayey loam. The existing condition of the asphalt pavement, marked by advanced cracking, can be attributed to low resistivity values, which create conditions conducive to pavement degradation, particularly near the surface water drainage points. Furthermore, the current asphalt layer thickness is insufficient for an effective damage resistance. Conversely, undamaged pavement areas depend on their location, which minimizes surface water accumulation, ensures rapid rainwater drainage, and reduces the risks of infiltration and pavement degradation.
4.5. Comparative Analysis of Electric Resistivity Values
Tables 1 and 2 summarize the results obtained from the two geophysical campaigns and show that variations in electrical resistivity are associated with different types of pavement failure and seasonal changes. In particular, the examination of Table 1 enabled us to distinguish between areas showing deterioration and those in good condition. More specifically, we observed significant differences between the electrical resistivity values of the defective and nondegraded areas in Road Sections 1 and 4. In Road Section 1, the electrical resistivity values in the defective areas were considerably lower than those in the nondefective areas. This difference can be attributed to the presence of premature cracking, which cannot be easily detected by visual inspection. On the other hand, in Road Section 4, the cracks were of an advanced nature, which may explain the relatively low values of electrical resistivity in both defective and nondefective areas. This finding suggests a more advanced degradation of the road structure. The results in Table 1 demonstrate that 2D ERT can be used to detect defect areas, which is consistent with the previous studies by Orlando et al. [4], Haryati and Alicia [7], and Neyamadpour [8]. Subsequently, in our study, we observed that areas with lower resistivity values were more susceptible to damage.
| Type of cracks | Resistivity range (Ω·m) | ||
|---|---|---|---|
| Defect crack area | Noncrack area | ||
| Road Section 1 | Premature longitudinal and transverse cracking | 50–95 | 150–300 |
| Road Section 4 | Advanced cracking perpendicular to the road axis | 21–22 | 22–31 |
| Type of cracks | Resistivity range (Ω·m) | ||
|---|---|---|---|
| Before winter | During winter | ||
| Road Section 1 | Premature longitudinal and transverse cracking | 150–350 | 50–90 |
| Road Section 2 | Raveling on asphalt pavement and advanced cracks along the road axis, with erosion of the asphalt pavement at the roadside | 400–1400 | 150–700 |
| Road Section 3 | Advanced cracks parallel to the road axis, with erosion of the asphalt pavement at the roadside | 390–980 | 350–880 |
| Road Section 4 | Advanced cracking perpendicular to the road axis | 22–31 | 21–27 |
Table 2, on the other hand, highlights the different types of cracks present in four distinct road sections as well as the variations in electrical resistivity before and during the winter season. A clear observation is the decrease in the electrical resistivity values over the winter in all road sections. In particular, Road Sections 1 and 2 experienced significant decreases in electrical resistivity during winter. For Road Section 1, this decrease is explained by the presence of premature cracks developing in the bituminous surface of the road pavement underlining the urgency of maintenance work to prevent major deterioration of the road surface under the impact of winter cycles. Similarly, the marked decrease in electrical resistivity values in Road Section 2 can be explained by the advanced state of cracking of the limestone, which forms the support soil for the pavement, as well as by the advanced deterioration of the bituminous surface of the road pavement, encouraging the infiltration of rainwater. Given its advanced state of deterioration, water drainage works and the renewal of pavement structures are required. Road Section 3 shows a relatively moderate reduction in electrical resistivity values during winter, but resistivity values remain high, indicating that the road pavement support soil withstands winter conditions well. However, the current state of deterioration and cracking of the asphalt mix suggests that the current pavement structure is unsuitable for traffic on such road. Finally, in the case of Road Section 4, the decrease in electrical resistivity values was relatively small in winter, with generally low values. This reduction is attributable to the advanced state of deterioration, which favors the infiltration of rainwater in winter, increasing the humidity of the supporting soil composed of clayey silts. Consequently, maintenance work is required, including reinforcement of the support soil and renewal of the road surface.
The results in Table 2 reveal a correlation between internal soil humidity due to seasonal variations and road infrastructure defects, which confirms the results of previous studies. In particular, the study by Jackson et al. [9] highlighted this correlation by examining the evolution of the internal soil humidity of a road embankment, monitored using resistivity measurements taken periodically in 2D. These measurements revealed the instability of the road embankment owing to seasonal humidity dynamics. In parallel, studies by Chambers et al. [6] and Nobahar et al. [12] also identified a similar relationship by studying the internal humidity dynamics of an embankment, recorded periodically using ERT measurements. In addition, Alam, Ahmed, and Alam’s [22] team conducted ERT tests on the pavement side slope to study the seasonal distribution of soil moisture. Their monthly tests from 2015 to 2017 revealed higher resistivity values from May to October (dry season) and lower values from November to April (wet season). The lower resistivity values observed during the wet season were due to moisture intrusion into the pavement through edge cracks, as confirmed by field visits during the study.
In summary, lower resistivity values are often associated with pavement cracking and the winter season, which may indicate problems related to water infiltration and/or alterations to the pavement structure. These results underline the potential of electrical resistivity measurements as a tool for evaluating pavement conditions and monitoring the impact of the environment, while also offering guidance for maintenance and repair decisions.
5. Conclusion
In conclusion, this study successfully demonstrated the utility of ERT in assessing the condition of asphalt pavements in Morocco. Our research revealed a direct correlation between soil electrical resistivity and the type and extent of pavement cracking, as well as the measurement periods before or during the winter season. During the winter season, a decrease in the electrical resistivity values is observed, which is influenced by factors such as pavement cracking, water infiltration during winter, and soil characteristics supporting the asphalt pavement. By integrating the 2D electrical tomography method with visual inspection and pavement coring, we gained a deeper understanding of the factors contributing to road pavement degradation, offering valuable insights for targeted maintenance and repair efforts, especially in areas with premature cracking and advanced deterioration.
The ERT campaigns, conducted at various times on road sections, enable nondestructive assessment and monitoring, facilitating the early detection of vulnerable areas susceptible to deterioration and supporting proactive maintenance, thus reducing costs and enhancing road pavement durability and safety for users. It is worth noting that while ERT is valuable, it needs to be complemented by other geophysical prospecting methods, such as configuration for a comprehensive evaluation of the component interfaces of road pavements.
Conflicts of Interest
The authors declare no conflicts of interest.
Funding
The authors received no specific funding for this work.
Acknowledgments
The authors are grateful to the Laboratory of Mechanics, Mechatronics, and Control at ENSAM-Meknes, Moulay Ismail University, Meknes, for their invaluable support in this work.
Open Research
Data Availability Statement
The corresponding author guarantees the availability of the data that were used for the conduct of this study.


