Improved Monitoring of Wind Speed Using 3D Printing and Data-Driven Deep Learning Model for Wind Power Systems
Abstract
This study presents a novel method for airflow rate (i.e., wind speed) sensing using a three-dimensional (3D) printing-assisted flow sensor and a deep neural network (DNN). The 3D printing of thermoplastic polyurethane can realize multisensing devices for different flow rate values. Herein, the 3D-printed flow sensor with an actuating membrane is used to simultaneously measure two electrical parameters (i.e., capacitance and resistance) depending on the airflow rate. Subsequently, a data-driven DNN model is introduced and trained using 6,965 experimental data points, including input (resistance and capacitance) and output (airflow rate) data with and without external interferences during capacitance measurements. The mean absolute error (MAE), mean squared error (MSE), and root mean squared logarithmic error (RMSLE) measured using predicted flow rate values by the DNN model with multiple inputs are 0.59, 0.7, and 0.18 for continuous test dataset without interference and 1.16, 3.95, and 0.73 for test dataset with interference, respectively. Compared to the prediction results using single-input cases, the average MAE, MSE, and RMSLE significantly decrease by 70.37%, 88.74%, and 72.26% for test datasets without interference and 51.91%, 53.01%, and 12.20% with interference, respectively. The results suggest a cost-effective and accurate sensing technology for wind speed monitoring in wind power systems.
1. Introduction
The amount of electricity generated by a wind power system highly depends on the local wind speed. In general, the wind speed relies on several factors such as location of a wind turbine, obstructions (trees or buildings nearby), and installation height. Because the electricity generated by a wind turbine is generally proportional to the wind speed [1, 2], it is important to precisely measure the wind speed (or flow rate) potential before installing a wind power system to make sure it will be financially worthwhile [3]. For facile fabrication of flow monitoring sensors, three-dimensional (3D) printing, also known as additive manufacturing, has been extensively studied and employed in various fields in the past few decades owing to its versatile, simple, and cost-effective fabrication methods. Therefore, various printing strategies, such as stereolithography [4, 5], fused deposition modeling (FDM) [6, 7, 8], selective laser sintering [9, 10], and digital light process [11, 12], have been developed to meet the increasing demand. Compared to traditional fabrication processes, 3D printing-based methods have been considered future manufacturing technologies owing to the direct printing of microscale patterns and atypical morphology, which allows customized production without additional equipment. Direct 3D printing methods have been adopted for manufacturing functional devices, such as sensors [8, 13, 14], microfluidic chips [6, 15, 16], and actuators [17, 18, 19], using printable material with different mechanical properties (e.g., elastic modulus, thermal conductivity, and electrical conductivity). Thermoplastic polyurethane (TPU) filaments have been widely used for flexible structures because of their biocompatibility [20, 21] and rubber-like characteristics without additional chemical cross-linking [22]. Consequently, 3D soft material printing technology can offer innovative and novel fabrication processes for complex morphologies for future applications, such as soft robotics, grippers, actuators, and sensors.
Flexible polymer-based functional devices find applications in strain and pressure sensors. In addition, unlike conventional rigid sensors, soft devices exhibit deformable characteristics that depend on the target. Thus, by combining FDM or direct ink writing methods, efforts to expand the soft device applications are being made [8, 23]. However, soft material-based devices have two fundamental drawbacks: nonlinearity and hysteresis [24, 25, 26]. Therefore, further theoretical and experimental approaches are required to obtain reliable results.
With the development of artificial intelligence, deep learning-based data-driven models are being considered for complicated nonlinear problems [24, 27]. Deep learning models have recently gained remarkable success in numerous applications, such as natural language processing [28, 29], computer vision [30, 31], and regression analysis [32, 33]. Notably, deep neural networks (DNNs) with multilayer architectures have been widely applied for regression analysis of experimental data [33, 34]. The data-driven model suggests nonlinear relationships between the input and output data through multiple nonlinear transformations of the stacked layers. In addition, there have been numerous efforts to enhance the accuracy of deep learning models; these efforts include selecting an effective architecture [24, 35, 36], multiple sensor data fusion [36, 37], and hyperparameter tuning [33, 38]. Thus, deep learning regression models can play a pivotal role by integrating with soft material devices via appropriate supervised learning techniques in real applications.
Among various functional devices, flow rate sensors are essential in diverse industries for environmental monitoring. The flow sensors can be categorized into thermal and nonthermal types [39, 40]. Among them, thermal-type flow sensors evaluate changes in heat distribution affected by the mass flow rate using heating elements, thus offering the advantages of high accuracy and sensitivity. In contrast, nonthermal-type flow sensors use mechanical/electrical signals (e.g., change in pressure [41, 42], resistance [43, 44], and capacitance [45, 46, 47]) without additional power-consuming heaters for measurement via manipulated structures [41, 42] or moving components, such as cantilevers [43, 44] and paddles [45]. Traditionally, the flow sensors have been implemented using microelectromechanical system (MEMS)-based processes [39, 40, 45, 46]. However, such conventional methods necessitate intricate fabrication steps, a clean room environment, and hazardous chemical treatments, leading to high production costs. Therefore, the development of low-cost and accurate flow sensing systems through a simplified manufacturing process is highly required.
To date, various efforts to monitor the fluid flow have been conducted employing novel fabrication methods and deep learning approaches. For example, Daniel et al. [48] demonstrated a hot wire anemometer using a complete 3D printing method, while further optimization was required. In addition, Wang et al. [49] utilized machine learning models including the DNN algorithm to predict the oil/gas/water three-phase flow rate by combining various sensing parameters. Furthermore, Manami et al. [50] also utilized deep learning models to measure the two-phase flow rate with a measured dataset comprising 4,112 experimental samples.
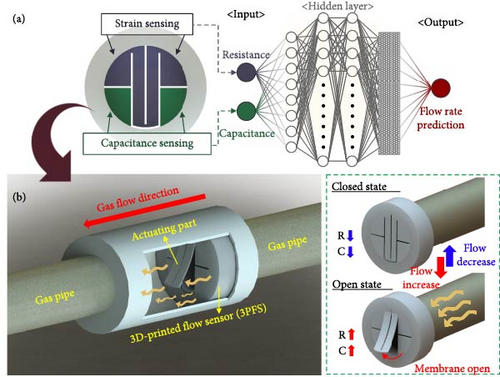
In this study, a combination of a 3D-printed flow sensor (3PFS) with a deep learning model was implemented for airflow rate monitoring. The overall principle of the proposed method is illustrated in Figure 1. The fabricated 3PFS containing strain (blue area) and capacitance (green area) sensing areas is shown in Figure 1(a). As the actuating part in the middle moves due to the change in flow rate, the changed resistance and capacitance are obtained simultaneously. The 3PFS can be adapted to the shape or size of any gas pipe by changing the 3D printing design, as shown in Figure 1(b). As the airflow bends the actuating part, the resistance increases owing to the generated cracks on the conductive layer (i.e., strain sensor). Simultaneously, as the actuating part that interferes with the electric field of the electrodes moves away, the coplanar capacitance increases. Finally, the flow rate is predicted using a DNN regression model, which is trained with the experimentally acquired dataset, and the prediction performance is compared under different input conditions. In addition, the transient sensing performance with and without external interference from adjacent objects is compared to confirm robust prediction. Consequently, this study aims to develop cost-effective flow sensor fabrication, which can measure different types of signals, and DNN-based sensor fusion technology to enhance prediction accuracy. The findings support a novel fabrication and analysis method that combines 3D printing and artificial intelligence for diverse gas-flow sensing applications.
2. Sensing Principle
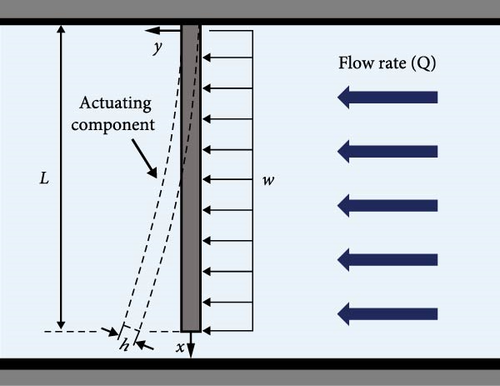

Therefore, the resistance change of the conductive layer on the bent membrane in response to the external fluid flow can be estimated as a function of fluid velocity U according to Equations (4) and (8).
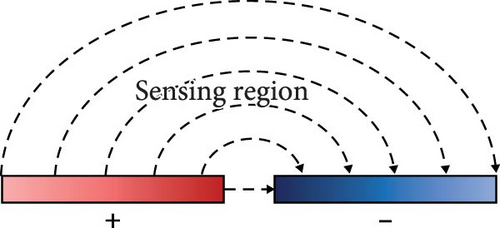
In addition, among the various conventional nondestructive evaluation (NDE) methods, the coplanar capacitive sensing method has been considered one of the effective techniques with diverse advantages, including rapid response, nonradiative, and noninvasive characteristics [56]. Figures 2(b) and 2(c) illustrate basic structures of the parallel plate and coplanar capacitance. In the case of parallel capacitance, most of the electric field is generated uniformly between the two electrodes. On the other hand, a nonuniform fringing field, which can be utilized for NDE, is also generated at the edges, as shown in Figure 2(b). However, as the parallel type requires double-sided access to the target and the strong electric field region, it is not suitable for NDE in practical applications.
As shown in Figure 2(c), coplanar-oriented capacitive sensing approach can be utilized for NDE. The coplanar capacitors allow the fringing effect to dominate electric field formation, providing a larger probing area and single-sided access. When an object influencing the formation of an electric field in the sensing region exists, NDE can be performed through the variation of capacitance values. Therefore, the coplanar capacitive sensing method can be applied to proximity sensors [57] by detecting changes in permittivity.
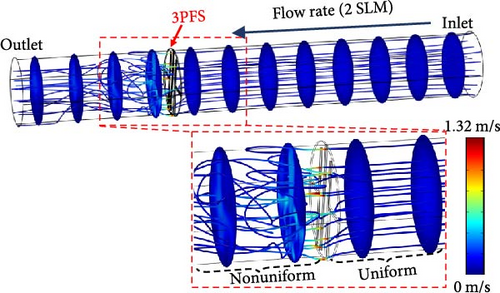
Furthermore, to investigate the velocity and streamline changes during the fluid flow before and after passing through the 3PFS, a computational simulation was performed by using COMSOL Multiphysics® software with the fluid-structure interaction module. For the inlet boundary condition, 2 standard liters per minute (SLM), which corresponds to ~0.092 m/s, was applied to the inlet boundary condition. As shown in Figure 3, while the velocity may locally increase as it passes through internal structures, it should be noted that in incompressible flow, the flow rate passing through remains constant due to the continuity equation. Lastly, as the nonuniform streamline after passing through the 3PFS, an additional flow conditioner should be employed to correct the changed flow profile for a reliable flow field at the outlet for future applications.
3. Fabrication
Figure 4(a) illustrates the representative design parameters of the 3PFS. The gap between the patterns (g), length (L), and width (W) of the moving TPU membrane part were selected as 0.5, 19.13, and 6.5 mm. The sensor body has outer diameter, inner diameter, and height of 31.5 mm, 21.5 mm, and 10 mm, respectively, and the membranes for actuation and electrodes were 0.3-mm thick. Therefore, the flexible TPU membrane can freely move in response to the fluid flow. In addition, the changes in resistance due to strain on the surface and the simultaneous variations in coplanar capacitance resulting from the membrane movement can be measured separately. The geometrical parameters of the TPU substrate (i.e., membrane thickness and electrode area) were selected and designed considering the ease of 3D printing and inlet pressure change by comparing with the commercial orifice structures [61, 62] (Figures S1 and S2).
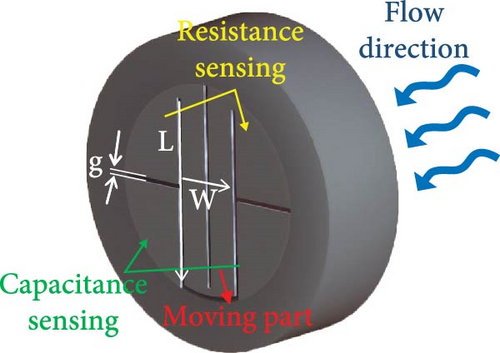
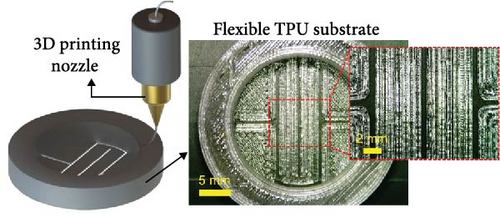
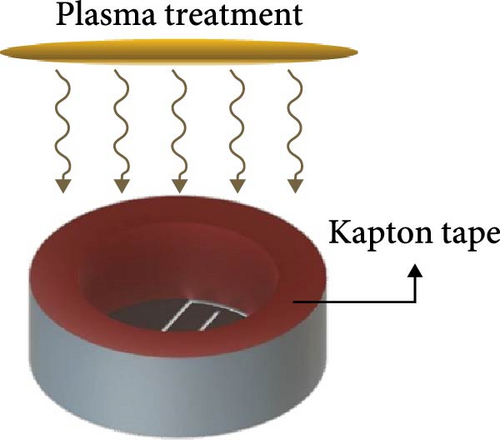
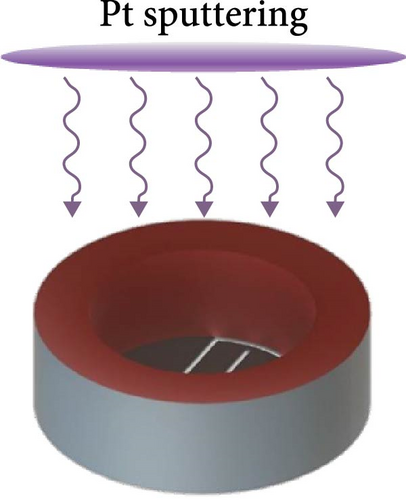
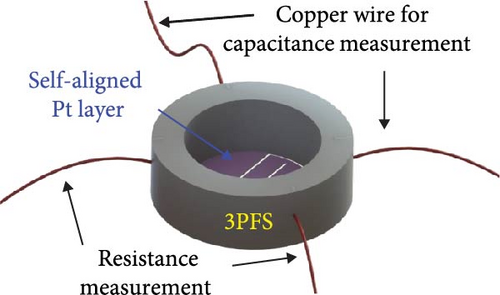
The 3PFS fabrication comprises four main steps: 3D printing of the TPU substrate, plasma treatment, metal sputtering for electrodes, and electrical connection with copper (Cu) wires. Figure 4(b) shows the printing process of the sensor substrate containing the main (i.e., membrane for actuation and electrodes) and body parts (i.e., flow channel for connection). The two-layer printing of the main part showed stable printing results. It should be noted that the size or shape of 3PFS can be easily modified by the additive manufacturing. Herein, an FDM-type 3D printer (Guider IIs, Zhejiang Flashforge 3D Technology Co., Ltd.) with a flexible TPU filament was used for printing. The printing conditions included filling density, printing speed, nozzle temperature, bed temperature, and layer thickness of 100%, 20 mm/s, 230°C, 60°C, and 0.15 mm, respectively. Subsequently, the main part was exposed before metal deposition by attaching Kapton tape onto the sensor body, as shown in Figure 4(c). No additional complex masking process is required because the required shape and patterns are formed during the printing process. Subsequently, oxygen plasma treatment for 30 s was performed for better adhesion, followed by a Pt sputtering process with a thickness of 20 nm, as depicted in Figure 4(d). Thus, separate strain and capacitance sensing parts were naturally formed by the 0.5 mm gap between the electrodes, thus allowing independent data collection. Finally, Cu wires were used to provide external electrical access to the self-aligned Pt electrode layer, as shown in Figure 4(e). The fabricated 3PFS via 3D printing and sputtering, replacing the traditional MEMS processes and complicated masking processes or lithography, demonstrates a facile and rapid fabrication method.
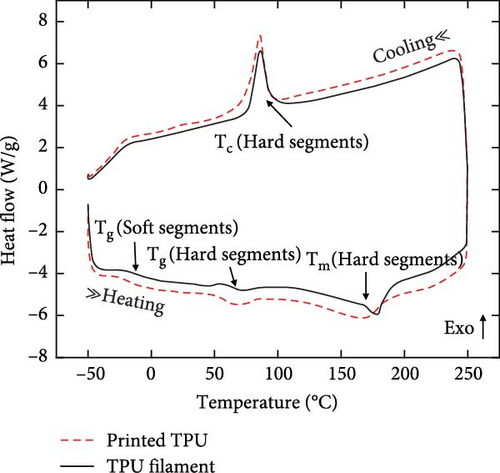
To characterize the thermal history of TPU filament and 3D-printed TPU, differential scanning calorimetry (DSC) measurements were conducted using a differential scanning calorimeter (DSC Q20, TA Instruments). The thermal cycle of heating–cooling process was performed for each sample with a heating and cooling rate of 20°C/min from −50 to 250°C under a nitrogen atmosphere. During the first thermal cycle, the glass transition (Tg), melting (Tm), and crystallization peaks (Tc) were obtained from the DSC thermograms of the two TPU samples, as seen in Figure 5. Notably, two distinct Tg values were identified for each sample, corresponding to soft and hard segments of the TPU [63, 64]. The Tg values for the soft and hard segments of the TPU filament were evaluated to be approximately −21.3 and 72°C, respectively. Similarly, the printed TPU exhibited Tg values of approximately −23.3 and 69°C for soft and hard segments, respectively, indicating slight variations from the filament. In addition, endothermic peaks observed at approximately 175.5 and 174.6°C during the heating process correspond to the Tm for the TPU filament and printed TPU, respectively. During the cooling, a crystallization peak was consistently observed at approximately 87°C across samples. It is noteworthy that the 3D printing process affected only minor shifts, within 3°C, in all observed endothermic and exothermic peaks. Consequently, the TPU-based 3PFS can be reliably utilized within ambient temperature conditions of 5–40°C (between the two Tg points) without significant change in the mechanical properties.
4. Experimental Data Acquisition
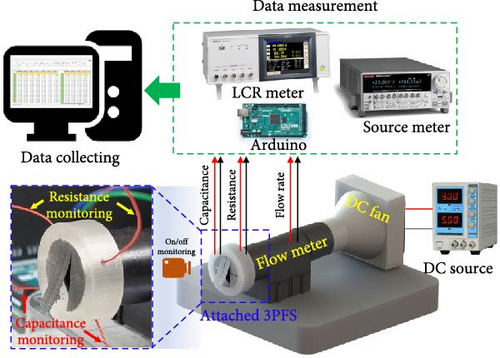
A schematic of the experimental setup to build the 3PFS datasets is illustrated in Figure 6(a). The fabricated 3PFS was fixed to a commercial flow meter (PMF4005V, POSIFA Microsystems, Inc.) to obtain the airflow rate and corresponding resistance and capacitance changes simultaneously. In addition, the actuating performance, which depends on the flow rate, was captured using optical camera monitoring. As shown in the magnified view (see blue dotted box), the resistance and capacitance were measured using the upper and lower two wires, respectively. With the flow meter fixed to the test stage, the direct current (DC) controllable fan at the inlet generates various flow rates by randomly changing the DC voltage supply (TDP-305A, Toyotech LLC). The flow rate, capacitance, and resistance were measured at intervals of 0.22 s using Arduino Mega 2560, inductance, capacitance, and resistance (LCR) meter (IM3536, HIOKI E.E. Corporation), and source meter (SMU 2614B, Keithley Instruments Ltd.), respectively. Finally, the evaluated data were accumulated at room temperature condition with small deviation for DNN model training.
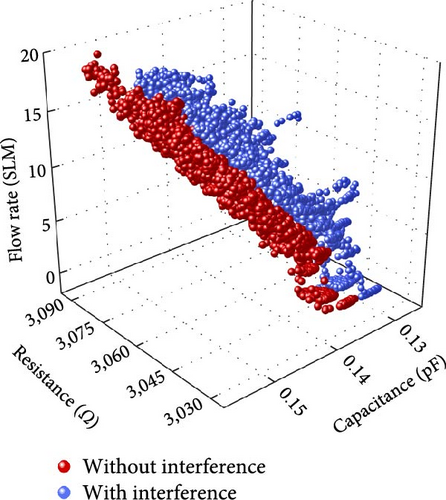
The resistance and capacitance at the 0–19.65 SLM flow rate range (i.e., output data) were measured for the dataset. Sufficient prestretching was conducted in advance for crack-based strain sensing by inducing initial crack propagation. In the coplanar capacitance sensor, the values can be distorted by interference from other external objects affecting dielectric constant. Therefore, a commercial mobile phone and a human body were randomly placed near the 3PFS during data acquisition to consider interference affecting precise capacitance sensing in real applications. Both capacitance and resistance exhibited an increasing trend with an increasing flow rate (Figure 6(b)). However, unlike resistance, the capacitance showed a decreased value at the same flow rate by interference from the adjacent objects. In conclusion, a total of 6,965 data points, wherein 3,299 and 3,666 data points correspond to with and without interference, respectively, were successfully obtained. In addition, stepwise increasing and decreasing continuous datasets were prepared to evaluate and compare the model performances.
5. Data Preparation and DNN Model
Figure 7 shows the DNN model architecture for airflow rate prediction and training results for various input types. Python-based open-source frameworks, such as Scikit-learn, Keras, and TensorFlow, were used to realize effective data preprocessing, deep learning model configuration, and supervised learning. In addition, Google Colaboratory Pro was used as the Python cloud computing platform. For data preprocessing, input and output data were scaled between 0 and 1 using MinMaxScaler [65] through the Scikit-learn library, and the time interval was matched during the data cleaning process.
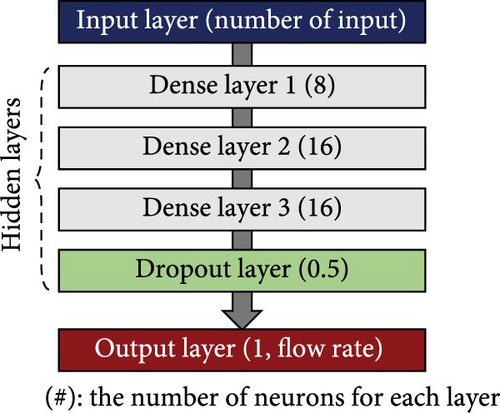
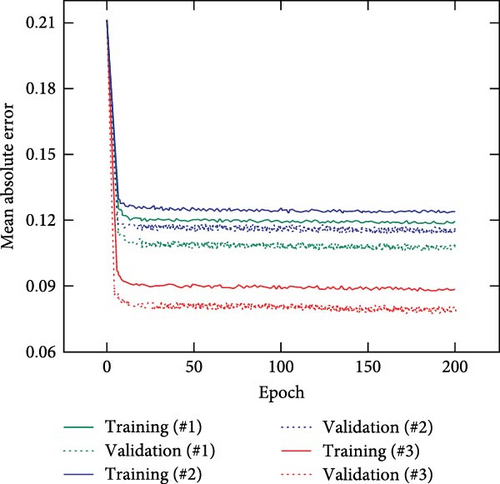
Figure 7(a) illustrates the multilayer DNN regression model with the number of neurons for airflow rate prediction. Herein, the prediction performances were compared for three conditions depending on the input cases: only capacitance, only resistance, and both (hereafter, cases #1, #2, and #3, respectively). Therefore, the unit number of the first layer was selected as one or two for single or dual inputs, respectively. The other regression layers consisted of three dense (i.e., fully connected) layers with sigmoid activation functions. Furthermore, a dropout layer [37] with a ratio of 50% was added to prevent overfitting in the training dataset. Finally, the flow rate was predicted using the 3PFS based on the electrical responses.
For algorithm training, the prepared data points were randomly split in the ratio of 7 : 1.5 : 1.5 for the training, validation, and test datasets (4,875; 1,045; and 1,045, respectively) for each repeated training. Furthermore, a mean absolute error (MAE), sigmoid, 0.01, and 200 were selected for the loss function, activation function, learning rate, and epochs, respectively. Figure 7(b) shows five average training histories with cases #1, #2, and #3 as a function of the epoch. Although the training and validation losses converged for each test dataset in all cases, case #3 exhibited a 25% and 33% decrease in validation loss compared to cases #1 and #2, respectively.
6. Results
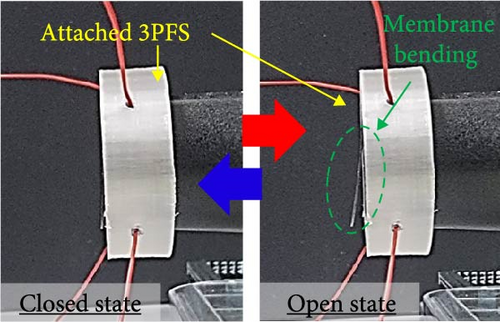
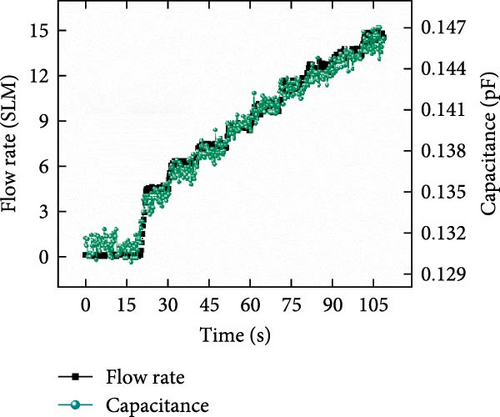
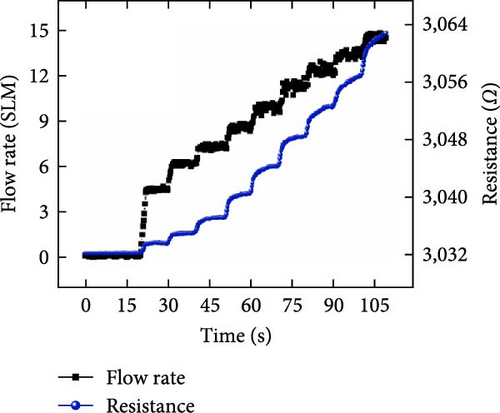
To investigate the sensing principle of the 3PFS, optical and scanning electron microscopy (SEM) images were captured. The actuating membrane was naturally bent by airflow (Figure 8(a)). In addition, the membrane recovered its initial position (i.e., closed state) when the DC fan was turned off. Thus, the flexible TPU membrane ensured a reversible sensing performance at various flow rates. Furthermore, the capacitance between the electrodes changed owing to the conductive membrane, which hinders electrical field formation. SEM images were captured (Figure 8(b)) to demonstrate the crack-based resistance change caused by the bent membrane. Compared to the initial state, the cracks were formed perpendicular to the bending direction and ensured increased resistance owing to strain. Additionally, the capacitance and resistance changes caused by the continuously increasing flow rate were evaluated, as shown in Figures 8(c) and 8(d). Although the capacitance follows a similar trend as the flow rate, a noticeable noise was observed. Furthermore, it should be noted that the coplanar capacitance is easily influenced by external interference from adjacent objects (such as the human body, electronics, and metal). Moving objects near the sensors can disrupt the electric field generated by this type of capacitance (Figure 2(c)), causing a change in capacitance value [60, 66, 67]. In contrast, the resistance signal showed disadvantages in delay time for prediction, although a similar increasing tendency was observed with low noise. The response and recovery delays occur due to the viscoelastic nature of the TPU substrate [53, 54, 68], a common characteristic of other polymer-based strain sensors. In addition, the rough surface of the 3PFS, created by 3D printing (Figure 4(b)), might affect the time delay in crack propagation and recovery. Thus, it is expected that the sensor fusion of two different data can enhance the prediction accuracy.

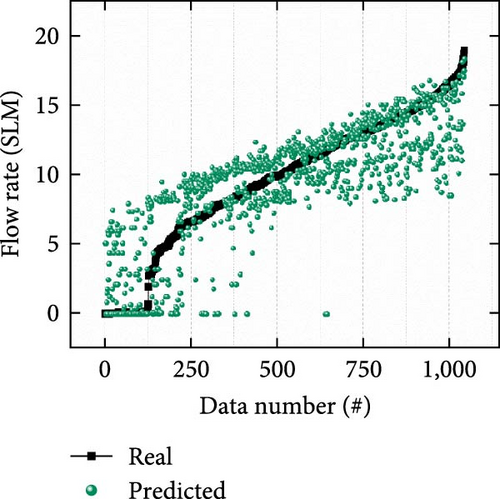
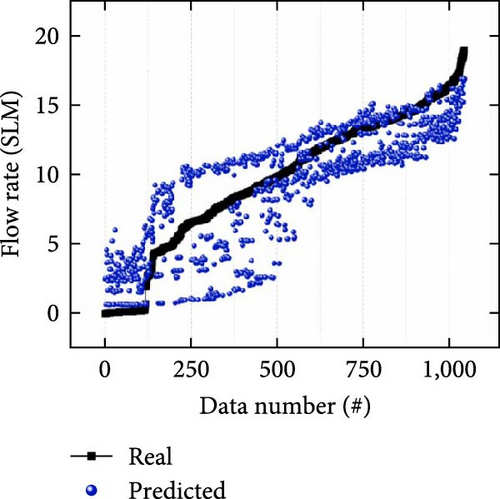
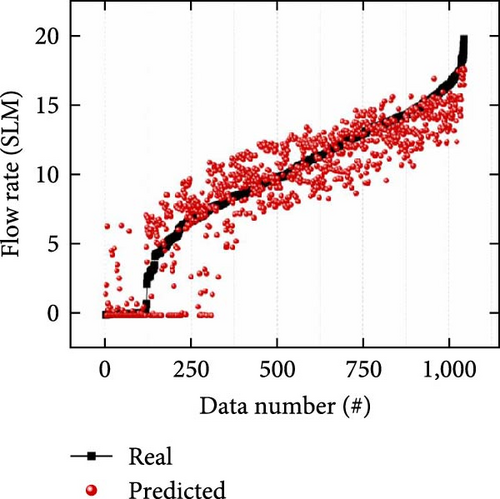
Figures 9(a), 9(b), and 9(c) show scatter plots of the flow rate prediction performance using the 1,045 test data points with different input conditions depending on the type of used input features (i.e., capacitance only, resistance only, and capacitance and resistance) for cases #1, #2, and #3, respectively. The predicted results (green and blue dots) were relatively distant from the actual flow rates (black line). In particular, the prediction accuracy in case #1 was lower in the entire flow range owing to external interference (Figure 9(a)). It is because noise and interference caused changes in the coplanar capacitance during the input data acquisition step, which in turn affected the accuracy of the predictions. Furthermore, inaccurate prediction results occurred under case #2 owing to the complex influence of the delay time and hysteresis of the soft material in a relatively low flow rate range (less than approximately 10 SLM; Figure 9(b)). However, in case #3, the prediction results (red dots) were relatively close to the actual value in the test range (Figure 9(c)), thus indicating improved model performance as compared to those of the single-input models.

To demonstrate the potential of 3PFS for future applications, its prediction accuracy must be evaluated for continuous flow rate changes. Therefore, additional test datasets with and without external interference were conducted, and the prediction performances were compared for single and dual inputs. Figures 10(a), 10(b), and 10(c) show the test results evaluated using the test dataset without interference for cases #1, #2, and #3, respectively. When predicting the flow rate using only the capacitance signal (case #1), the output data showed different values to the real value, and significant noise was observed in the overall results. The fluctuations observed might have resulted from the original signal noise of the capacitance values in the training dataset containing interference effects being applied to the prediction of the data-driven model. In addition, the accuracy was found to be lower in the low flow rate region. Case #2 exhibited low accuracy owing to response delay of the resistance signal despite low noise. In contrast, case #3 exhibited improved prediction accuracy, with compensated noise and response delay compared to the single-input cases. As seen in the magnified plot of Figure 10, when the external flow rate is removed at ~90.5 s (~6.83 SLM), case #3 demonstrated a reduction in noise and an improved recovery time (~1.138 s) compared to cases #1 and #2, respectively.
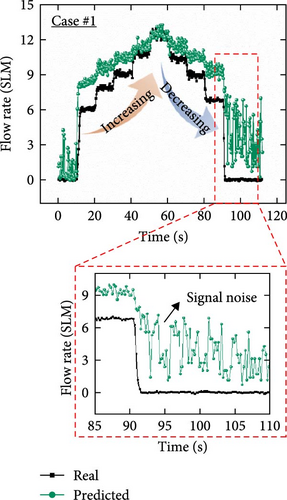
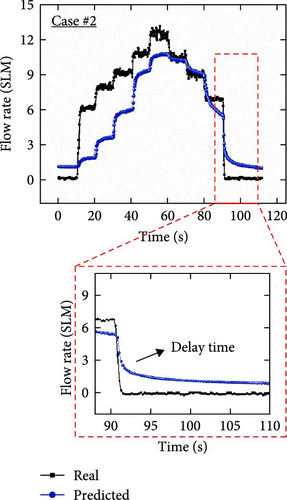
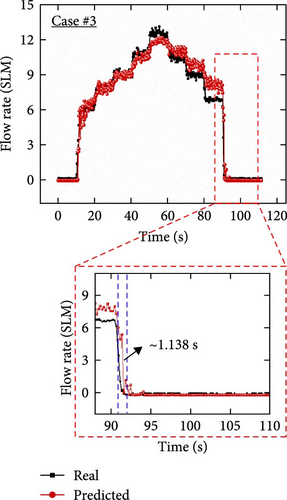
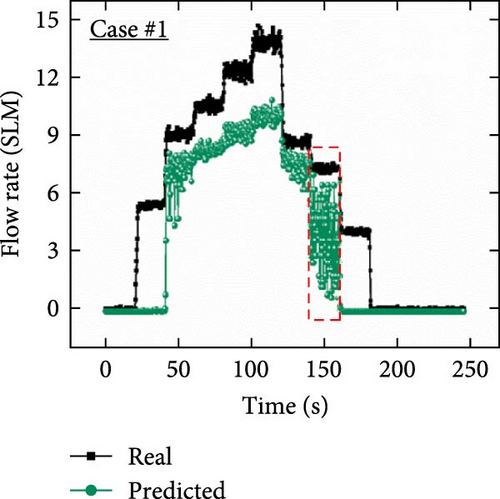
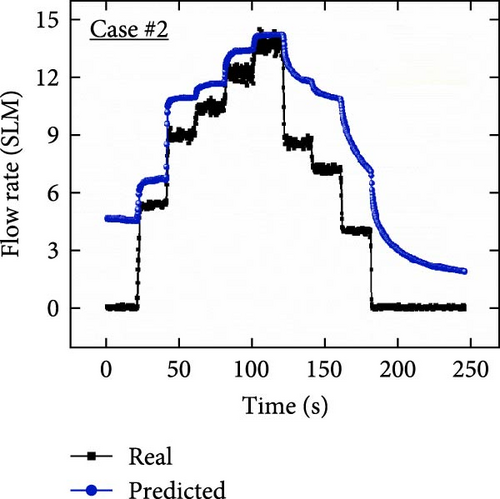
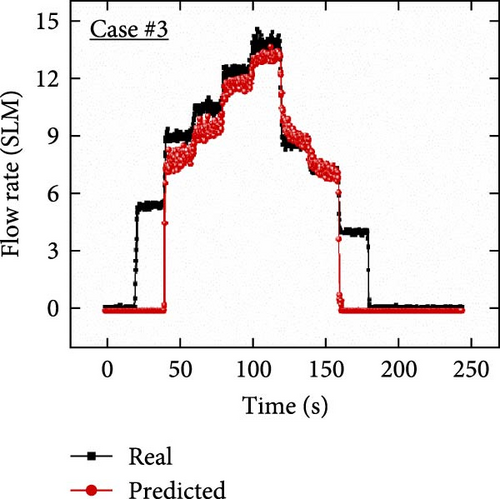
Furthermore, trained models using the three cases (i.e., #1, #2, and #3) were investigated using another continuously increasing and decreasing flow rate dataset affected by external interference (Figures 10(d), 10(e), and 10(f)). Because the external interference decreased the overall capacitance level, the predicted results in case #1 predicted decreased values than the actual values. It can be seen from Figure 10(d) that the actual value is ~7.2 SLM at ~140–160 s, and the inaccurate prediction result is ~3.8 SLM. In addition, significant fluctuations were observed in the predicted results through the entire prediction owing to the external interference effect on the training dataset, which is a weakness of the coplanar capacitance measurement. In case #2, because the resistance signal was not directly affected by external interference, the overall prediction results showed negligible noise in the continuous signal, as shown in Figure 10(e). However, the predicted values did not converge and exhibited inaccurate results because of the delay time of the fabricated resistive soft strain sensor during increasing and decreasing airflow rates. In contrast, the predicted results in case #3 showed notably enhanced sensing results compared to the single-input conditions, as depicted in Figure 10(f). In addition, considering the results in the range of 40–160 s, the predicted transient results exhibited less fluctuation in the same range than that of case #1 and rapidly converged by reducing the response time compared to case #2. Although a sensing error was observed in the low flow rate region (smaller than ~5.3 SLM), the accuracy can be enhanced by a reinforced dataset considering low flow rate cases and improving the DNN architecture with advanced training algorithms. These results demonstrate that dual input sensor fusion can enhance prediction performance by eliminating the disadvantages of individual electrical signal features.
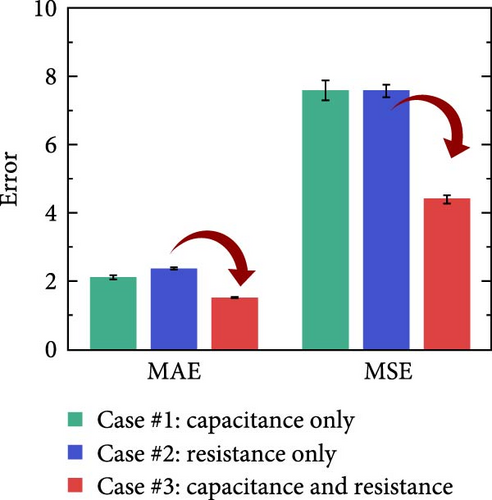
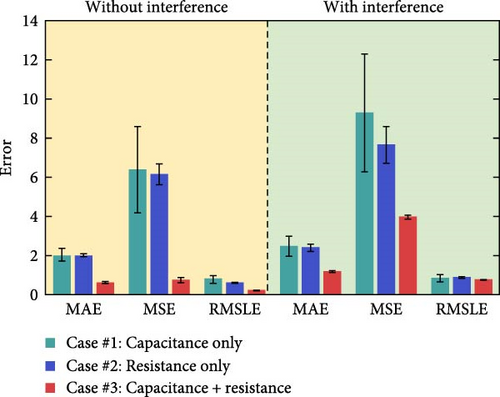
Furthermore, the results in Figure 10 were compared by calculating regression metrics using Equations (11), (12), and (13) from the differences between the predicted and actual values according to the various input cases for continuous 491 and 1,080 test data points of both conditions, respectively. The average MAE, MSE, and RMSLE of five different training results with the newly shuffled datasets were calculated to characterize the sensing results of the continuous test datasets quantitatively. The MAE, MSE, and RMSLE from the DNN model applying case #3 were evaluated as 0.59, 0.7, and 0.18 for continuous test datasets without interference and 1.16, 3.95, and 0.73 with interference, respectively (Figure 11). Therefore, the developed model using sensor fusion demonstrated a good prediction performance with a small deviation from the actual flow rate, few outliers, and low relative error as evident from the low MAE, MSE, and RMSLE values. Moreover, the error values of case #3 were much smaller than those of cases #1 and #2 in all evaluations. In the absence of external interference, case #3 showed decreased MAE, MSE, and RMSLE of ~70.37%, 88.74%, and 72.26% on average, respectively, compared with cases #1 and #2. Furthermore, using the test dataset with interference, a 51.91%, 53.01%, and 12.20% decrease in MAE, MSE, and RMSLE, respectively, were exhibited compared to cases #1 and #2 on average. Although the difference between MAE and MSE increased owing to the prediction error in the low flow rate region, sensor fusion improves the sensing performance. Consequently, for data-driven DNN regression models with a single input, the predicted output results reflect and depend on the characteristics of the initial responses. In addition, R2 scores for the test datasets with and without interference were evaluated as 0.6736 and 0.6065 for case #1 on average, respectively. For case #2, the scores were 0.6854 and 0.6762, respectively. In contrast, case #3 showed relatively improved values of 0.9639 and 0.8331 for each test dataset. Thus, various input combinations via sensor fusion can reduce sensing errors and enhance the prediction performance. In summary, the DNN-assisted 3PFS is an accurate flow rate sensing system that simultaneously uses multiple electrical properties as input features. Notably, the novel sensing system can overcome the disadvantages of capacitances (e.g., signal noise and external interference) and resistance (e.g., delay time) sensing for reliable and stable results.
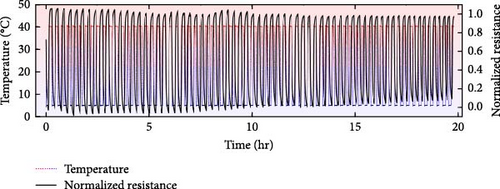
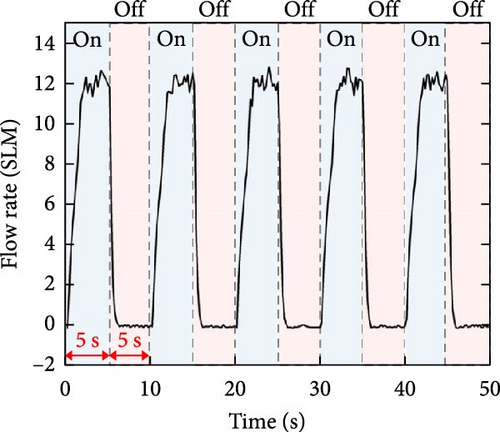
To confirm the long-term reliability of the proposed 3PFS, the temperature stability of the TPU material and mechanical durability of the actuating membrane should be also demonstrated. Therefore, the signal changes were measured under harsh conditions considering wind power system environments [70, 71] such as temperature (5–40°C) and airflow cycles. Figure 12(a) shows the normalized resistance change in the strain-sensing region in response to the dynamic temperature changes. The 3PFS was subjected to 68 temperature cycles between 5 and 40°C (dotted line) using a temperature-controlled chamber (THMS600PS, Linkam Scientific Instruments Ltd.) with a temperature change rate of 20°C/min and a maintaining time of 7 min at each saturated temperature. During the ~20-hr durability test, the normalized resistance values exhibited an almost identical trend, confirming the operational stability of the 3PFS under simulated wind power system conditions. However, it should be noted that future compensation will be necessary according to the ambient temperature and the temperature coefficient of resistance (TCR) of the conductive region. Furthermore, to assess the mechanical durability of the moving part, a 720 cycle test was conducted. As depicted in Figure 12(b), the test condition involved switching between “on” mode (~12.2 SLM) and “off” mode at 5-s intervals using a relay switch module. As a result, the normalized resistance response exhibited the consistent trends across 720 cycles. Although the rate of change was maintained, a deviation in the base signal was observed due to the influence of ambient temperature, indicating that additional sensor packaging may be required for more robust operation in real-world applications.

7. Discussion
Table 1 presents the fabrication, type, material, performance, and test conditions of flow sensors from recent literature compared to this work. Yi et al. [72] utilized a photolithography process to fabricate thermal flow sensors, achieving a relative error of less than 14% in voltage output. In addition, Xu et al. [73] and Qi et al. [75] proposed temperature effect compensation methods under varying ambient temperature conditions. Haneda et al. [74] applied a DNN model to convert the signals from three MEMS-based differential pressure sensors into wind speed, achieving a root MSE value of 0.24 m/s.
| Ref | Year | Core fabrication |
Sensor type |
Material | Fluid type | Accuracy | Durability |
|---|---|---|---|---|---|---|---|
| [72] | 2019 | Microfabrication | Thermal |
|
Air |
|
— |
| [73] | 2019 | Microfabrication | Thermal |
|
|
— | 22–48°C |
| [74] | 2023 | Microfabrication | DP | Au, Si, and SiO2 | Air | RMSE: 0.24 m/s | — |
| [75] | 2024 | Microfabrication | Thermal | Ti, Pt, Au, and ceramic | Air | Maximum error: 1.027 m/s | 0–40°C |
| [48] | 2020 | 3D printing | Thermal | Conductive PLA and ABS |
|
Sensitivity: 0.059 ± 0.010 sccm−1 | Three trials |
| [76] | 2019 | 3D printing | Strain | Conductive TPU | Air | — | 1,000 cycles |
| [77] | 2022 | 3D printing | Strain | Metal and PLA | Air | Maximum error: 0.87 m/s | — |
| This work | 2024 | 3D printing | Strain and capacitance | Pt and TPU | Air | MAE: 0.59 SLM |
|
- PLA, polylactic acid; DP, differential pressure; RMSE, root mean square error; Poly Si, polycrystalline silicon; PMMA, polymethyl methacrylate.
However, MEMS-based sensor fabrications require high-cost equipment, materials, and the use of toxic solutions, as detailed in Table S1. Therefore, 3D printing-based wind sensors have been adopted to substitute the conventional method due to their scalability, large-scale production, time, and cost efficiency for sustainable development. Recently, 3D printing-assisted sensors based on thermal or strain-sensing principles have been developed using conductive or flexible filaments. Daniel et al. [48] proposed a completely 3D-printed thermal anemometer, although it exhibited unstable outputs during repeated trials. In addition, a strain-based flow sensor developed by AI-Rubaiai et al. [76] showed initial resistance changes during a 1000 cycle test. Meanwhile, Ye et al. [77] applied 3D printing techniques to induce fluid-structure interaction, measuring the deformation with a commercial strain gauge and achieving low error results. This work introduces a novel fabrication method using 3D printing for multiple sensing and thermal/mechanical durability tests. Furthermore, a DNN-based signal processing offers a promising method for enhanced airflow measurement and future reliable wind power systems.
While the 3PFS can predict the airflow rate with high accuracy and cost-effective measurements, further discussions are needed for the real applications. Firstly, due to the TCR of metal region, an overall shift can occur in environments with very high ambient temperatures. Therefore, the sensing performance needs verification for the additional calibrations under different fluid types and temperatures. In addition, as shown in previous research [78], components that respond independently of temperature can be utilized to decouple the thermal effect. To address the known limitation of data-driven models, it is crucial to obtain a large number of data points uniformly that fit the range of the intended application environments. It should be noted that utilizing a DNN-based pretrained model in this study allows for ease of real-world applications with small data points through another advanced deep learning approach including domain adaptation [79] and transfer learning [80] methods. Therefore, training the model with datasets considering the real application environments, such as temperature or external interference, can further increase the accuracy. However, the proposed 3PFS showed cost-effective and eco-friendly fabrication methods compared to the conventional approaches (Table S1) for the multiple sensing principles with accurate flow rate sensing performance using DNN model.
8. Conclusion
In conclusion, a facile and novel manufacturing and measuring method for a flow rate sensing system was demonstrated using 3D printing technology and a data-driven DNN. Owing to the additive manufacturing and deep learning models, ease of fabrication, sensor fusion, and enhanced sensing performance were realized. In addition, the principle of coplanar capacitance and crack-based resistance change of 3PFS due to the actuating membrane by airflows was demonstrated using actuation monitoring and captured SEM images. Subsequently, the prediction performance of the trained DNN models was compared for various input conditions (i.e., capacitance (case #1), resistance (case #2), and both features (case #3)) using experimentally acquired 6,965 datasets considering the external interference from the external objects affecting dielectric constant. Case #3 exhibited enhanced performance in terms of prediction accuracy with relatively low signal noise and delay time compared to cases #1 and #2. In particular, for the transient test dataset without external interference, the MAE, MSE, and RMSLE were decreased by 70.37%, 88.74%, and 72.26%, respectively. In addition, MAE, MSE, and RMSLE decreased by 51.91%, 53.01%, and 12.20% with the interference. The results suggest that quantitative prediction error was significantly reduced as the disadvantages of noisy signals and response delay from single inputs were simultaneously minimized. In summary, by using 3PFS, which can gather two different signals, the limitations of the results obtained with only one sensor were overcome, and the performance was significantly improved through sensor fusion. The findings of this study will enlarge reliable sensing applications by applying deep learning to various wind power systems and factories.
Conflicts of Interest
The authors declare that they have no conflicts of interest.
Acknowledgments
This work was supported by the Korea Institute of Energy Technology Evaluation and Planning (KETEP) and the Ministry of Trade, Industry, and Energy (MOTIE) of the Republic of Korea (No. 20221A1010001B and 20202000000010).
Open Research
Data Availability
The data that support the findings of this study are available from the corresponding author upon reasonable request.


