Microstructure Evolution and Multiscale Heat Transfer Characteristics of Resin-Based Ablative Material under Aerodynamic Heating
Abstract
This paper is aimed at investigating the microstructure evolution of resin-based ablative materials under aerodynamic heating. The microstructure, morphology, material density, and thermophysical parameters at different positions of the material after aerodynamic heating were deeply studied. The changes in the microstructural characteristics of materials caused by complex reaction processes were investigated, including microstructural morphology, porosity, the overlap relationship between microstructural components, and the mutual positional relationship. The relationship between microstructural evolution and material heat transfer is discussed. By analyzing the heat transfer mechanism and heat transfer path of the microstructure, combing with the analysis results of the evolution of the microstructure and the physical properties of the material, multiscale heat transfer unit cell models were established to predict the equivalent thermal conductivity. Thereby, the evolution of physical properties and microstructure of resin-based ablative materials under aerodynamic heating and the relationship between microstructure evolution and heat transfer process are obtained. It can improve the accuracy of ablative heat transfer simulation. In addition, it can provide reference for the process design of ablative materials and promote the application and development of ablative materials in the field of aircraft.
1. Introduction
Since the 1960s, the thermal barrier problem of reentry vehicles has become a hindrance to the development of hypersonic vehicles. So, aerothermal protection technology has become a hot topic in aerothermodynamic research. Ablative thermal protection technology has overcome the difficult thermal barrier problem which is difficult to be solved by a single discipline in a short time [1]. The resin-based ablative material has been widely used because of its high heat protection efficiency, good reliability, and simple structure. The first application of ablative materials was the phenolic-based composite used on the MK3 warhead of the Hercules I missile in the middle 1950s [2].
Ablative materials will produce a series of physical and chemical reactions in the aerodynamic heating environment (i.e., melting, pyrolysis, ejection of pyrolytic gas into the boundary layer, sublimation, and in-phase and out-phase chemical reactions). During these physical and chemical reactions, ablative materials are consumed, and the heat given by the environment is dissipated in different ways. This way, the internal structure of the vehicle works at the permitted temperature [3].
For the long-time reentry capsule of the manned spacecraft and the reentry satellite with medium and low thermal flow, lightweight resin-based ablative materials with heatproof and heat-insulating properties are usually used [4]. For example, the Avcoat 5026-39G was used on the Apollo spacecraft; it is made of phenolic glass honeycomb cells filled with phenolic epoxy resin, quartz fibers, and phenolic pellets. The Shenzhou spacecraft used H88 and H96 materials (as shown in Figures 1 and 2); it is phenolic glass honeycomb lattice filled with silicone rubber.
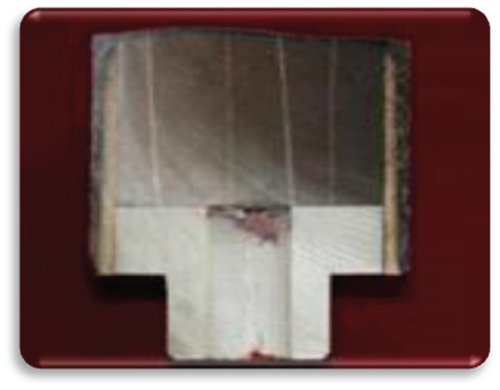
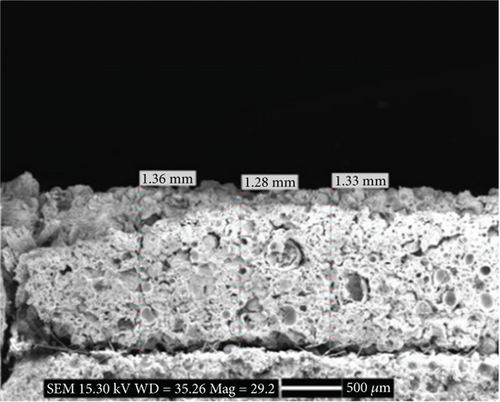
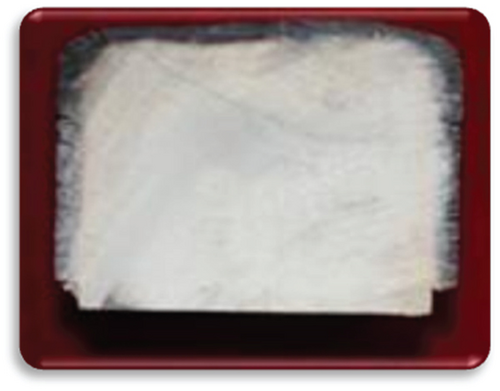
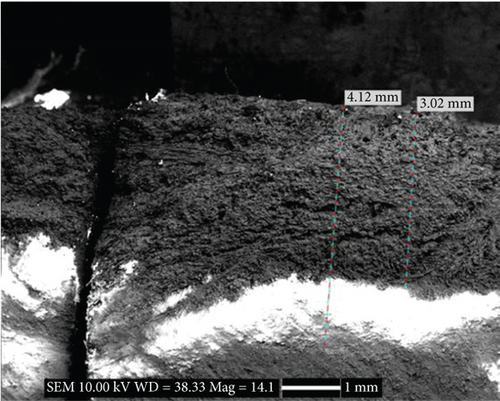
The Lee area of the US Mars reentry vehicle (Viking, Pathfinder) uses lightweight ablative materials made of cork powder, silicone, and phenolic resin microspheres. During the ablative process, resin pyrolysis and carbonization, pyrolytic gas ejection, surface oxidation, and other chemical reactions occur, which can significantly reduce the effective heat flow into the thermal shield. At the same time, the strong thermal insulation performance can ensure the internal temperature of the spacecraft structure to be within the allowable range.
In order to explore the performance of heat protection and heat insulation, thermochemical ablative and heat transfer theory are used. With the wind tunnel and flight test data, the ablative and heat transfer simulation methods of typical resin-based thermal protection materials were established. It can give relatively accurate prediction results of ablation and heat transfer response and make contribution to the success of reentry vehicle. With the development of reentry vehicles, the limits of the proportion of ablative material become increasingly strict. So, it put forward higher requirements of the precision of ablative and heat transfer response of resin-based ablative material. We need to explore the ablative and heat transfer response at the mesoscopic and microscopic scale. In the mesoscopic scale, mainly in the micron scale, the ablative morphology of the material and the mechanism of the ablation were studied. The microlevel mainly refers to the analysis at the nanoscale.
The microstructure of the composite material was studied mainly by scanning electron microscope, transmission electron microscope, X-ray diffractometer, Raman spectroscopy, and other experimental methods.
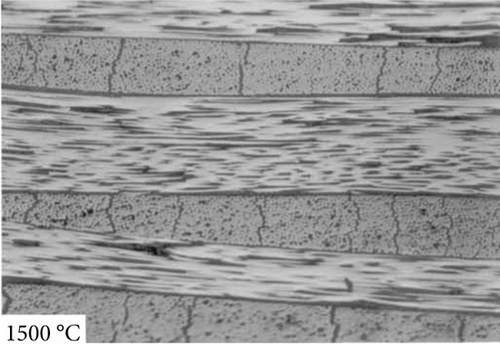
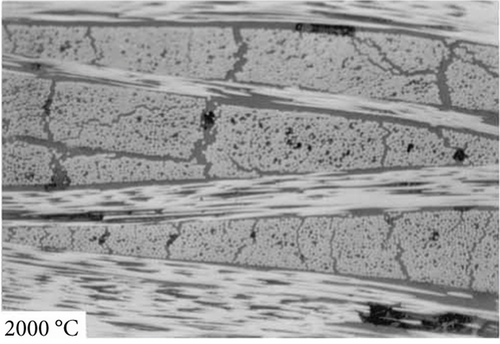
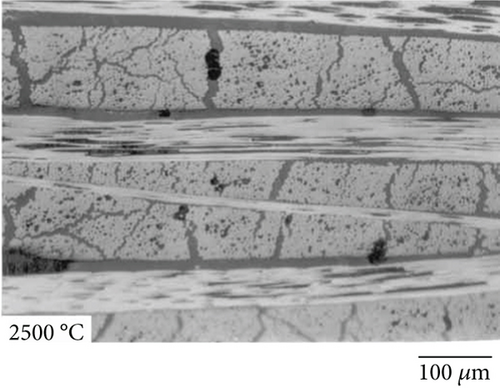
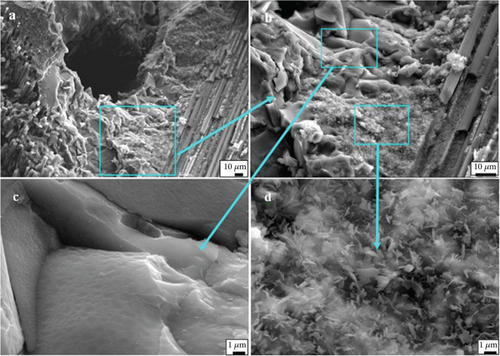
For phenolic resin materials, phenolic resin-based carbon-carbon composites, and pyrolytic short fiber-reinforced polymer resin matrix composites, Ko et al. [5], Tzeng and Chr [6] (as shown in Figure 3), and Alex et al. [7] studied the microstructure of pyrolyzed materials at different temperatures by means of Raman spectroscopy, X-ray diffractometer, and scanning electron microscope separately. For polymer-derived silicon carbide ceramic composites, Santhosh et al. [8] studied the effects of pyrolysis temperature on the microstructure and thermal conductivity of polymer-derived silicon carbide ceramic composites by TG, FT-IR, TEM, and SEM. In recent years, the influence of different processes on the microstructure during the production of composite materials has been explored, including three-dimensional carbon fiber-reinforced ceramic matrix composites [9] (as shown in Figure 4), ceramic hollow microsphere composites [10], carbon-mullite composites [11], and silicon carbide ceramic composites [12].
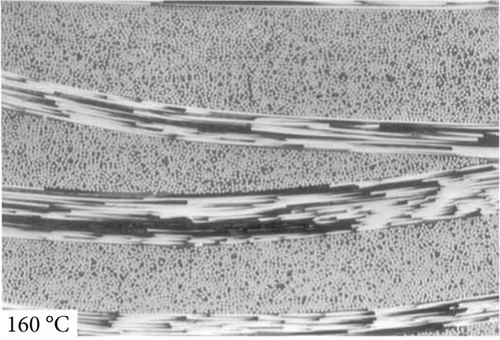
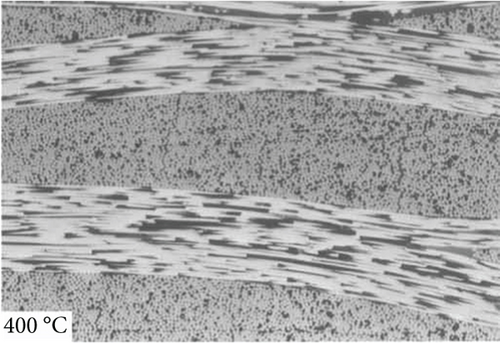
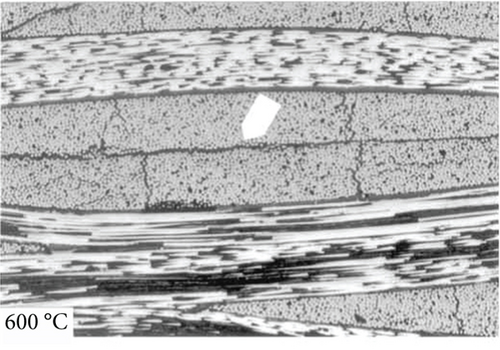

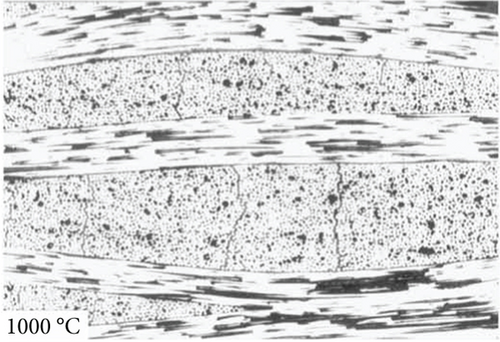
Most of the previous studies were conducted to test and analyze the influence of different pyrolysis temperatures on the microstructure of materials and to explore the evolution of the microstructure of materials under different technological processes. However, there are still few researches on the microstructure evolution of lightweight resin-based ablative thermal protection materials under aerodynamic heating, including the microstructure morphology, the lapping relationship of components, and the evolution of components and pores. In addition, there are no public reports on the microstructure evolution and heat transfer modeling of low-density resin-based thermal protection composites with complex microstructure during aerodynamic heating.
So, in this paper, we aim to conduct an in-depth study of the microstructure evolution of resin-based ablative materials under aerodynamic heating. Based on the microstructure, the multiscale unit cell models are established to predict the equivalent thermal conductivity, and the influence of microstructure parameters is also studied.
The research on the mesoscopic heat transfer mechanism and thermal conductivity prediction of composite materials mainly includes the establishment of theoretical model and finite element model.
Here, ϕ is the volume fraction of filled particles, and km, k1, and keff are the thermal conductivity of matrix-filled particles and the composite separately. The Maxwell model is applicable to materials with particle volume fraction less than 25%; that is, no contact between particles is considered.
Hasselman and Johnson [15] took into account the effects of filling size and boundary thermal conductivity and derived the equivalent thermal conductivity expression, respectively, for the composite materials filled with spherical particles, cylindrical fibers, and flat particles, which is called the Hasselman-Johnson model. The Benveniste-Miloh model considers the influence of the thermal contact resistance between the filler and matrix [16]. Bruggeman proposed the effective medium theory (EMT) [17]. In 1986, based on EMT and the improved Benveniste-Miloh model, Every et al. proposed the Every model [18], which can predict the thermal conductivity of composites with higher volume filling. In addition, based on the Maxwell model and considering the thermal contact resistance, Nan et al. proposed a thermal conductivity prediction model in 1997 [19].
In addition to the classical thermal conductivity prediction model, in recent years, based on the material microstructure and one-dimensional heat transfer assumption, the thermal resistance series and parallel method has been applied to the thermal conductivity prediction of some composites, such as, polymer-hollow microsphere composite [20], microsphere accumulation composite [21], high-porosity metal foam [22], polymer composite [23], two-phase composite [24, 25], and resin matrix composite [26]; based on one-dimensional heat transfer hypothesis and thermal resistance series and parallel, the expression of equivalent thermal conductivity of composite was derived, which can predict the thermal conductivity of some composites accurately.
With the development of computers and software, the finite element method has been applied in the property prediction of composite materials. The unit cell modeling based on material microstructure and thermal conductivity prediction by finite element method have been developed greatly. In terms of unit cell modeling, Li et al. conducted boundary condition discussion and finite element-based thermal conductivity prediction for unidirectional fiber composites, braided composites, and granular-reinforced composites [27–33] (as shown in Figures 5 and 6). In addition, Zhou et al. [34], Liu et al. [35], and Uhlířová and Pabst [36] also conduct the unit cell modeling and finite element-based thermal conductivity prediction for the microstructure of the composite material and obtain the thermal conductivity prediction result which is close to the experimental result.
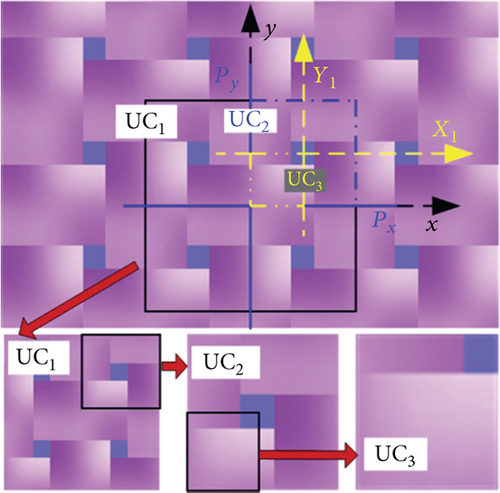
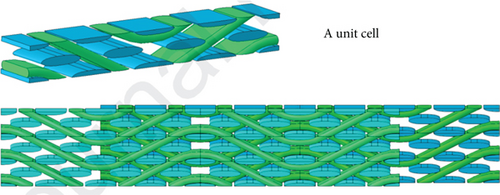
However, in terms of microheat transfer mechanism modeling and thermal conductivity prediction of composite materials, most of them focus on materials with relatively simple microstructure, such as unidirectional fiber composites, braided composites, and particle-reinforced composites. For low-density resin-based ablative thermal protection materials with complex microstructure, such as complex microstructure materials containing hollow microspheres, fibers, pores, and particles, the heat transfer mechanisms can just focus on the original material [26] or the carbonized material [37]. There are few reports of unit cell modeling and heat transfer characteristic analysis of microstructure evolution.
So, as for the research status of the microstructure evolution and heat transfer characteristics, a typical resin-based ablative material was studied. The multiscale unit cell models were established to get the equivalent thermal conductivity, and the relationship between microstructure evolution and material heat transfer is discussed. The structure of this paper is as follows. Section 2 describes the sample preparation and statistical analysis of microstructure size. Section 3 shows the multiscale unit cell heat transfer modeling and the prediction of thermal conductivity. Analysis of the correlation between microstructure evolution and heat transfer process is shown in Section 4. Section 5 shows some conclusions.
2. Sample Preparation and Statistical Analysis of Microstructure Size
2.1. Sample Preparation
The plate test model of the resin-based ablative material was tested in the ground wind tunnel. The model with surface ablation, middle pyrolysis, and original material was obtained.
Figure 7 is the image of the material evolution process after the wind tunnel test. It is clear that the surface layer of the material is completely pyrolytic, leaving residual carbon. The color of the inner layer becomes lighter, and the pyrolysis ratio becomes smaller until the innermost original material layer.
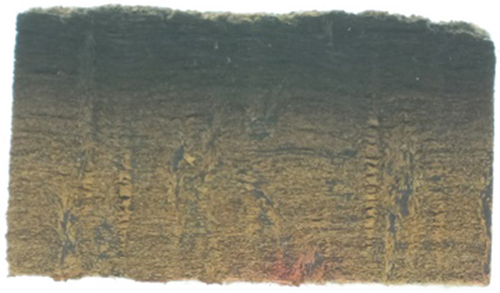
The length and width of the material samples are 15 mm, and the thickness was the thickness of the model after the wind tunnel test, which was roughly 12 mm. In order to preserve the microstructure morphology of the material to the maximum extent, the wire cutting method was adopted. Starting from the surface of the material, the material with a certain thickness was successively cut, and the section numbers were successively A1, A2, A3, A4, A5, and A6. The macropicture of the samples is shown in Figure 8. It can be seen that from the surface to the interior, the color of the sample successively changes from black to light; that is, the carbonization ratio decreases successively, until the interior of the material is the original material.

2.2. Calculation of Pyrolysis Ratio at Different Locations of the Sample
Here, ρ is the current density of the material, ρc is the density of the material after complete pyrolysis, and ρp is the density of the original material.
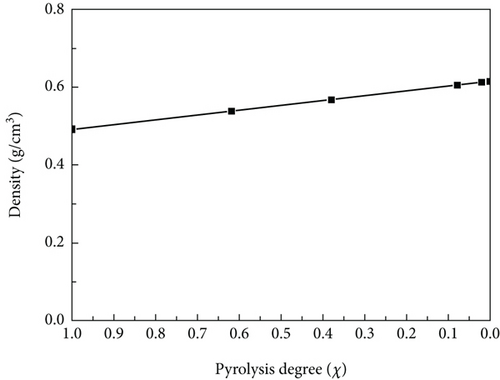
Since the samples are a regular rectangle, their density can be obtained by measuring volume and mass, so the pyrolysis ratio of each layer can be calculated using Equation (3). The material density ranging with pyrolysis ratio is shown in Figure 9. It can be seen that from the surface to the interior, the pyrolysis ratio decreases and the material density increases until it reaches the density of the original material.
2.3. Analysis of Thermal Properties of Phenolic Resin Materials
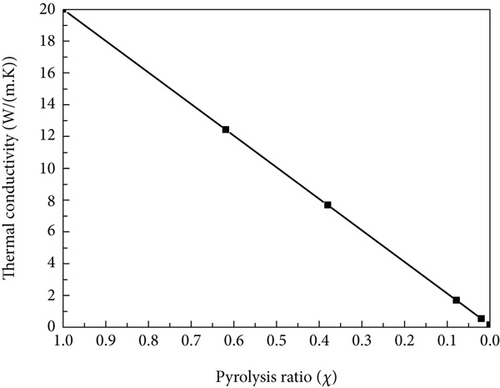
Here, kc is the thermal conductivity of residual carbon of phenolic resin after carbonization, and it is kc = 20 W/(m · K). k0 is the thermal conductivity of phenolic resin, and it is k0 = 0.15 W/(m · K). The variation of thermal conductivity of matrix with the pyrolysis ratio is shown in Figure 10.
2.4. Variation Law of Material Total Porosity
| ρfiber (g·cm−3) | ρresin−original (g·cm−3) | ρresin−carbonized (g·cm−3) | ρtotal (g·cm−3) | ωfiber (%) | ωresin (%) |
|---|---|---|---|---|---|
| 2.2 | 1.1 | 1.8 | 0.6 | 50 | 50 |
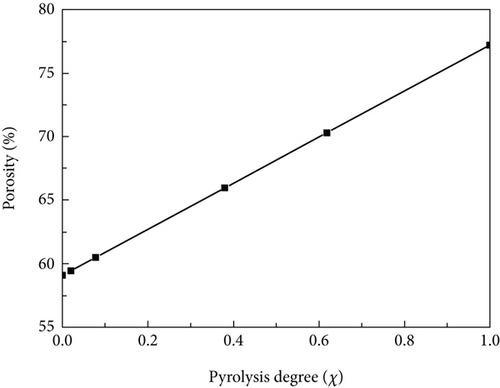
So, the porosity factor is shown in Figure 11. With the increase of pyrolysis ratio, the porosity factor of the material increases significantly, which is due to the volume shrinkage during pyrolysis.
2.5. Microstructure Images at Different Stages of Pyrolysis
The samples at different pyrolysis stages were sprayed with gold, and the microstructure was observed by scanning electron microscope. Figure 12 is the surface section, and Figure 13 is the typical microstructure image of the sixth layer section. It indicates that the material is composed of fibers and nanometer resin matrix, and the fibers are arranged in the tiling and z direction. Therefore, the microstructure size statistics are mainly conducted from the size and distribution of nanopores at the matrix scale and the size and distribution of micropores and fibers at the fiber scale. At the matrix scale, the volume content of nanoscale was calculated, and at the fiber scale, the volume content of fiber and micron pores was calculated. Since there are some differences in the microstructure of materials with the same pyrolysis ratio at different locations, the method of measuring three typical microstructure images and taking average values is adopted in the process of microstructure distribution, size, and content statistics.
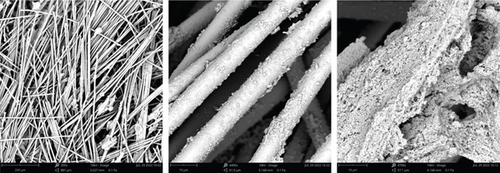
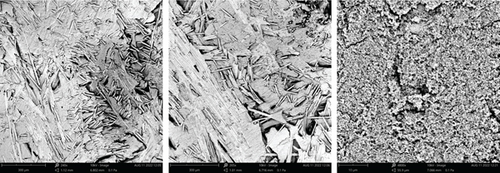
Figure 12 is the microstructure image of the upper surface of A1, which is the part in contact with aerodynamic heating. The microstructures indicate that most of the material is composed of fibers, the matrix content is small, and only a small part of the matrix is attached to the fibers. The reason is that the residual carbon formed by the pyrolysis resin in the process of aerodynamic heating will undergo oxidation reaction under the condition of aerodynamic heating. In addition, some residual carbon has been subjected to airflow erosion, so the matrix content in the surface material is less.
2.6. Distribution of Microstructure Size
2.6.1. Statistics and Analysis of Pore Microstructure Size Distribution
As for the reason that the matrix exists a little on the surface because of airflow erosion and ablation, we take back microstructure of each layer.
- (1)
Statistics and distribution of nanopore size
Size statistics were made on the microstructure image of layer A1, we use the software of Image-Pro Plus to label and count the microstructure size and distribution, as shown in Figure 14. The total area of pores and the total area of the image were calculated, and the calculated porosity factor was 27.41%. Figure 15 shows the statistical results of pore size distribution. It indicates that the diameter of most pores is 3.5~20 nm and the number of larger pores is small.
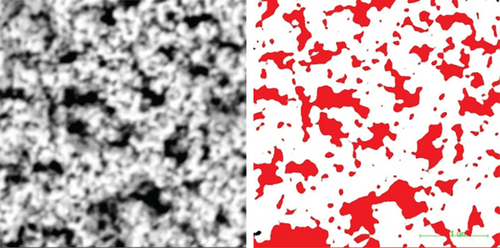
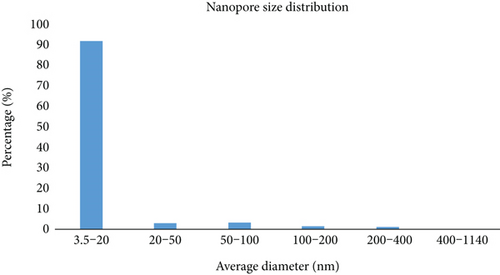
The images of three different positions were taken for statistics, and the average porosity factor was taken. The nanoscale porosity of A1 was 27.72%.
- (2)
Statistics and distribution of micron pore size
| A1 | A2 | A3 | A4 | A5 | A6 | |
|---|---|---|---|---|---|---|
| Nanoscale porosity (%) | 27.79 | 27.71 | 35.45 | 39.15 | 31.28 | 38.64 |
| Pore size distribution (nm) | 3.5~20 | 20 | 5~20 | 3~20 | 2.4~20 | 6~20 |
Size statistics were made on the micron-scale microstructure image of layer A1, as shown in Figure 16. The total area of pores and the total area of the image were calculated, and the calculated porosity was 32.74%. Figure 17 shows the statistical results of pore size distribution. It can be seen that most pores have diameters ranging from 1.0 to 5.0 microns and the number of larger pores is small.
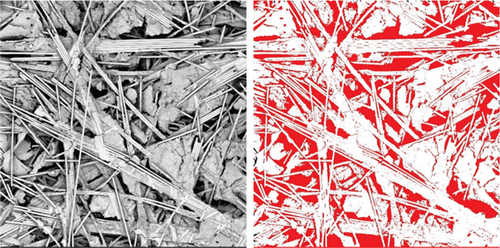
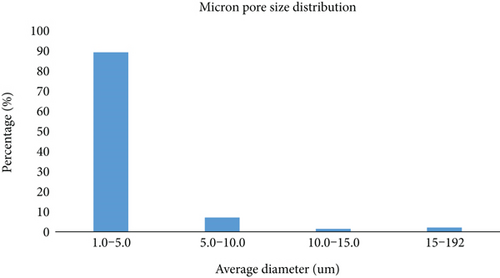
The average porosity of three images at different positions was obtained. The micron-scale porosity of A1 was 31.90%.
The microscale porosity and pore size distribution of A1 to A6 is shown in Table 3.
| A1 | A2 | A3 | A4 | A5 | A6 | |
|---|---|---|---|---|---|---|
| Microscale porosity (%) | 31.9 | 31.42 | 32.56 | 32.43 | 27.72 | 26.4 |
| Pore size distribution (μm) | 1~5 | 1~5 | 1~5 | 1~5 | 1~5 | 1~5 |
2.6.2. Statistical Analysis of Fiber Microstructure Size Distribution
As can be seen from the material microstructure image, the quartz fiber does not undergo melting and other changes in the test state, and its morphology does not change during the ablation process. Therefore, the statistical analysis of fiber size is carried out for the microstructure of the surface material with obvious fiber distribution.
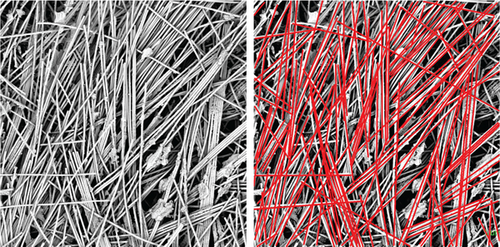
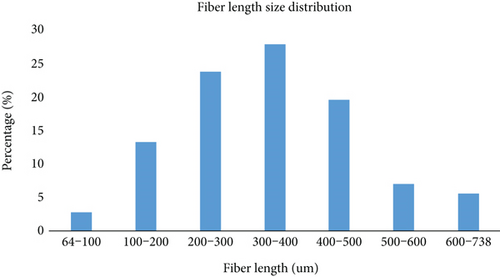
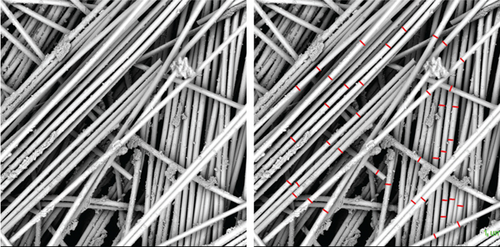
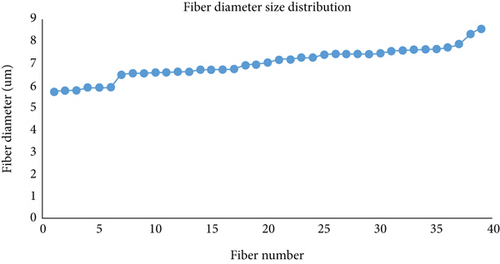
Figure 18 is fiber-scale image and fiber length label map. It can be seen that the distribution of fiber length is relatively uniform, ranging from more than 60 microns to 1,000 microns, with little difference in quantity, which is shown in Figure 19. The fiber diameter varies from 5.5 microns to 8.5 microns, and the distribution is relatively uniform, as shown in Figures 20 and 21. Therefore, the length and diameter of the fiber can be considered as a uniform distribution within a certain size range when generating the fiber. The representativeness was increased by means of the average value of the images at different locations.
3. Multiscale Heat Transfer Modeling and Thermal Conductivity Prediction
3.1. Heat Transfer Modeling
3.1.1. Modeling and Equivalent Thermal Conductivity Prediction of Nano-Pore-Scale Cells of Layer A1 (Carbonized Layer)
The surface layer is completely carbonized, so the resin matrix is completely transformed into residual carbon. According to the above statistics, the nanoscale porosity is 27.72%, and the average pore diameter is between 0 and 20 nm. The pores have an irregular structure, which is considered as spherical pores. We use the APDL code of Ansys Mechanical software to establish the finite element model.
Skochdopole [38] found in the experiment that for the hole whose diameter was less than 4 mm, there was no natural convection of the gas. The pore size is very small, and its equal diameter is far less than 192 μm, so we ignore the thermal convection. We focus on the heat transfer characteristics in room temperature, so we also ignore the gas radiation.
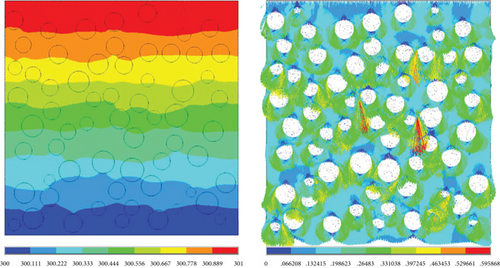
The temperature nephogram and heat flow vector diagram are shown in Figure 22.
3.1.2. Calculation Results of Nanoscale Thermal Conductivity Variation with Pyrolysis Ratio
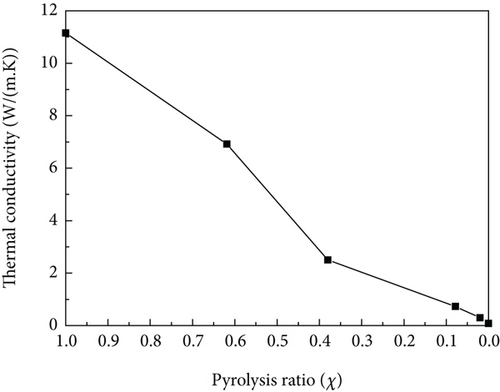
For the other layers of A2~A6, considering different pyrolysis ratio and physical parameters, the method similar to the previous section is used to calculate the nanoscale thermal conductivity under different pyrolysis ratios, and the results are shown in Figure 23. It can be seen that the equivalent thermal conductivity at the nanoscale increases with the increase of pyrolysis ratio. The reason is that the conductivity of resin matrix increases significantly with pyrolysis ratio.
3.1.3. Micron-Scale Cell Modeling and Equivalent Thermal Conductivity Prediction of Layer A1 (Carbonized Layer)
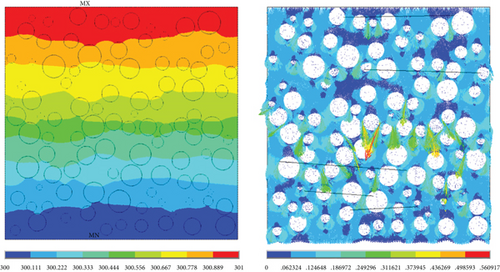
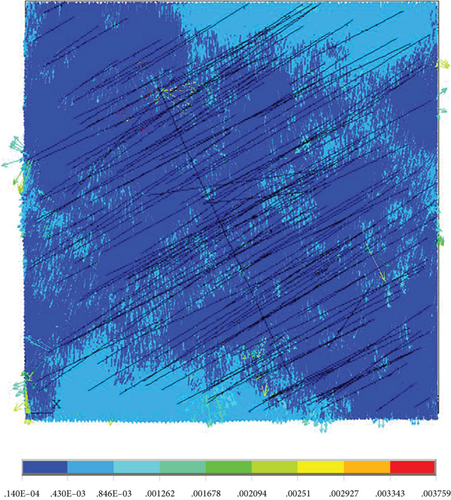
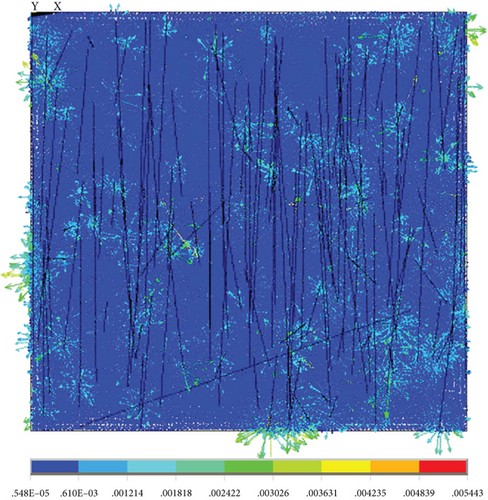
At the micron scale, according to the above statistics, the porosity is 31.9%, the average pore diameter is between 1 and 5 microns, and the pores are irregular structure. Here, they are considered as spherical pores, and the control body is taken as 100-micron meters, and the spherical pores are randomly generated. According to the statistical results of fibers, there is little difference in fiber diameter, so the average value is taken as 7 microns. The fiber volume fraction was calculated to be 13.6% by the composition of material physical parameters, and the fiber was generated according to this proportion. The Boolean operation was carried out, the grid was drawn, periodic boundary conditions and temperature boundary conditions were applied for calculation, and the heat flow through the heat transfer direction was obtained. The predicted results of the thermal conductivity were calculated using the Fourier law. Temperature cloud map and heat flow vector are shown in Figure 24.
3.1.4. Calculation Results of Micron-Scale Thermal Conductivity Variation with Pyrolysis Ratio
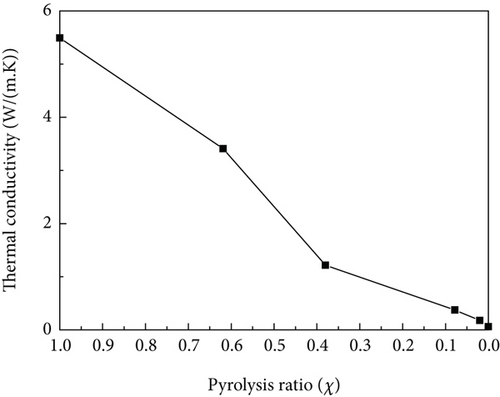
Micron-scale thermal conductivity at different pyrolysis ratios was calculated, and the results are shown in Figure 25. It can be seen that the micron-scale equivalent thermal conductivity increased with the increase of pyrolysis ratio. The variation is mainly because of the thermal conductivity in the nanoscale.
3.2. Equivalent Thermal Conductivity Test Verification
So, the method of multiscale thermal conductivity prediction is verified by the experiment.
4. Analysis of the Correlation between Microstructure Evolution and Heat Transfer Process
4.1. Influence of Nanoscale Pores
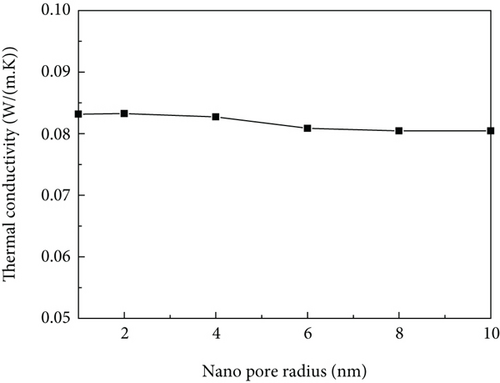
Taking the same porosity, the influence of the change of pore size on the nanoscale thermal conductivity was discussed. Since the model was randomly distributed, the average value was calculated multiple times. The thermal conductivity ranging with the nanoscale pore size is shown in Figure 26. The thermal conductivity varies a little when the nanoscale pore size changes. We can conclude that when the volume fraction is constant, the nanopore size has little effect on the nanoscale thermal conductivity.
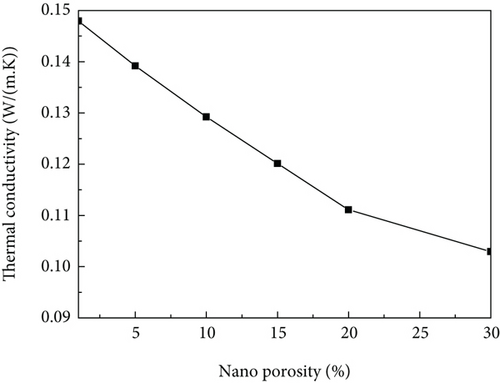
For different nanoporosity, the influence of the porosity on the nanoscale thermal conductivity was calculated, and the result is shown in Figure 27. It can be seen that the nanoscale thermal conductivity decreases with the increase of the porosity. This is because the thermal conductivity of air is low, and the larger porosity will reduce the thermal conductivity of the material.
4.2. Influence of Fiber Size
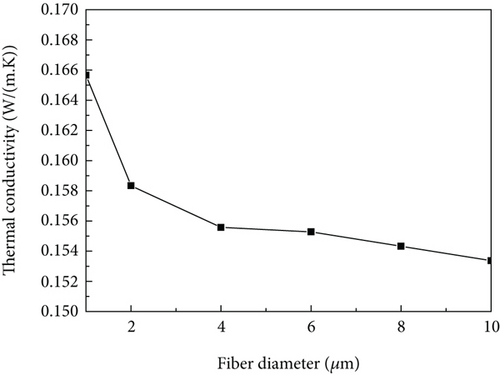
The effect of fiber diameter on micron-scale thermal conductivity is shown in Figure 28. The fiber volume fraction is fixed and the fiber orientation is random, and the fiber-scale equivalent thermal conductivity can be calculated by different fiber diameters. It can be seen that the micron-scale equivalent thermal conductivity increases with the fiber diameter. As for the original material, the thermal conductivity of fiber is bigger than other constituents, and the bigger fiber leads to a smaller number of fibers. So, the thermal conductivity is smaller with bigger fiber diameter.
4.3. Influence of Fiber Anisotropy Distribution on Thermal Conductivity
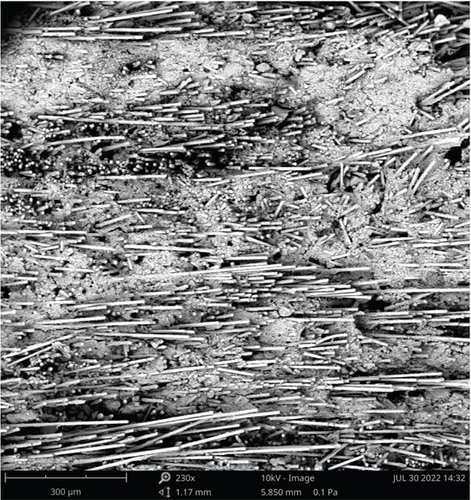
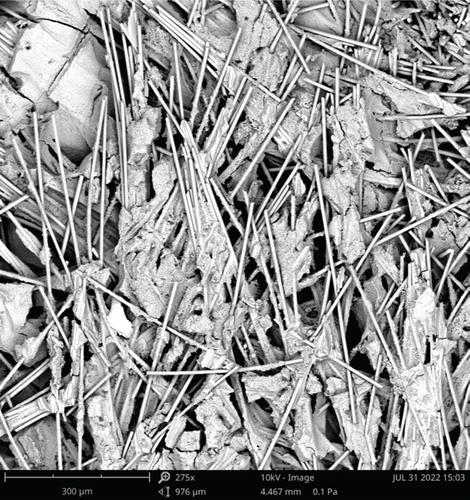
Figures 29 and 30 show the microstructure images observed on the side and top surfaces, respectively. It can be seen that most fibers are randomly distributed and layered on the surface which is vertical to the heat transfer direction, and a small number of fibers are roughly distributed along the heat transfer direction. The influence of fiber orientation change on the thermal conductivity is discussed below.
Fiber randomly distributed in plane O. The angle between the normal direction of plane O and the heat transfer direction is 90 degrees in the actual material of this paper. The thermal conductivity results of the material are discussed below when the normal direction of plane O and the heat transfer direction are, respectively, at an angle of 0°, 30°, 45°, 60°, and 90°.
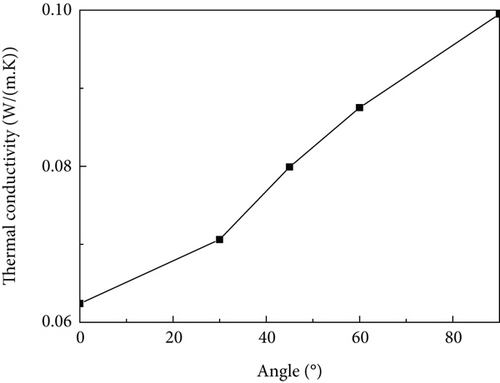
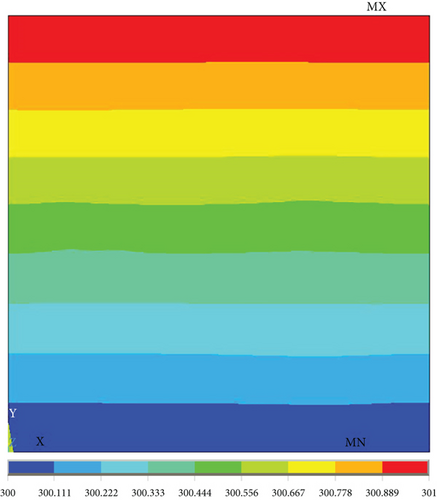
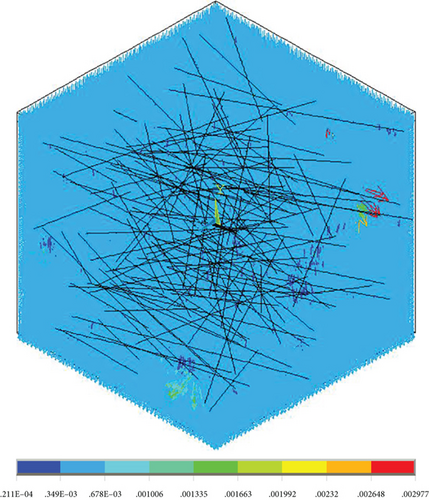
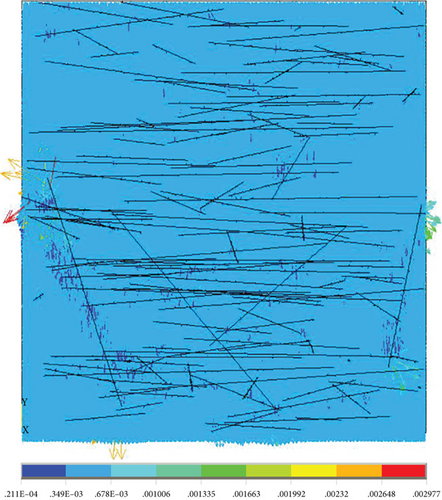
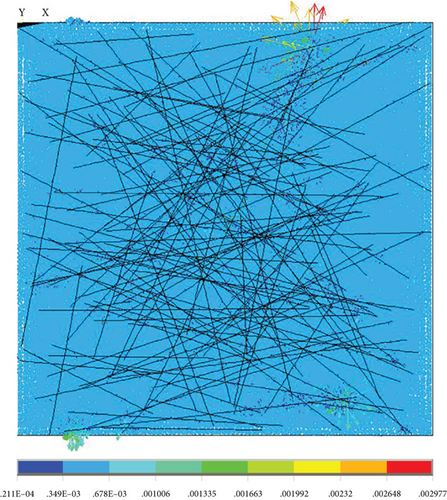
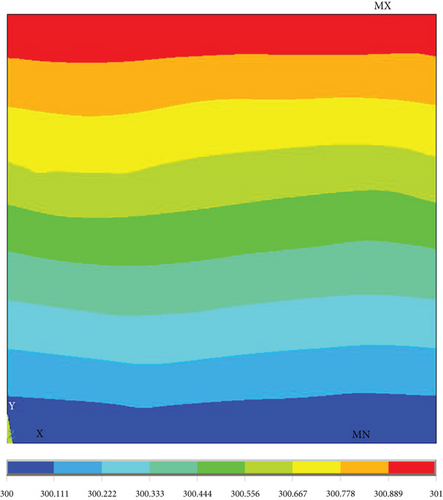
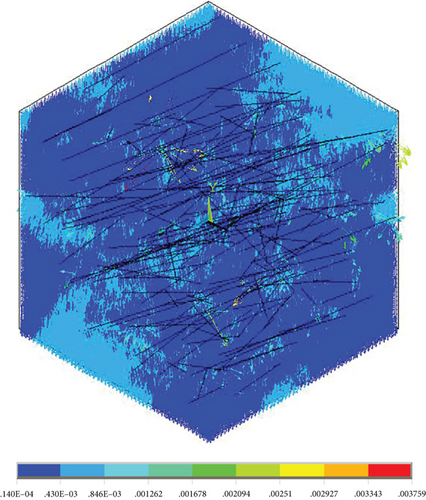
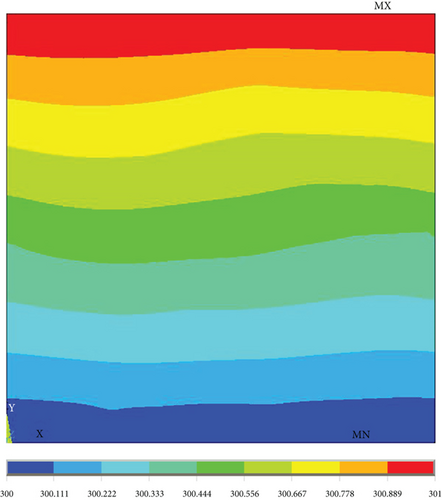
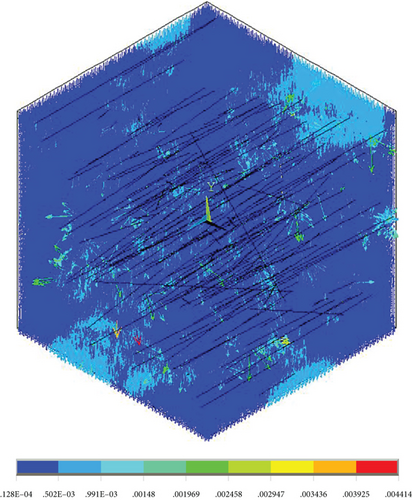
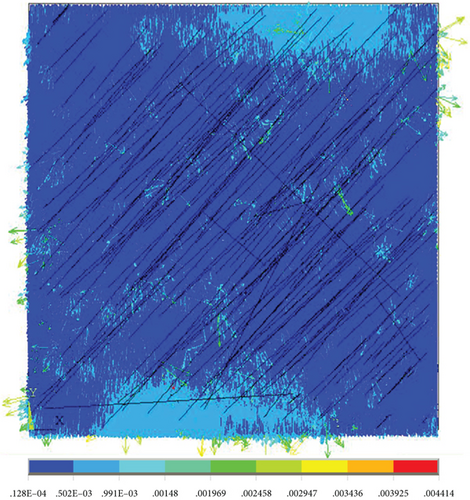
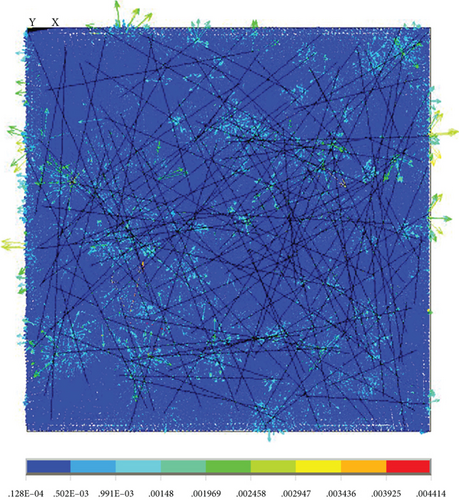
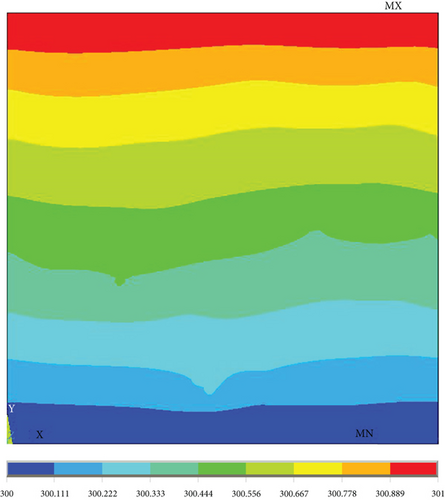
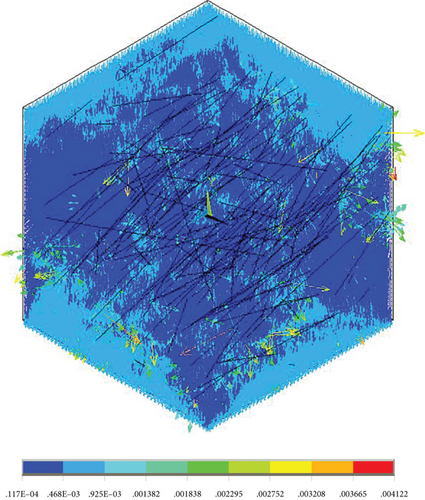
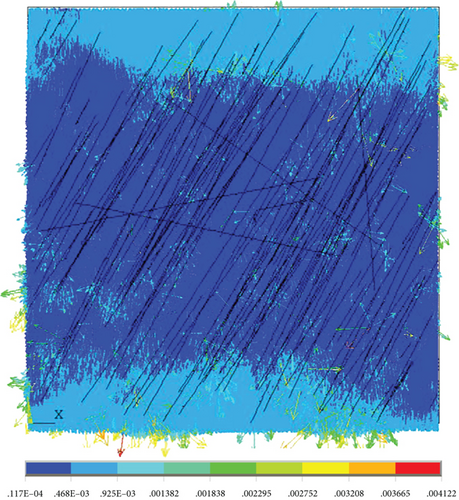
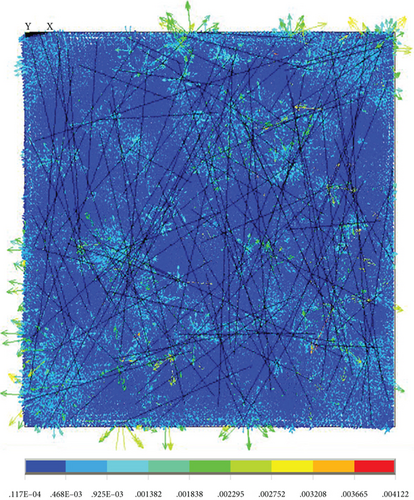
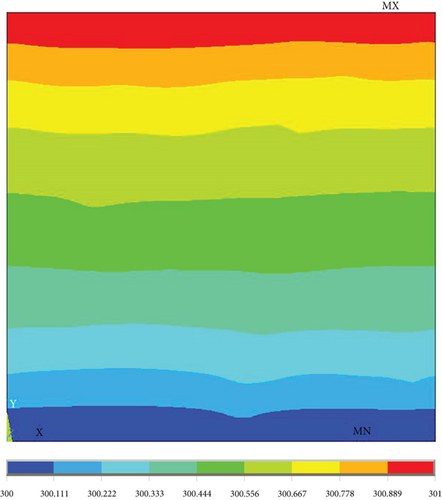
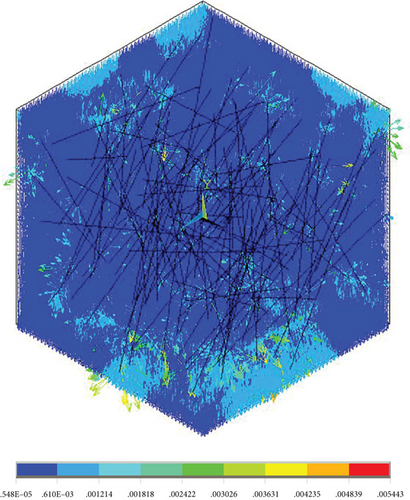
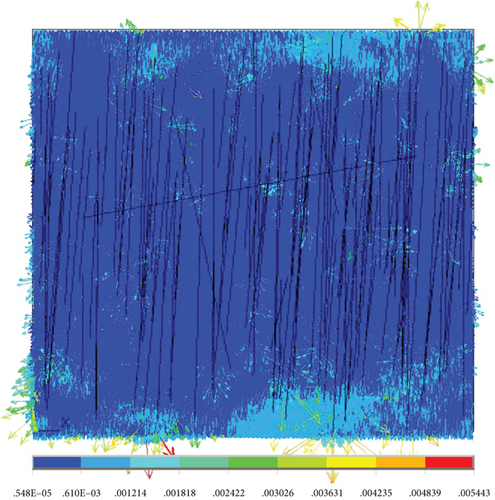
Here, the original material parameters of the material were taken as the research object, and the equivalent thermal conductivity was obtained by modeling the microstructure of the resin and nanopores first. Then, the equivalent thermal conductivity of the micron pores and the matrix was obtained by taking the thermal conductivity as the input, and the thermal conductivity of the new matrix was 0.060773 W/(m·K). The obtained equivalent thermal conductivity at different angles between the normal direction of plane O and the heat transfer direction y is shown in Table 4 and Figure 31, and the temperature cloud and heat flow diagram are shown in Figures 32-35–36. We can see that the thermal conductivity is larger when the orientation of fiber is the same with the heat transfer direction.
| Angle (°) | 0 | 30 | 45 | 60 | 90 |
| Thermal conductivity (W/(m·K)) | 0.0624 | 0.0706 | 0.0799 | 0.0875 | 0.0995 |

5. Conclusion
In this paper, based on the slicing, weighing, size measurement, microstructure observation, microstructure size statistics, microstructure modeling, and heat transfer characteristic analysis of resin-based thermal protection material samples at different positions after wind tunnel test, the evolution of microstructure and material physical property parameters at different positions of materials under aerodynamic heating condition was obtained, and the prediction results of material thermal conductivity were obtained. We can see that, from the surface to the interior of the material, the pyrolysis ratio gradually decreases and the material density gradually increases. The predicted thermal conductivity of the material increases with the increase of the pyrolysis ratio. The results show that pore sizes have little influence on the thermal conductivity, while porosity, fiber size, and fiber orientation have great influence on the thermal conductivity. The thermal conductivity decreases with increasing porosity. For fibers, the more fibers along the heat transfer direction, the greater the thermal conductivity is.
Conflicts of Interest
The authors declare that they have no affiliation with or involvement in any organization or entity with any financial interest in the subject matter or materials discussed in this manuscript.
Acknowledgments
We acknowledge the support from the National Natural Science Foundation Committee (Joint Fund Project U20B2017).
Open Research
Data Availability
Research data supporting this publication are available by contacting the author at [email protected].


