A Bottom-Up Approach to PV System Design for Rural Locality Electrification: A Case Study in Burkina Faso
Abstract
This work evaluates the performance of optimal hybrid PV/battery and PV/diesel generator renewable energy systems for a remote village in Burkina Faso. Based on socioeconomic data and the household sample survey, a technoeconomic simulation and optimization model of electrical loading are presented. Ant colony optimization (ACO) and the loss of power supply probability (LPSP) algorithms were used for the search of the optimal hybrid power system. For the selected village location, the results have shown that the hybrid PV/battery system represents the best renewable energy solution due to abundant solar irradiation and carbon emission free compared to the conventional diesel generator (DG) or PV/DG system. To reach the estimated load power demand of 2150 kWh for the studied location, optimized PV/battery configuration sizing required 650 PV modules of 250 W and 715 batteries of 300 Ah. The economical evaluation reveals a cost investment of about 1,293 025.7 USD for a lifetime of 25 years in comparison of that of PV/DG and DG systems, which are 1,088 701.9 USD and 1,682 850.6 USD, respectively. However, environmental and atmospheric pollution is minimized with a saving of more than 17943 tons of CO2. Therefore, the production of electricity from the PV/battery system leads to better competitiveness reliability for a socioeconomic development of studied remote villages.
1. Introduction
For the past three decades, the search for renewable energy resources has become a hot research topic for safe and clean energy production around the world [1]. However, the high investment costs remain a potential barrier, while conventional fossil fuels are sold at lower prices. As in most developing countries, accessibility to energy remains a major concern. Therefore, several papers reported on a low electricity access in sub-Sahara Africa [2–5]. In their investigation, Deborah et al. [5] indicated that only 48% have electricity access. Like the majority of sub-Saharan African countries, Burkina Faso is experiencing a high energy demand due to the rapid population growth, where the rate has doubled in less than two decades. Therefore, the energy coverage has become one of the national priorities. In addition to existing conventional energy sources (hydroelectric and diesel power plants), several solar power plants are being implemented across the country. Although these efforts, the energy access issue is more critical in rural areas [6]. To overcome this issue, strategies and programs such as rural electrification are initiated for an electricity coverage up to 100% by 2025, as indicated in the “Plan National de Développement Economique et Social (PNDES II)” [7]. For the socioeconomic development of remote villages, the promotion of hybrid renewable energy systems is proposed. The reliabilities of these systems have been reported in the literature. Thus, Enock Mulenga et al. [8], Kumar et al. [9], and Khan et al. [10] evaluated the technoeconomic analysis of hybrid power systems such as PV-Diesel, PV-Biomass, and PV-Hydrogen for the rural electrification plan. Other studies [11–14] focused on optimization techniques for the hybrid power system components sizing. Mishra et al. [15] described the design optimization approach for the grid-connected hybrid renewable system using discrete harmony search (DHS) algorithm. Mustafa Kamal et al. [16] discussed the optimal size for the standalone microgrid using the differential evolution (DE) algorithm to minimize the total cost of energy and the size of the system. Ali Saleh et al. [17] have developed an appropriate dispatching approach to analyze the stability, reliability, economic, and environmental performance of integrating PV with diesel-batteries power systems. Malla and Bhende [18] described an enhanced process of PV-diesel-battery system using Takagi–Sugeno (TS) fuzzy model for a maximum power extraction under changeable solar irradiation condition. In this process, the active power balance is kept through the PV system to avoid the diesel generator (DG) in running on/off frequently. Although the main objective in the operation of this system is achieved, the study does not mention the optimum assessment of various components.
- (1)
Proposing a reliable hybrid power system (PV-battery) for energy supply in a remote village with an abundant solar radiation
- (2)
A developed bottom-up approach for energy load estimation in a village of 4000 people, based on socioeconomic data and household sample survey, while the assessment model is based on local climate and geographic data
- (3)
A detailed mathematical approach for different components of the proposed system
- (4)
Introducing ACO algorithm for optimizing the number of PV modules and batteries of the study system.
In addition to an introduction and conclusion, the paper is organized as follows: Section 2 describes the system as the main element of the design methodology. The optimization algorithms such as LPSP and ACO methods are described and introduced in Section 3 while the results of simulations and economic and environmental analysis are discussed in Section 4.
2. System Description
2.1. Remote Locality Description
The implementation of the hybrid system is carried out in the village of “Zerkoum” (12° 23′ N; 2° 04′ 39″ W) in Burkina Faso, with an estimated population of 600 households. The village is equipped with basic infrastructure, including schools, administration, health centre, and market. Due to its geographical position, “Zerkoum” is well irradiated and could take advantage of solar energy systems’ installation.
2.2. Load Profile Assessment
- (1)
Group I: 50% of the population with very low incomes for their basic needs
- (2)
Group II: 30% of the population with middle income and wish to use a TV, DVD player, and 1 or 2 appliances (fan, fridge, and flat iron)
- (3)
Group III: 20% of the population with consistent income.
| Number of households (600) | Group I: 50% | Group II: 30% | Group III: 20% | |||||||
|---|---|---|---|---|---|---|---|---|---|---|
| Appliances | Rated power (W) | Number | Times (h) | Energy (Wh) | Number | Times (h) | Energy (Wh) | Number | Times (h) | Energy (Wh) |
| Lamp | 18 | 03 | 03 | 162 | 06 | 04 | 432 | 08 | 04 | 576 |
| Radio K7 | 15 | 02 | 06 | 180 | 02 | 07 | 210 | 02 | 04 | 120 |
| TV color | 80 | … | … | … | 01 | 04 | 320 | 02 | 05 | 800 |
| Fridge | 200 | … | … | … | 01 | 24 | 4800 | 01 | 24 | 4800 |
| Freezer | 150 | … | … | … | … | … | … | 01 | 10 | 1500 |
| DVD player | 50 | … | … | … | 01 | 04 | 200 | 01 | 03 | 150 |
| Fan | 60 | … | … | … | 01 | 08 | 480 | 01 | 01 | 60 |
| Flat iron. | 200 | … | … | … | 01 | 01 | 200 | 01 | 01 | 200 |
| Phone charge | 02 | 03 | 02 | 12 | 04 | 02 | 16 | 05 | 02 | 20 |
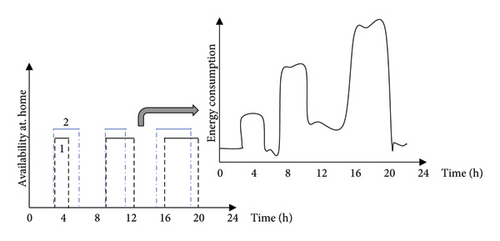
To obtain an accurate assessment of the methodology that describes the load pattern for all appliances, which are likely to be found in the village, a synthetic electric load shape was produced by employing an electrical local end approach. The technique is based on a bottom-up model, which uses some fundamental parameter data for the load profile. Based on some earlier works [27, 28, 29], an approximate appliance load profile for the village is established by using the statistical energy data on the number of households, abovementioned basic facilities, and commercial activities. The load is stochastically based on the hourly behavior of the customer. The daily load shape is simulated while considering the use of each appliance. The daily energy need for two people in different households is described in Figure 1.
The global daily energy demand is therefore equal to the sum of individual households that include all activities with electricity consumption that must meet the electrical power system. Figure 2 illustrates the development of the bottom-up approach used in the studied locality loadshape assessment.
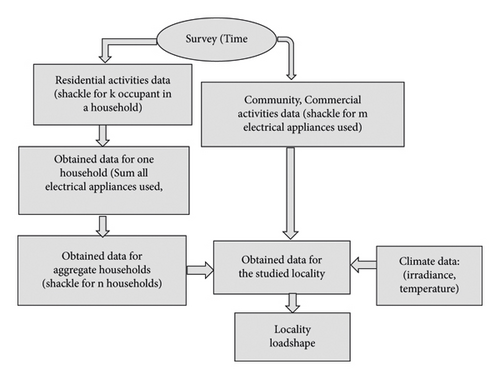
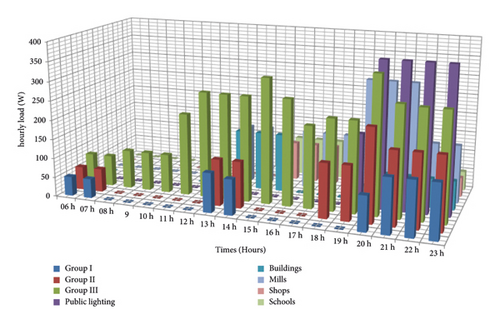
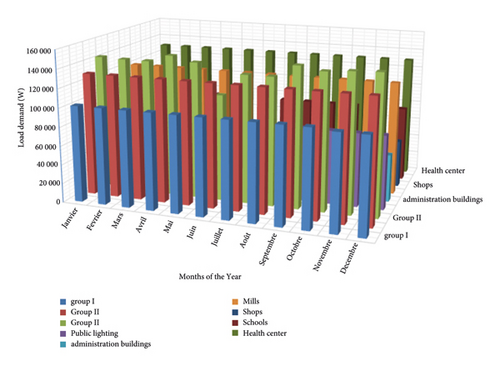
Figure 3(a) shows the hourly average load demand for various services in the locality for one day of operation. The evaluation of electrical energy consumption is carried out carefully by taking into account the peak consumption for all activities. It can be observed that the consumption peak is reached in the morning and evening. Indeed, these periods correspond to the moment where all residents are in their house and most domestic activities are carried out. On the other hand, the energy consumption is minimal at night when most people are less active at home as well as in the services. The total energy need for the village is estimated to be 2150 kWh per day with an average peak flow of 150 kW (load factor of 0 and 21) along the year, as shown in Figure 3(b). The maximum load value was recorded around 21:00 h. In this context, a PV module and a storage system could be an alternative in supplying the load to several houses in the absence of sun irradiation.
2.3. Solar Resource Assessment
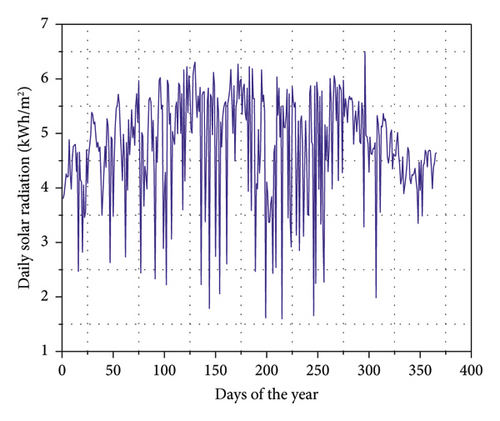
2.4. Components of the Hybrid PV/Battery System
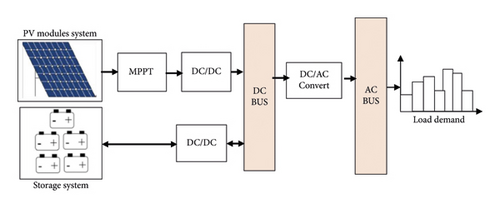
Taking into account that operating under a temperature parameter around 45°C in April, a monocrystalline solar module is considered. The main technical information about the PV module system is described in Table 2 [33].
| Parameters’ description | Values |
|---|---|
| Maximum power (Pmpp) | 250 W |
| Open circuit voltage (Voc) | 37.4 V |
| Short circuit current (Isc) | 8.55 A |
| Temperature factor (γ) | −0.003865/°C |
| Life time | 25 years |
| Ground reflection | 20% |
| Efficiency | 15.43% |
| Operating temperature | 47°C |
| Capital cost ( ∗) | 0.67 USD/W |
| Replacement cost ( ∗) | 0.67 USD/W |
| Operation and maintenance (O&M) cost ( ∗) | 0.5 USD/kW/Year |
- ( ∗) These prices are derived from data obtained from local Burkinabe distributors and manufacturers.
2.5. Storage System Description
- (1)
Energy balance for storage system charging:
(9) - (2)
Energy balance for discharging the storage system:
2.6. Power Converter Model
3. Optimization Approach
Solving this equation could lead to the determination of the capacities of the PV module and the battery for a given LPSP.
4. Simulation Results and Discussion
4.1. Capacity of PV Module and Battery Optimization
In order to evaluate the performance of the system under various conditions, simulation studies have been carried out using load demand and real weather data of selected villages. Ant colony optimization (ACO) [20–42], as a probabilistic algorithm, is used to perform LPSP and system investment cost. ACO is swarm intelligence-based metaheuristic optimization algorithm that was inspired by the foraging behavior of ants [43]. ACO imitates the cooperative behavior of an ant colony to find the shortest path to a food source. In this approach, a combination of optimization issues with n sizing parameters is made as a multilayered diagram, as illustrated in Figure 6 [44]. The number of layers corresponds to the number of design parameters. Also, the number of nodes in each layer corresponds to the discrete values’ number allowed for the corresponding parameters. Therefore, each node in a particular location of the diagram is joined with an allowed discrete value of a design parameter. Artificial ants travel through this diagram, searching for good paths. An ant colony consists of N ants. The ants start at the nest node, walk through the different layers from the first layer to the last layer, and end at the destination node in each cycle or iteration. Each ant can choose only one node in each layer in accordance with the state transition rule given by metaheuristic information. The nodes selected along the path visited by an ant represent a candidate solution [44]. On the travelled path, the ant lays down some pheromone based on a local updating rule. In the start of the optimization process, all the edges or rays are initially carried out with the same amount of pheromone. Thus, in this first iteration, all the ants start from the home node and end at the food node by randomly choosing a node in each layer. Small quantities of pheromone are deposited during the construction phase, while larger amounts are deposited at the end of each iteration in proportion to solution quality. The optimization process is finished if any of the given termination conditions are satisfied. The values of the design parameters indicated by the nodes on the path with the largest amount of pheromone are considered as the components of the optimum solution vector. Overall, at the optimum solution, all ants walk along the same converged path. The most important characteristic of this algorithm is that it permits the best ant to update its pheromones.
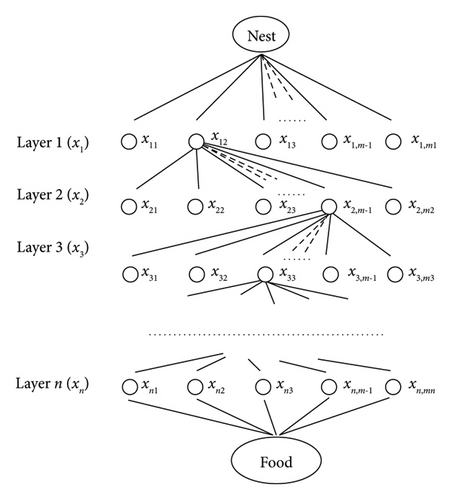
From its interest in complex system optimization, the ACO algorithm has been applied to several optimization problems including those related to renewable energy optimization.
- (i)
Initialization: The initial solution is generated using the LPSP approach. This solution includes the initial sizes of the PV arrays and battery storage system.
- (ii)
Pheromone update: In this step, the pheromone trails are updated based on the solutions generated in the previous iteration. If a solution generated in the previous iteration produced a higher energy output and lower cost, the pheromone is updated to reflect that.
- (iii)
Solution generation: New solutions are generated on the basis of the updated pheromone trails and heuristics. The heuristics are rules that ensure the PV arrays and battery storage system are sized within the given constraints. These solutions represent different combinations of PV arrays and battery storage system sizes.
- (iv)
Solution evaluation: solutions are evaluated on the basis of a predefined objective function. The objective function takes into account the energy output, cost, and other constraints such as the maximum allowed capacity of the battery storage system.
- (v)
Termination: The algorithm terminates when a satisfactory solution is found.
As a result, the ACO algorithm will generate an optimal solution that represents the optimal sizing of the PV arrays and battery storage system to meet the energy demand of the studied location while minimizing the cost.
Thus, the optimization technique was carried out by taking into account the ACO parameters’ approach, as presented in Table 3. These parameters were estimated based on the work of Jiang et al. [41].
| Parameters | Values |
|---|---|
| No. of ants per iteration | 4 |
| Size of the problem | 2 |
| Size of the solution | 10 |
| Locality of the search process | 0.45 |
| Convergence speed | 0.86 |
In the simulation process, the parameters (constant or variable) defined in Table 4 are considered. The lower and upper boundary stones of decided variables are assessed by the ACO program to concur with the optimal solution. The number of decided parameters that provide the best results is sorted by setting all possible values by trial and error.
| Constant parameters | Values |
|---|---|
| Converter efficiency (%) | 95 |
| Regulator efficiency (%) | 99 |
| Battery charging efficiency (%) | 85 |
| Connection loss factor | 0.98 |
| Other loss factor | 1 |
| α (US$/Wp) ∗ | 0.67 |
| β (US$/Ah) ∗ | 1.08 |
| Variable Parameters | Range |
| Number of PV modules | 500–700 |
| Number of batteries | 500–725 |
- ∗These prices are derived from data obtained from local distributors and manufacturers.
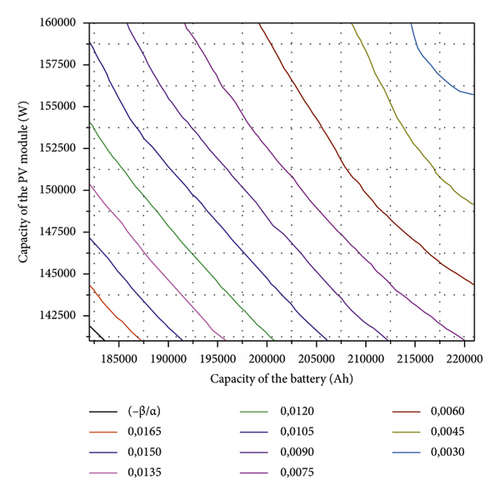
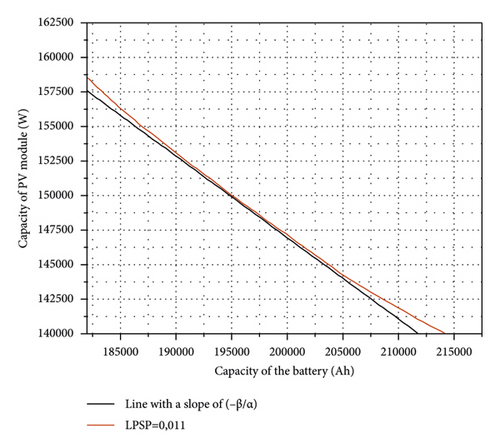
Using the ACO algorithm developed in MATLAB, the LPSP for various pairs of PV modules and batteries is determined, as shown in Figure 7(a). The optimum capacity arrangement of PV modules and batteries obtained for an LPSP is equal to 0, 011 (15, 70 min per day or 3, 98 days per year of blackout) and are roughly worth 150 000 W and 195 000 Ah, respectively, as observed in Figure 7(b).
4.2. Cost Value of System Optimization
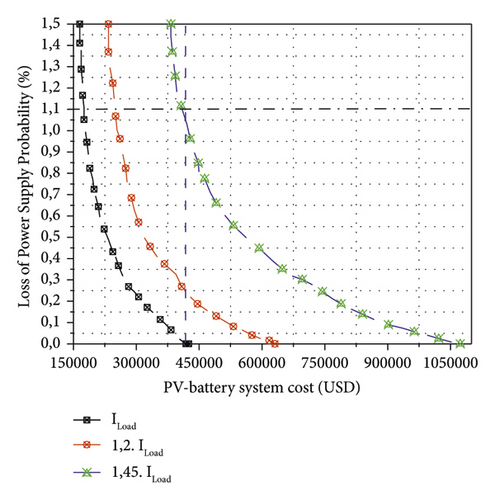
In this section, we discuss the optimal cost value of the PV/battery system for an optimal LPSP value. Three various load profiles such as initial load (Iload) and variables of load profile 1 (1,2 × Iload) and profile 2 (1,45 × Iload) are considered. The obtained Pareto limit profiles can be observed in Figure 8. The safety threshold was set at 1, 1% LPSP as a tolerable threshold for the local electricity supply, viz., up to 15, 70 min per day of failure. All points below the safety threshold are considered optimal points. These values are used to determine the cost of the system for a given LPSP value. The optimal values are those for which the 3 profiles are found in the defined safety threshold. From Figure 8, it can be observed that the optimum points correspond to a cost of 418764, 25 USD with a LPSP equals to 0, 0108. Referring to the aforementioned characteristics of commercially available PV module and battery, 650 PV modules of 250 W and 715 batteries of 300 Ah are sufficient to supply the load energy demand.
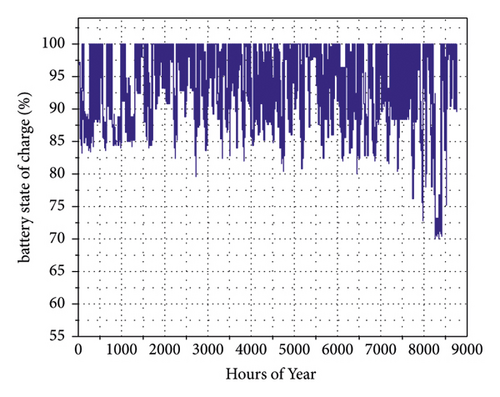
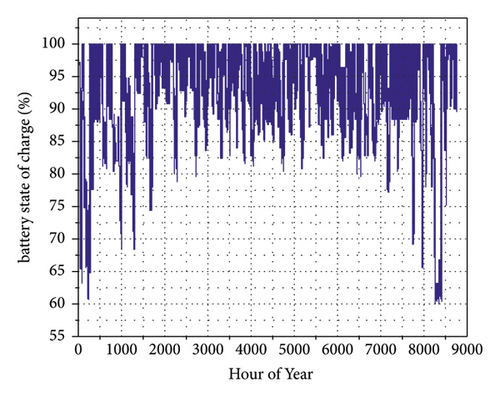
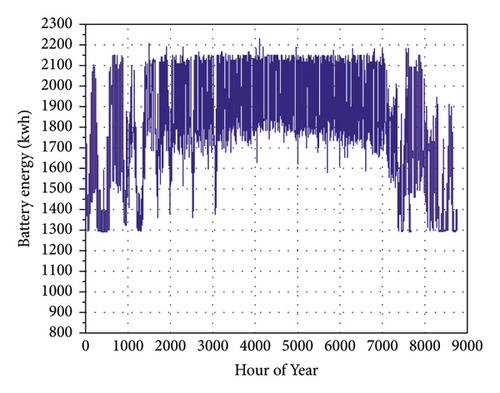
With the optimal arrangement, the SOC of the storage system is evaluated over one year, and the corresponding results are presented in Figure 9. In both cases (Figures 9(a) and 9(b)), the SOC oscillates between an allowed maximum value SOCmax (100%) and minimum value SOCmin (60% of SOC). These SOCs are greater than assumed minimum SOC of 40%. By adding variable load, the storage system is cycled in a fairly SOC large portion during the period November to March due to the higher energy consumption (Figure 9(b)). This allows a correlation between the demand and the storage system use. The higher the demand is, the higher the storage system use is. Therefore, the storage system is less used for the rest of the year as the demand is relatively low. The mean SOC vanishes between 80% and 92%. An increase in initial load could impact the SOC range and battery ageing as well. Figure 9 c shows the fluctuation of the energy level in a battery throughout one year with respect to the variable load profile. These are due to the overused energy per day of the storage system, which leads to an improper charge of batteries even during sunshine. However, all of these fluctuations could be controlled or reduced with proper strategic management.
4.3. Comparison with Other Configurations and Environmental Analysis
- (1)
Sizing of the DG system
-
In [49], a technoeconomic analysis of PV/DG hybrid system without storage was performed for a remote village in Burkina Faso. The authors found that the optimal functioning point of the DG is set at around 90% of its nominal power. Based on this work, it is suggested that the power that could be delivered by DG is 169, 5 kW for this investigation.
- (2)
Sizing of the PV/DG system
-
In the present study, 30% of the PV maximum penetration is considered, as indicated in [50]. A PV array of 47 kW and 169.5 kW are required for a PV/DG system under the assumption that it will meet the load at low irradiation and night.
4.3.1. Economic Analysis Comparison
The included technical data and assumptions on PV, DG, and battery units in this study are from [41, 52, 53]. According to the type of the system, an economic evaluation is presented. For the PV/DG system LCC analysis, we assumed that 8% of the energy consumed between 6:00 am and 5:00 pm is supplied by the PV generator. In this case, the DG should meet the peak load (150 kW) and runs 24 h per day. Thus, the total electrical load to be generated by these systems is about 19 618, 750 kWh over 25 years. Based on the same load demand over 25 years, the PV/DG system LCC (1 082, 701.9 USD) is found to be lower than the PV/battery system LCC (1 293 025.7 USD), which is also lower than that of the DG system LCC (1 682 850.6 USD). The life cycle cost breakdown for each selected energy system is shown in Figure 10.
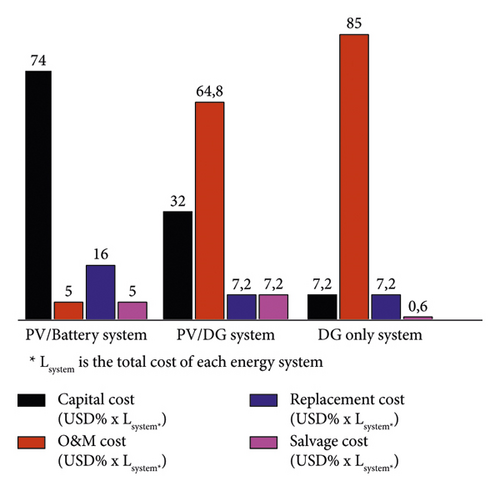
As expected, the investment cost of PV/battery systems is ten times higher than that of DG systems, while O&M costs remain lower, as replacement and salvage costs are minimal.
Indeed, the main issue in the DG system is related to the O&M and the increase in fuel prices. From these results, the PV/DG system is more economical and viable compared to the PV/battery and DG systems. Nevertheless, each system has to be considered on its merits, while taking into account the local conditions, the cost of alternatives, and other parameters such as environment. Although the PV/battery system has a high investment cost, it does not require fuel, high maintenance, and equipment replacement. Compared to hybrid PV/DG systems, the introduction of a DG in the PV/battery system could be a reliable option.
4.3.2. Environmental Analysis
Electrical energy in several remote localities in Burkina Faso is usually produced by the mean of DG. However, the production of energy through fossil fuels is a source of air pollution [54]. The environmental impacts of autonomous PV systems can only be evaluated properly if comparative study involves other energy supply systems. The life cycle impact assessment (LCIA) is used to perform the environmental analysis. Indeed, the LCIA is a crucial step in the life cycle assessment (LCA) methodology. It involves the evaluation and quantification of the environmental impacts of a product, process, or system throughout its entire life cycle, from raw material extraction to disposal or recycling. The LCIA provides a systematic approach to understand the significance of various environmental stressors and their effects on different impact categories.
For a growing population and economical business activities in a remote village, an increase in CO2 emission is expected while combining PV and DG for energy production. Some reports [55, 56] indicated that the emission factor considered for DG is 1.27 kg of CO2/kWh. The value takes into account emissions during fuel combustion, fuel extraction and refining, the manufacturing of the DG itself, and transport (over 100 km). According to Fleck and Huot [57], the total emissions considered for the diesel fuel consumption is 3.15 kg of CO2 per liter. During the life cycle of the DG system, about 1854 tons of CO2 will be released in nature. Compared to the PV/DG system, about 3456 tons of CO2 are saved over its life cycle while the PV/battery system has a CO2 emission free. This later system allows the saving of 17943 tons of CO2 compared to the DG system and 14487 tons of CO2 compared to the PV/DG system. The mayor drawback in this system is the recycling of the batteries at the end of their lifetime because of lack of policies or regulations in most sub-Saharan African region [28]. From the abovementioned, it is clear that the PV/DG system presents advantages compared to PV/battery and DG in terms of cost and environmental pollution, respectively. However, attempts could be made in PV/DG systems to explore the benefits of the incorporation of short-term storage in terms of fuel savings, diesel running time, and storage systems of excess energy.
5. Conclusions
In this work, a bottom-up approach of energy load estimation for a typical village of 4000 people is proposed based on socioeconomic data and household sample survey. The behavior of the hybrid PV/battery system is studied, while considering a design of PV systems in respect of hourly global solar irradiance and real load demand profiles. An economic analysis is also carried out for an optimal size of different components such as PV modules, battery, controller, and inverter by using the ACO technique. The obtained results show that the PV/battery system is qualified to satisfy the load demand in the village location. Furthermore, the SOC analysis of the battery reveals the sustainability of the storage system for more than 20% of the initial load. The economic and environmental aspects of the PV/DG, PV/battery, and DG systems evaluation reveal that the proposed PV/battery system, consisting of 650 PV modules (250 W), 715 batteries (300 Ah), and a 139 kW inverter, is economically disadvantaged compared to the PV/DG system, but less expensive than the DG system. However, it remains environmentally advantageous at long-term exploitation because it releases free carbon emission.
Conflicts of Interest
The authors declare that they have no conflicts of interest.
Acknowledgments
The authors express their gratitude to the Laboratory of Materials and Environment (LA.M.E), University of Joseph KI-Zerbo, Burkina Faso, who permitted to realize the survey and experimental setup.
Open Research
Data Availability
The data used to support the findings of this study are available from the corresponding author on request.


