On the Optimal Control of Intervention Strategies for Hepatitis B Model
Abstract
Hepatitis B is one of the leading causes of morbidity and mortality, affecting hundreds of millions of people worldwide. Thus, this paper focuses on three control measures as the best way to intervene against the hepatitis B viral infection. These measures are condom use, testing and treatment, and vaccination to stop the disease from spreading over a community. The model comprises seven (7) compartments that include susceptible individuals, latent individuals, acute-infected individuals, chronic-infected individuals, infected by carrier individuals, recovered individuals from the disease, and the vaccinated population. We mathematically established a nonlinear differential equation to study the dynamics of the model. The disease-free equilibrium (DFE) and endemic equilibrium (EE) are reached. The basic reproduction numbers, , , and , determine the transmission of the disease and thus are gotten. We perform sensitivity analysis on the reproduction numbers to identify the factors that affect the reproduction numbers. The results of the sensitivity analysis paved a way for introducing a controlled system which was solved using Pontryagin’s maximum principle (PMP) and the optimality system got. The optimality system was then solved numerically using the forward and backward sweep approach, and graphs were generated, establishing the conditions for local and global stability of the disease-free equilibrium using the Routh-Hurwitz criterion and Castillo-Chavez approach, respectively. We also used Pontryagin’s maximum principle to determine the optimality system. The result of the analysis of the stability of the disease-free equilibrium states that hepatitis B virus can be completely wiped out if the rate of infection is kept at a number less than unity. A numerical simulation of the model was carried out and showed that hepatitis B virus transmission can best be controlled when condom use, testing and treatment, and vaccination are implemented.
1. Introduction
A viral infection called hepatitis B can cause both acute and chronic diseases and attack the liver. It is the most severe form of viral hepatitis and a significant global health issue. Around 780,000 individuals are expected to die each year because of the effects of hepatitis B, which include liver cancer and cirrhosis. The virus is extremely infectious and is spread by contact with an infected person’s blood or other body fluids. Hepatitis B virus has an average lifespan of seven days outside the body and is a significant occupational hazard for health workers [1]. Hepatitis means liver inflammation. A vital organ that processes nutrients, cleans the blood, and battles infections is the liver. When the liver is inflamed or impaired, its functions may be affected. Typically, a viral infection causes hepatitis, although other potential causes of hepatitis can exist, such as heavy use of alcohol, chemicals, certain drugs, and certain medical conditions. Acute hepatitis B usually takes 75 days to incubate, although it can range from approximately 30 to 180 days.
The host’s immune response controls liver damage when infected with HBV [1]. Results of HBV infection depend on host characteristics, such as age, gender, genetic background, coinfections, other coexisting diseases, and concomitant medicines, based on viral elements, such as the HBV genotype and viral DNA concentrations. Recent infections with HBV are characterized by the existence of HBsAg and immunoglobulin M (IgM) versus HBcAg in the blood. Patients are extremely HBeAgg-positive throughout the earliest stages of the infection’s replication phase. The initial infection may be symptomatic or asymptomatic, present as, with or without, acute (clinical) hepatitis jaundice, or it may contribute to hepatitis. Approximately 1 percent of acute hepatitis B, characterized by acute inflammation and hepatocellular necrosis, occurs 10 percent of infections in early childhood, perinatal infections (in kids 1-5 years of age), and 30 percent of late infections (in people > 5 years of age). The fulminant disorder progresses rarely in babies and teenagers, but 0.5 percent-1 percent exists. Acute hepatitis B cases in adults have a case-fatality rate of 20 percent to 33 percent. The rate of growth of chronic infection with HBV is inversely associated with age. About 80 percent to 90 percent of infants with perinatal infection develop the infection, 30-50 percent of children who are infected before 6 years of age, and <5 percent of otherwise occurring infections in adults that are well [2]. According to WHO [1], the two principal ways that hepatitis B is spread are horizontally(infected blood) or during pregnancy and childbirth (perinatal transmission), especially during the first 5 years of life from an infected child to an uninfected child. Infants who are infected by their mothers or who are under the age of five frequently get persistent infections. Contaminated bodily fluids like saliva, menstrual, vaginal, and seminal secretions can spread hepatitis B through needle stick damage, tattooing, piercing, and exposure. Hepatitis B can be sexually transmitted, especially in heterosexuals who have several partners and unvaccinated men who have sex with other men or who have sexual intercourse with sex workers.
When newly infected, most individuals do not experience any symptoms. Some individuals, however, have an acute disease with symptoms that extend for several weeks. These symptoms include skin and eye yellowing (jaundice), dark urine, extreme fatigue, nausea, and vomiting. Acute liver failure, which may lead to death, can occur in a small subset of individuals with acute hepatitis. Some patients who have the hepatitis B virus may also develop a persistent liver infection, which can later turn into cirrhosis (liver scarring) or liver cancer. The risk of developing a chronic infection varies with infection age and is highest in infants and young children. 90 percent of newborns and 25 to 50 percent of kids between the ages of 1 and 5 will continue to have chronic HBV infections. In contrast, about 95 percent of individuals fully recover from HBV infection and do not develop a chronic infection. Getting vaccinated is the greatest method to avoid hepatitis B [1]. It is possible to treat hepatitis B virus infection. Typically, therapy is permanent, but acute hepatitis B disease does not have any clear treatment. Providing adequate nutrition and replacing fluids lost from vomiting and diarrhea supports therapy and symptom alleviation, which are the foundation of clinical management [3]. Antiviral treatment for chronic infection with HBV should decrease morbidity and mortality because of progressive liver disease. To prevent the negative effects of drug resistance, the WHO advises using antiviral medications with a high barrier to resistance (either tenofovir or entecavir) as the preferred first-line treatment [4]. Chronic HBV infection can be treated, although it is not curative [5]. It can prevent or postpone the development of cirrhosis, lower the risk of developing hepatocellular carcinoma (HCC), and increase survival through long-term viral suppression. Although tenofovir is commonly available as part of fixed drug formulation antiretroviral regimens at a cheap cost, therapy for HBV infection is not always easily accessible in resource-constrained situations. Evidence suggests that antiviral therapy administered during the third trimester of pregnancy can reduce maternal viral loads and the risk of perinatal transmission of HBV from mothers with very high viral loads [6, 7]. However, evidence suggests that antiviral therapy administered during the third trimester of pregnancy can reduce maternal viral loads and the risk of perinatal transmission of HBV from mothers with very high viral loads [4].
According to WHO in 2015, statistically, about 325 million people worldwide were affected by viral hepatitis, with 257 million people living with hepatitis B and 71 million people living with hepatitis C being the two major killers of the five types of hepatitis. In 2015, 1.34 million deaths were because of viral hepatitis. To inspire further action toward the health targets in the 2030 Sustainable Development Goals, World Hepatitis Day 2017 will be observed under the theme “Eliminate Hepatitis.” In 2016, The World Health Assembly approved WHO’s initial global health sector strategy on viral hepatitis to aid nations in stepping up their responses. According to recent WHO data, over 86 percent of the countries under review have established national goals for the eradication of hepatitis, and over 70 percent have developed national hepatitis policies that include access to quality services for prevention, diagnosis, treatment, and care. In addition, nearly half of the countries surveyed are targeting elimination by ensuring equal access to care for hepatitis. But the WHO is worried that change needs to be sped up. In Africa, a hidden epidemic that affects over 70 million people is hepatitis B. Nine out of ten infected individuals have never undergone testing because of a lack of knowledge and inadequate access to testing and treatment. To meet the worldwide eradication goals by 2030, it is imperative to close the most critical gap in testing and treatment coverage. Viral hepatitis B and C should be promptly diagnosed and treated to prevent death. Considering the aforementioned findings, we suggest the best preventative measures for hepatitis B infections with saturation incidence. Many researchers have established mathematical models to describe the dynamics of the spread of hepatitis B virus infection.
For instance, [8] developed a hepatitis B virus transmission model. Acute infectious and chronic infectious stages are the two categories used to categorize the infectious compartments. As a result, the overall population is split into four groups: susceptible, acutely infected with hepatitis B, chronically infected with hepatitis B, and recovered individuals. Following the model’s formulation, they determine the basic reproduction rate and the disease-free and endemic equilibrium. They also proved that, under certain conditions, the model is both locally and globally stable. To construct a control strategy, three time-dependent control variables are used, such as isolation, treatment, and vaccination. This control technique is aimed at increasing the number of recovered individuals while reducing the number of infected people. To describe numerical simulations and validate all the analytical findings, they finally adopted a numerical approach.
A fractional derivative analysis of hepatitis B disease is developed by the authors [9, 10] by studying a new system of equations in the sense of the Atangana-Baleanu Caputo fractional order derivative (ABC). The proposed method has five distinct compartments, such as the susceptible population, acute infections, chronic infections, the immunized population, and the vaccinated population. Using some well-known results from the fixed point theory, these authors found the Ulam-Hyers type stability and qualitative analysis of the candidate solution. They also established the deterministic stability of the proposed system. These authors analyzed a noninteger order model for hepatitis B (HBV) based on a fractional order derivative of the Caputo singular type. Thus, they could analyze the proposed system to get an approximate or semianalytical solution using the Laplace transform. Similarly, Adomian polynomial decomposition techniques of the nonlinear terms and some homotopy perturbation techniques (HPM) are also studied by these authors.
[11, 12] proposed a model of the hepatitis B epidemic that describes the dynamic features of both acute and chronic HBV. Based on a few characteristics of how the virus spreads, they developed a mathematical model for the dynamics of HBV. The host population is identified by being separated into five groups, namely, susceptible persons, infected individuals, acutely infected individuals, chronic HBV-positive individuals, and individuals who have recovered from infection and have lifetime immunity. The model was examined for potential stable states, and the threshold number was calculated. The model yielded two equilibrium points, namely, disease-free equilibrium and endemic equilibrium. It was established that both of the model equilibrium points are globally stable under specific circumstances. The Lyapunov function theory method was used to determine the global stability of DFE, whereas the geometrical method was employed to determine the global stability of the EE. It is shown that the model displays a backward bifurcation. Two-time dependent controls, such as vaccination and treatment, were adopted to combat the virus. Pontryagin’s approach was used to successfully reduce both acute and chronic HB infections as part of the plan. Finally, some simulations that show the effectiveness of the controls were shown. It was determined that hepatitis B could be eliminated from any population by using such a long-term management plan.
In the “Methods” section, we have established and described the mathematical model. In the “Analysis of the model” section, we assumed constant control for the control parameters. The positivity of solution was proven to be positive, and the system of nonlinear differential equations was well-posed epidemiologically and mathematically. We could determine the fundamental reproduction number by using the next-generation method. The balance between the endemic and disease states was established. The disease-free is locally asymptotically stable when and unstable if . The global stability of the disease-free is proved globally asymptotically stable when the associated reproduction number . While the disease will completely disappear into a stable equilibrium, it will persist and spread endemic in an unstable equilibrium. Using Pontryagin’s maximum principle, we looked into the ideal threshold needed to stop the spread of the hepatitis B viral infection in a community. “Results” based on numerical findings, the combination of condom use for prevention, testing, treatment, and vaccine is the most effective method for controlling the disease. Finally, we conclude this research work in the “Conclusion” section.
2. Formulation of Hepatitis B Model
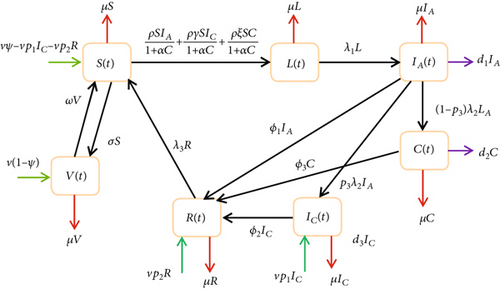
The population of latently infected individuals increases because of new infection at a rate (ρIA + ργIC + ρξC)S/1 + αC. The population decrease because of the progression of latently infected individuals to acutely infected individuals at a rate λ1 and natural death occurs frequently at μ. The population of acutely infected individuals increases because of progression from latent class. The population decrease because of progression into the chronically infected class at a rate p3λ2, where p3 is the proportion that becomes chronically infected, and λ2 is the progression rate, progression into carrier class at a rate (1 − p3)λ2 and treatment of acutely infected individuals at a rate ϕ1. The population of chronically infected individuals increases because of the proportion of acutely infected individuals IA becoming chronically infected IC, where p3 is the progression rate, and it increases by a fraction of newborns that are chronically infected. The chronically infected class decreased because of treatment, and mortality rates were because of disease and natural causes. The carrier individuals increase from the acutely infected class because of the proportion of acutely infected at rate (1 − p3)λ3 and also reduce because of disease-induced death, natural death, and treatment rate. The recovery class increases because of treatment from acutely infected, chronically infected, and carrier individuals’ class, and it is increased by a fraction of newborns at the rate vp3. It is reduced by the loss of immunity at the rate λ3R and natural death rate.
2.1. Basic Properties
Theorem 1. Let the initial solution set S(0), L(0), IA(0), IC(0), C(0), R(0), (0), V(0) > 0 be a nonnegative initial condition, and then, system (2) has a nonnegative solution S(t), L(t), IA(t), IC(t), C(t), R(t), V(t) > 0 for all t > 0. Moreover, limsupt⟶∞N(t) ≤ ν/μ. In addition, if N(0) ≤ ν/μ, then N(t) ≤ ν/μ if the feasible region for system (3)
Proof. From the first equation of system (3), we have the following
From time t = 0 to t = t, we are integrating (+ve of sp) to get
This means that
We used a similar approach to prove that L(t), IA(t), IC(t), R(t), V(t), V(t) > 0 remain nonnegative for all t > 0. The second portion of the theorem, which states that model system (3) is positively invariant, is proved using Equation (5) so that N(t) ≤ ν/μ + (N(0) − ν/μ)exp−μt. It follows that as t⟶∞N(t) ≤ ν/μ. Furthermore, if N(0) ≤ ν/μ, then N(t) ≤ ν/μ. This establishes that Ω is the manifold on which the population has nonzero size.
Thus, it proves the boundedness of the solutions inside Ω. Hence, the solutions to the system (3) are attractive in a region and positively invariant Ω. We notice that system (3) is feasible biologically and mathematically well-posed in Ω from Theorem 1.
3. The Hepatitis B Model Analysis
This section establishes the hepatitis B-free equilibrium state and hepatitis B present equilibrium state, and the basic reproduction number is obtained and carried out stability analysis.
3.1. Equilibrium Points
This only shows that the susceptible individuals’ recruitment and mortality rates change proportionally in the absence of hepatitis B disease.
3.2. Basic Reproduction Number
3.3. Local Stability of the Hepatitis B Disease-Free Equilibrium
Theorem 2. The hepatitis B disease-free equilibrium of system (3) is locally asymptotically stable if and unstable if otherwise.
Proof. The Jacobian matrix of the system (3) at hepatitis B-free equilibrium J(E0) is be given by
The characteristics polynomial J(E0) for (18) is hereby defined as follows:
Using the Routh-Hurwitz criterion, which stipulates that all polynomial (Equation (20)) roots have a negative real component if and only if the coefficients are positive and the determinant of the matrices Hi > 1 for i = 1, ⋯7. It is clear that D1 > 0. Therefore, if Dj > 0 for j = 2 ⋯ 7 and since the hepatitis B free equilibrium is locally asymptotically stable, the Routh-Hurwitz conditions for the 7th-order characteristics polynomial in (20) are satisfied, and we conclude the hepatitis B free equilibrium is locally asymptotically stable (LAS).
3.4. Global Asymptotic Stability for Hepatitis B
The strategy used in [14] is to examine the global asymptotic stability (GAS) of the hepatitis B-free equilibrium for the model (3).
Lemma 3. Let system (3) be in the form
The following requirements must be satisfied to provide global asymptotic stability: H1 : dX/dt = F(X0, 0), X0 is (GAS).
for (X, Z) ∈ Ω, where P = DzG(X0, 0) is an M-matrix and Ω is the biologically feasible region. Hence, E0 is (GAS) if .
Theorem 4. The hepatitis B-free equilibrium of system (3) is (GAS) if and unstable if otherwise.
Proof. We have to establish that the conditions (H1) and (H2) hold when . For the uninfected population, we have
Thus,
Therefore, Since S/1 + αC ≤ S0, we have . The global stability of X0 = (ν(σω + μω + μ2ψ + σμψ − σψω)/μ(μ + ω)(σ + μ + ω), 0, 0, 0, 0, 0, ν(σ + μ)(1 − ψ)/μ(μ + σ + ω)) of the system dX/dt = F(X0, 0) is easy to verify. Therefore, X0 is globally asymptotically stable if . This completes the proof.
3.5. Hepatitis B Model Sensitivity Analysis
In order to determine how these parameters affect the spread of hepatitis B, this subsection investigates on how the system (3) parameters affect the basic reproduction number . The sensitivity index was got by partially differentiating regarding the model (3) parameters. For example, we develop a formula to get the sensitivity index of all the basic parameters in this work, which is defined as ψ that is . The same applies to all model (3) parameters. The result is presented in Table 1.
| Parameter | Baseline values | Sensitivity index | Sensitivity index | Sensitivity index |
|---|---|---|---|---|
| ν | 0.0121 | 1 | 1 | 1 |
| σ | 0.9 | -0.9816 | -0.9816 | -0.9816 |
| ω | 0.01 | 0.9557 | 0.9557 | 0.9557 |
| ψ | 0.05 | 0.0335 | 0.0335 | 0.0335 |
| p1 | 0.11 | — | 1 | — |
| p2 | 0.1 | — | — | — |
| p3 | 0.33 | — | 1 | -0.4925 |
| ρ | 0.8-20.49 | 1 | 1 | |
| γ | 0.01 | — | 1 | — |
| ξ | 0.1 | — | — | 1 |
| ϕ1 | 0.05 | -0.0122 | -0.0122 | -0.0122 |
| ϕ1 | 0.6 | — | -0.8897 | — |
| ϕ3 | 0.98 | — | — | -0.9923 |
| d1 | 0.04 | -0.0098 | -0.0098 | -0.0098 |
| d2 | 0.0007 | — | — | 0.0007 |
| d3 | 0.00054 | — | -0.0080 | — |
| λ1 | 6 per year | 0.0012 | 0.0012 | 0.0012 |
| λ2 | 4 per year | -0.9764 | — | 0.0237 |
| λ3 | 0.03-0.06 | — | — | — |
| α | 0.75 | — | — | — |
We observe that the parameters ν, ω, ψ, p1, p3, ρ, γ, ξ, and λ1 have positive sensitive indices; this means that as the parameter is increased, the basic reproduction numbers , , and rise. The remaining parameters, σ, ϕ1, ϕ3, d1, d2, and λ1, have negative values which implies that , , and decrease for higher values of the parameters.
4. Optimal Control of the Hepatitis B Model
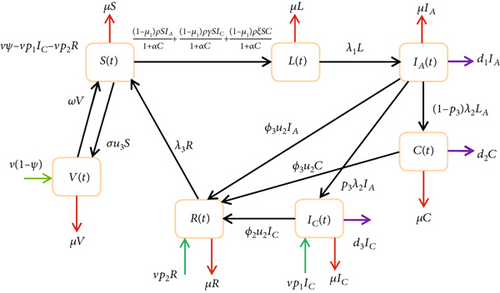
We must determine the best amount of effort that will be required to control the spread of the disease if the eradication of hepatitis B virus infection is not workable owing to economic or social and environmental factors. From Figure 1, we injected the controls, and we come up with a changed model as illustrated in Figure 2.
Theorem 5. Let , , and be optimal controls and S, L, IA, IC, C, R, and V be the solutions of the optimal control problem ((28) and (29)) that minimize J(u1, u2, u3) over U, and then, there are adjoint variables λS, λL, , , λC, λR, and λV satisfying
Proof. To get the differentiable equations governing the adjoint variables, we evaluated the differentiated Hamiltonian functional at the optimal control to prove the above-stated theorem. Hence
With requirements for transversality
Additionally, the optimal functions , , and satisfy
Therefore,
Under [22], we conclude that the a priori boundedness of the state system, the adjoint system, is how we could establish the uniqueness of the optimality system based on standard control arguments including the bound on the controls (33) and (34). The length of the time [0, tf] is constrained in order to ensure the uniqueness of the optimality system [5].
5. Numerical Simulations
- (I)
Strategy A. Use of condoms only as a control strategy in the infected population in latent stages of hepatitis B virus infection
- (II)
Strategy B. Use of testing and treatment only for infected individuals in acutely, chronically, and carrier infection
- (III)
Strategy C. Use of vaccination only as a control strategy in susceptible populace and newborn infants
- (IV)
Strategy D. Use of condoms and testing and treatment only as a control strategy in infective individuals in latent, acute, chronic, and carriers of hepatitis B virus infection
- (IV)
Strategy E. Use of condoms and vaccination only in susceptible, latent, and vaccinated populations of hepatitis B virus infection
- (IV)
Strategy F. Use of a combination of testing, treatment, and vaccination in susceptible populations and treatment only in an infected population with acutely, chronically, and carriers of Hepatitis B virus infection
- (IV)
Strategy G. Use of condoms, testing and treatment, and vaccination in susceptible individuals and treatment in an infected population with acutely, chronically, and carriers of hepatitis B virus infection
| Variable | Description |
|---|---|
| S(t) | Susceptible individuals at time t |
| L(t) | Latent individuals at time t |
| IA(t) | Acute infection individuals at time t |
| IC(t) | Chronic infection individuals at time t |
| C(t) | Carrier infection individuals at time t |
| R(t) | Recovered individuals from hepatitis B virus infection at time t |
| V(t) | Vaccinated individuals at time t |
| Parameters | Description | Values | Source |
|---|---|---|---|
| ν | Birth rate | 0.0121 | [15] |
| μ | Natural death rate | 0.0069 | [15] |
| σ | Vaccination rate | 0.9 | [16] |
| ω | Vaccination wine rate | 0.01 | [16] |
| ϕ | Proportional of unvaccinated infant | 0.05 | [16] |
| p1 | A fraction of new born from recovered | 0.11 | [17] |
| p2 | A fraction of new born from recovered | 0.1 | [17] |
| p3 | Progression of acute infected that progresses to chronic infected | 0.33 | [16] |
| ρ | Transmission rate of hepatitis B virus | 0.8-20.49 | [18] |
| γ | Modification parameter depicting infectiousness of chronic HB virus | 0.01 | Assumed |
| ξ | Modification parameter depicting infectiousness of chronic HB virus | 0.1 | Assumed |
| ϕ1 | Testing and treatment rate of acute infection | 0.05 | [8] |
| ϕ2 | Testing and treatment rate of chronic infection | 0.06 | [8] |
| ϕ3 | Testing and treatment rate of carrier infection | 0.98 | Assumed |
| d1 | Disease-induced death in acute infection | 0.04 | [8] |
| d2 | Disease-induced death in chronic infection | 0.0007 | Assumed |
| d3 | Disease-induced death in carrier infection | 0.00054 | [8] |
| λ1 | Rate of moving from latent to acute infection | 6 per year | [19] |
| λ2 | Rate at which individual acute infection class | 4 per year | [19] |
| λ3 | Loss of recovery rate | 0.3-0.6 | [19] |
| α | Saturated incidence | 0.75 | Assumed |
| A1 | Weight factor for acute infection | 0.01 | [1] |
| A2 | Weight factor for chronic infection | 0.05 | [1] |
| A3 | Weight factor for carrier infection | 0.05 | [8] |
| B1 | Weight factor for the control u1 | 2.0 | Assumed |
| B2 | Weight factor for the control u2 | 1.5 | [8] |
| B3 | Weight factor for the control u3 | 2.7 | [8] |

5.1. Strategy A: Use of Condom Only
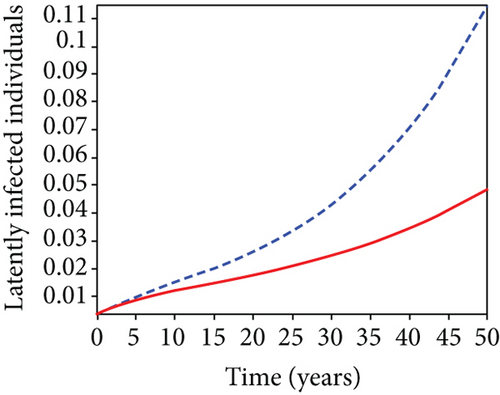
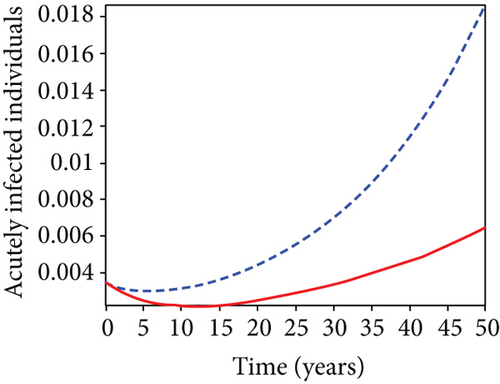
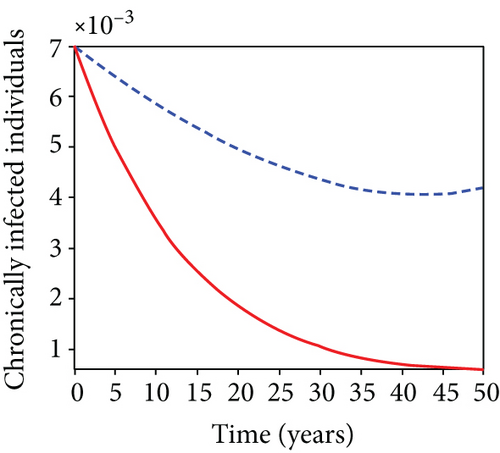
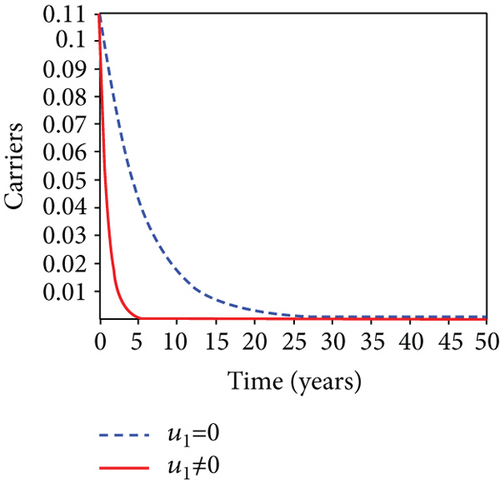
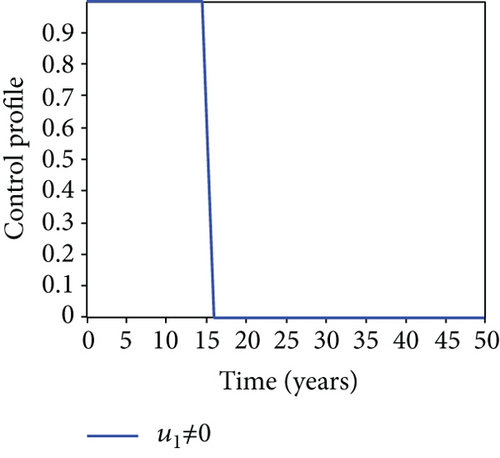
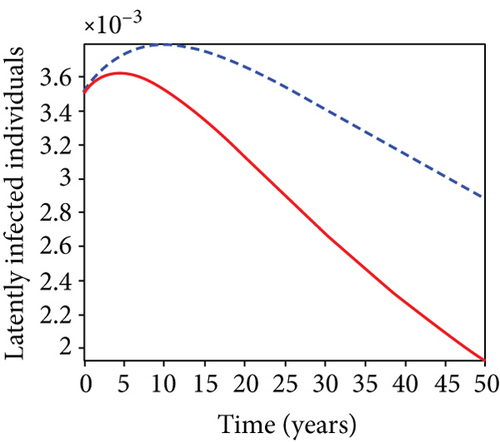
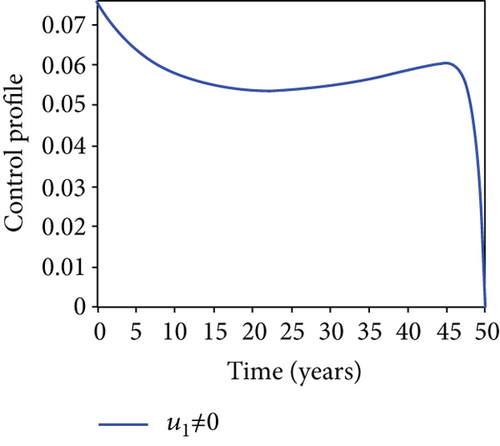
When condoms are used (u1) as an individual defense against hepatitis B virus infection in the population, we describe the simulation of an optimum control system (28) for strategy A to maximize the objective functional J, while we set (u2) and (u3) to zero. Figures 3(a)–3(e) show a significant difference in the population at various infection levels, with optimal strategy (u1 ≠ 0) when compared to the population without optimal strategy control (u1 = 0). We observed in Figure 3(a) that because of the control strategy, the number of latently L infected individuals with HBV decreases, while the population increases when there is no control. Similarly, Figure 3(b) shows a decrease in the presence of control strategy for acutely IA infected individuals with HBV in the population, but the uncontrolled population in Figure 3(b) resulted in increased endemic foci of the disease. In Figure 3(c), we see that the population of chronically IC infected individuals with HBV also reduced due to control while the population increases in the absence of control. In Figure 3(d), the population of carrier individuals decreases because of the practice of condom use as a control strategy, while the population continued to grow in the absence of control. The control profile in Figure 3(e) revealed that using a condom only as a strategy for preventing HBV infection is at the upper bound of tf = 50 years before it gradually dropped to the lower bound. The infection stage of HBV in both the population of latently, acutely, and chronically infected and carriers yielding the strategy is not the best result when the condom is only used as a control strategy.
5.2. Strategy B: Use of Testing and Treatment Only
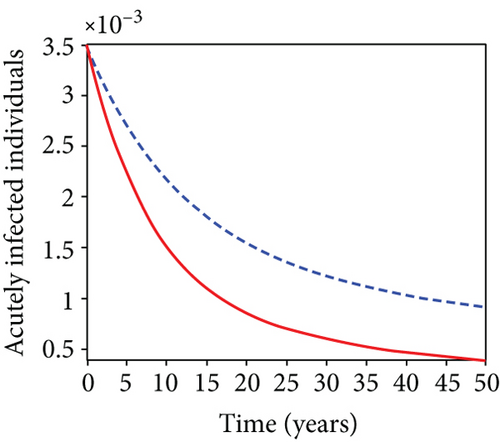
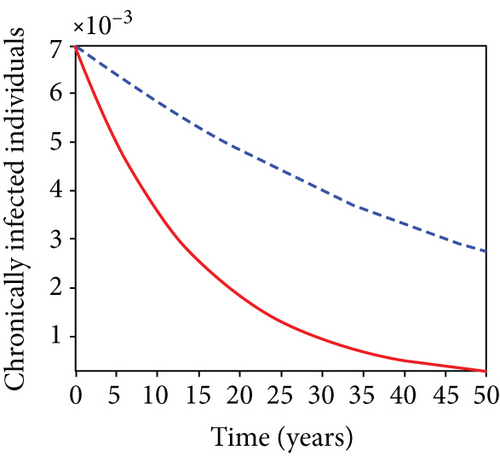
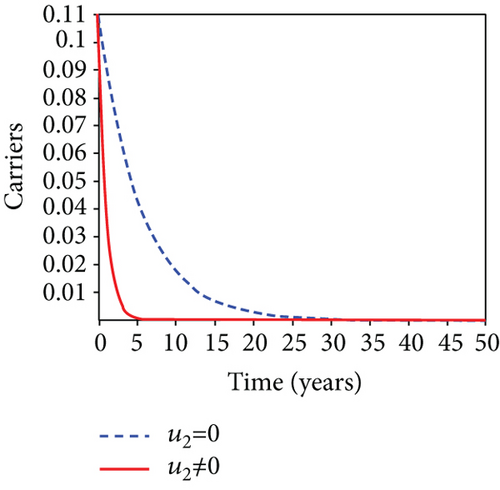
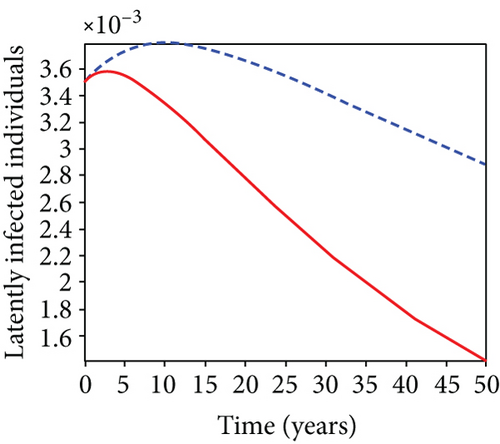
This strategy shows the simulation of optimal control system (28) for testing and treatment (u2); as the only control strategy in the infected population was used to optimize objective functional J, we set the other controls; u1 is the use of condom and vaccination u3 to zero. This simply means that only the infected population was considered for testing and treatment. In Figure 4(a), the findings reveal a substantial difference in acutely infected, chronically, and carrier individuals with optimal strategy compared to the infected population with HBV without control. This strategy shows that effective testing and treatment have a significant impact in reducing the disease among infected individuals in the population. Figure 4(b) demonstrates that in the presence of testing and treatment u2 as a control strategy, the number of infected individuals in acutely, chronically, and carriers decreases, and it increases compared to when there is no control. In Figure 4(c), we noticed that there is a significant difference in the population of infected HBV when testing and treatment u2 are used as control strategy compared to without optimal control. Similarly, in Figure 4(d), the results revealed that the population of infected carriers (C) reduced because of testing and treatment and eventually increase when there is no testing and treatment. This proves that there is a close connection between the three infectious people in the population. In the control profile in Figure 4(e), we observe that the most effective testing and treatment control u2 rise and stabilize at the upper bound for tf = 50 years before progressively declining to the lowest bound.
5.3. Strategy C: Use of Vaccination Only
In strategy C, we consider vaccination u3 in the population of vaccinated as the only control strategy to optimize the objective functional J, and we set condom use u1 and testing and treatment u2 of infected individuals to zero. Figure 5(a) shows that when there is control, the number of HBV-infected people decreases to the minimal level as compared with the number of infected individuals when control is absent. The number of acutely IA infected individuals with HBV in Figure 5(b) reduces because of vaccination of the infected population, and the population increases in the absence of control strategy. In Figure 5(c), the number of chronically IC infected individuals with HBV decreases because of optimal strategy in the population, while the number increases in the absence of optimal control strategy. The population of carriers infected with HBV in Figure 5(d) decreases with optimal strategy while it increases in the absence of a control strategy. The control profile in Figure 5(e) rises at an upper bound of tf = 50 years’ time before gradually dropping to the lower bound.
5.4. Strategy D: Use of Condom + Testing and Treatment Only
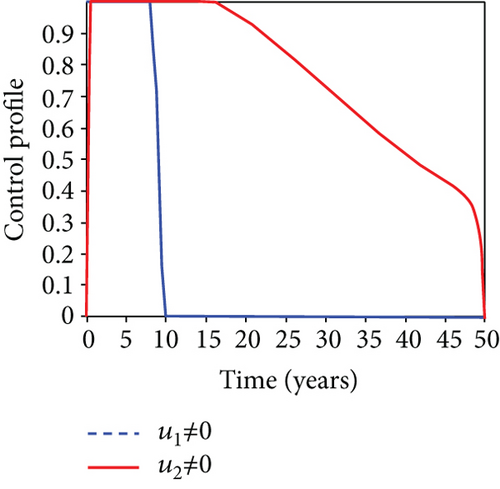
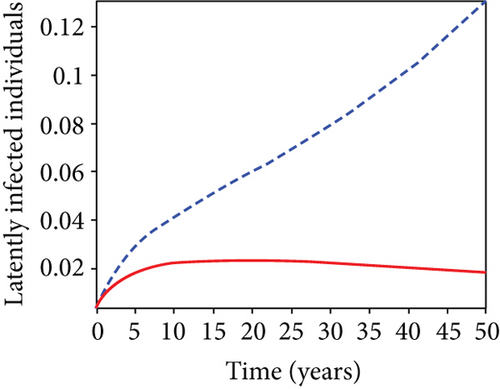
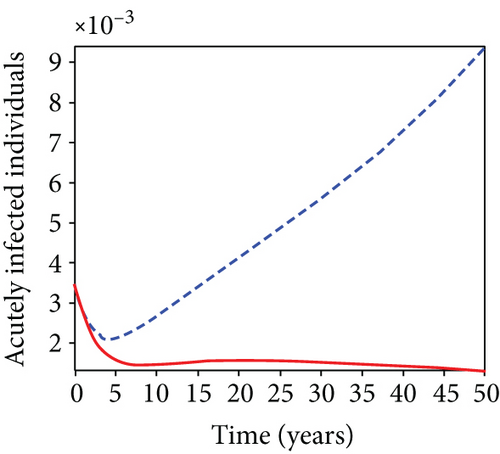
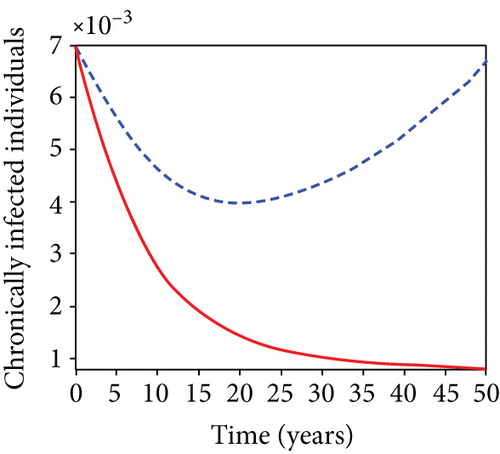
Condom use is presented in strategy D as (u1) and testing and treatment (u2) in infected population to optimize the objective functional J while setting the vaccination u3 in susceptible population to zero. We observed in Figures 6(a)–6(c) that, because of the control strategies, the number of latently (L), acutely (IA), and chronically (IC) infected individuals with HBV decreases as against the increase in the uncontrolled case. Similar decrease in Figure 6(d) is observed for the carrier-infected population with HBV in the control strategy, while an increased number is observed when there is no control. In Figure 6(e), the control profile, on the control, is at the upper bound for a maximum time tf = 10 years and drops gradually until it reaches the lower bound, while control on testing and treatment u2 started from the lower bound, reaches the maximum (upper bound), and remain there for tf = 16 years before it drops gradually falling to the lower bound.
5.5. Strategy E: Use of Condom + Vaccination Only
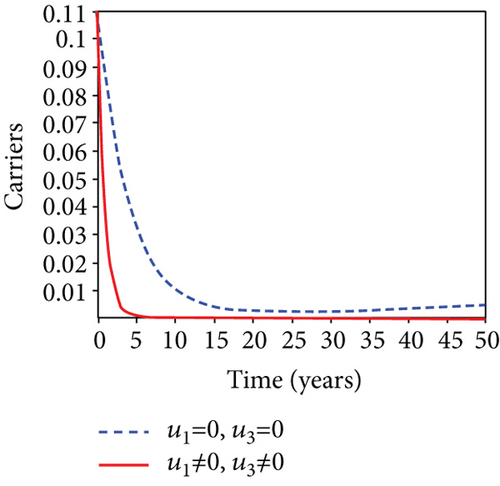
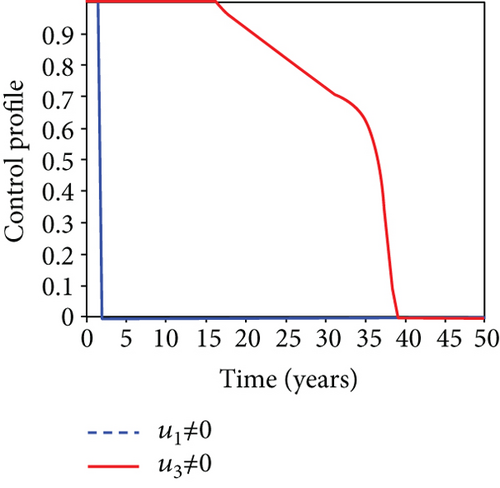
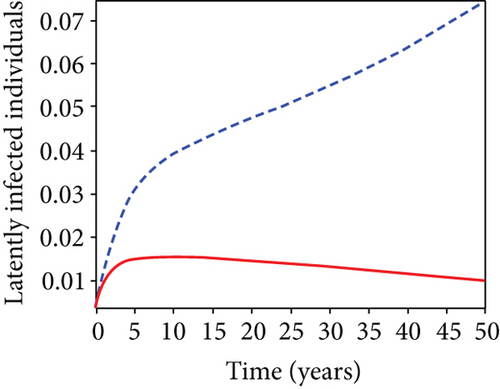
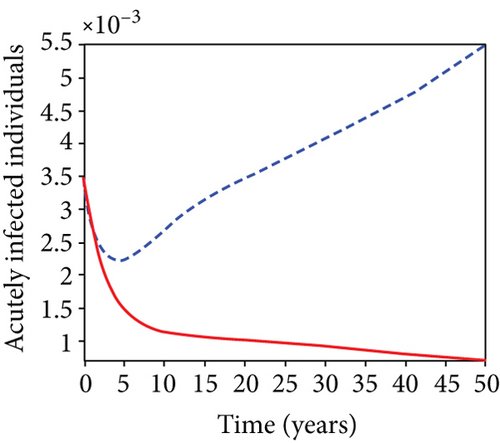
Strategy E presents the use of condom as the control (u1) and vaccination (u3) on the infected population to improve the functional objectives J, while setting the testing and treatment (u2) of the infected population to zero. In Figures 7(a)–7(c), the population of infected individuals with HBV also decreases in the presence of control u1 and u3 whereas the number of infected individuals increases when there is no optimal strategy. Figure 7(d) describes a scenario where the population of infected individuals decreases because of the presence of control (u1, u3), and it increases when the control strategy is totally absent. In contrast to the control profile in Figure 7(e), it shows that the control (u1) is reached at the upper bound tf = 16 years before dropping to lower bound, while the vaccination (u3) is at lower bound tf = 1.7 years moved to the upper bound before coming back to lower bound again (in a graph which line is a vaccinated).
5.6. Strategy F: Testing and Treatment + Vaccination Only
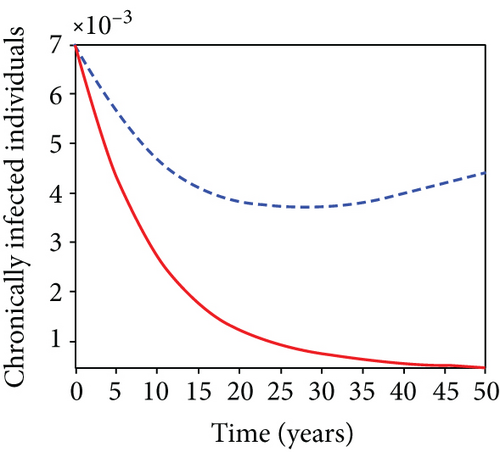
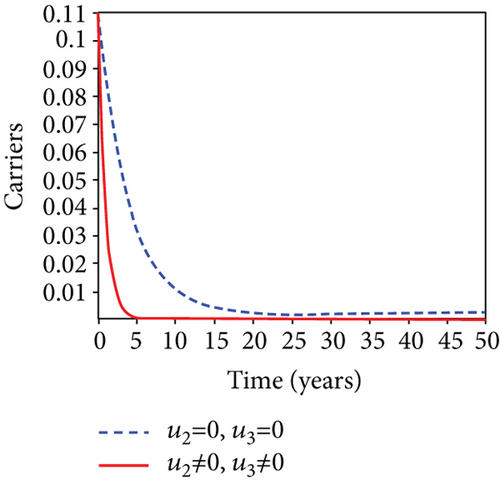
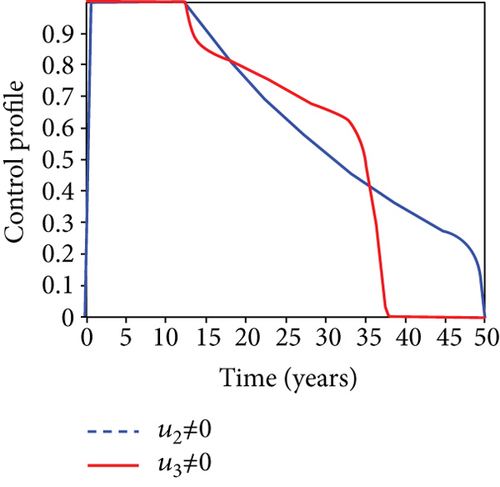
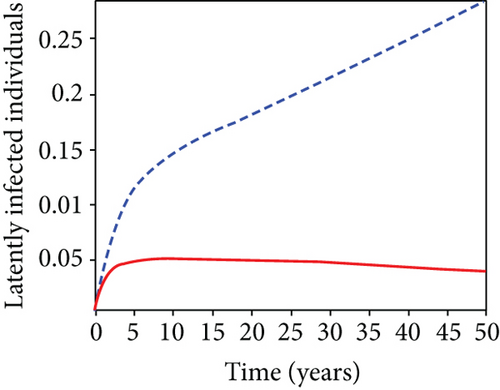
In this strategy, the testing and treatment of infected individuals u2 and vaccination of susceptible individuals u3 and the objective functional J are optimized through controls, while setting the control u1 to zero. Figures 8(a)–8(c) demonstrate a substantial difference in the infected population with latently L, acutely IA, and chronically IC hepatitis B virus with optimal control strategy compared to the number of infected individuals when there is no control. Figure 8(d) shows that the control measures resulted in a drop in the number of infected individuals, but the number of infected persons increased in the absence of control. The control profile in Figure 8(e) shows that the optimal control on testing and treatment u2 is at the upper bound tf = 12.5 years before it drops to the lower bound, whereas control u3 rises to the higher bound before it gradually fall to lower bound tf = 5 years.
5.7. Strategy G: Use of Condom + Testing and Treatment + Vaccination
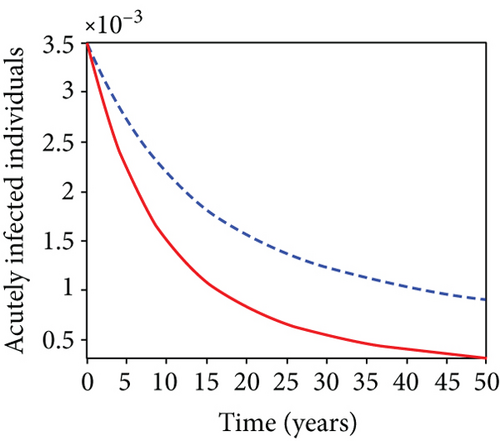
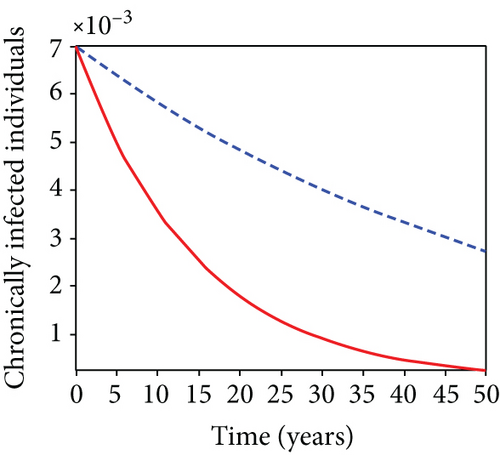
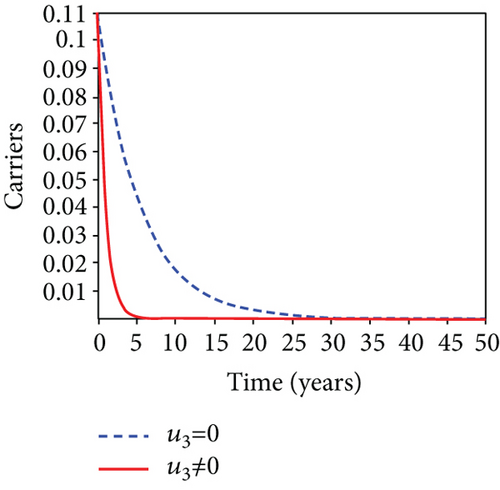
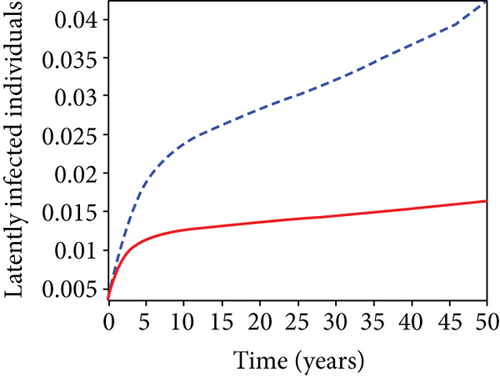
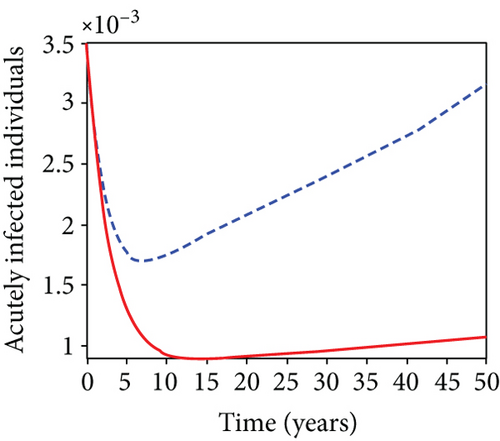
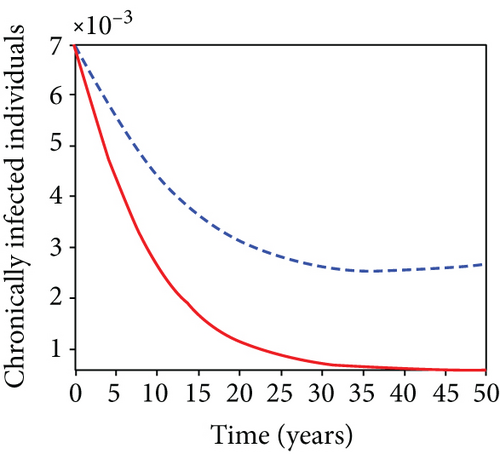
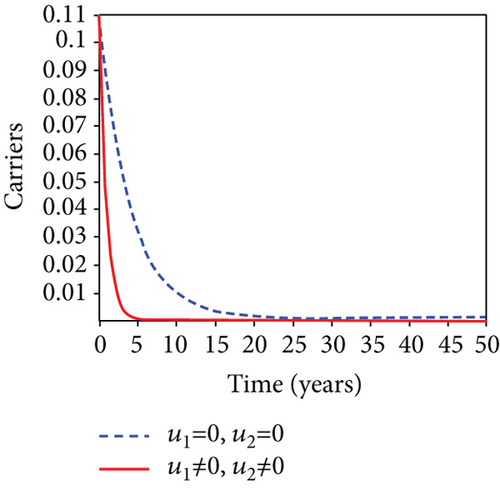
In strategy G, we present the use of condoms, testing and treatment of infected individuals, and vaccination; we considered all three (4) controls (u1, u2, u3) in optimizing the objective functional J. Compared to the situation without control, the number of people infected with the hepatitis B virus significantly decreased because of the control techniques, as shown in Figures 9(a)–9(c). We discovered that, in contrast to the infected population without an optimal strategy, Figure 9(d) demonstrates that the number of infected populations with carriers (C) falls due to control (u1, u2, u3).
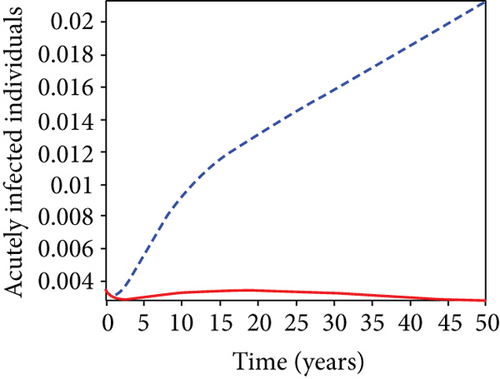
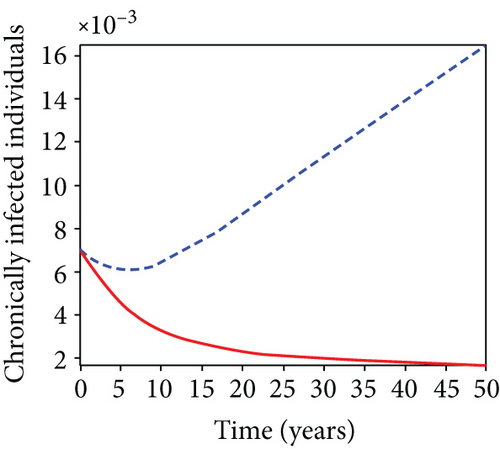
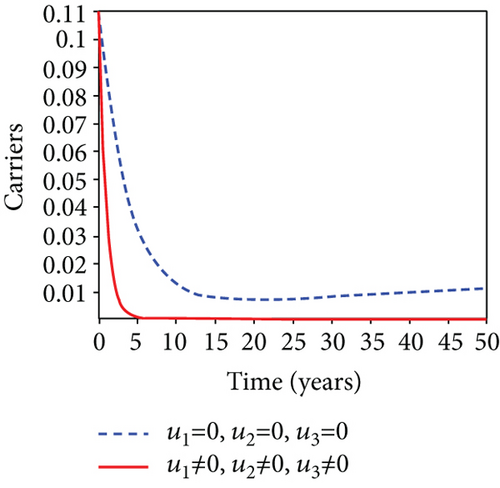
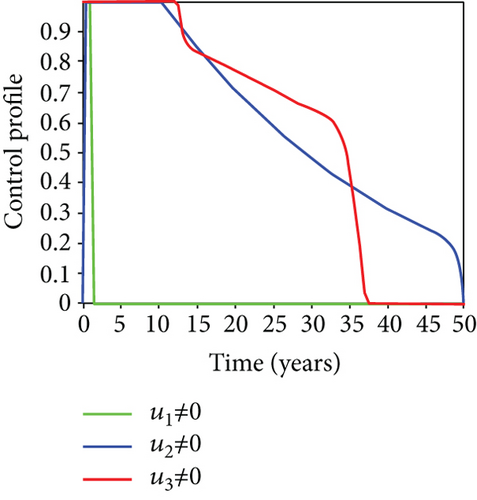
We observed in Figures 9(a)–9(c) that the number of people with hepatitis B virus infection significantly decreased because of the control techniques, in contrast to a situation where there is no control. We also noticed that Figure 9(d) demonstrates that the prevalence of infected people who are also carriers (C) decreases due to control (u1, u2, u3) as compared to the infected population without an optimal strategy. The control profile in Figure 9(e) on control u1 rises to the upper bound tf = 0.1 year before it gradually drops to the lower bound tf = 2 years’ time, and the control u2 began from the lower bound and escalated to the upper bound in tf = 10.5 years while the control u3 is at the upper bound before it gradually drop to the lower bound. It simply depicts how the transmission of HBV might be decreased or eliminated in the shortest workable time if an ideal method was used on the population of infected classes. Using a condom, testing and treatment, and vaccination strategy appeared to be the most effective strategy, as was observed from the graphs.
6. Conclusion
In this research, we proposed an S − L − IA − IC − C − R − V model with three control intervention strategies, which is a changed version of the work of Vahindian, Akbari, and Heydari (2014). In the analytical solution, we considered the control parameters to be constant. The positivity of the solution was proven to be positive, and both mathematically and epidemiologically, the system of nonlinear differential equations was well-posed. Using the next-generation method, we could get the basic reproduction number. The disease-free and endemic equilibrium was established. The disease-free is locally asymptotically stable when and unstable if . The global stability of the disease-free is proved globally asymptotically stable when the associated reproduction number . In a stable equilibrium, the disease will entirely die out, whereas in an unstable equilibrium, it will persist and become endemic. We investigated the optimal level required to put down the spread of the hepatitis B virus infection in a population using Pontryagin’s maximum principle. Numerical results show the best strategy for control of the combination of the use of a condom for prevention and testing and treatment and vaccination.
As future work, we have broadened the number of compartments that make up our field of study of the hepatitis B virus disease (HBV). Thus, we plan to consider the economic aspect to understand this disease.
Conflicts of Interest
No competing interest is hereby declared by the authors.
Authors’ Contributions
The development and simulation of the model were done by Abdulfatai, Atte Momoh. Model analysis, discussion of results, and typesetting were implemented by Audu Abubakar. All authors approved the final manuscript.
Acknowledgments
The authors acknowledged the facilities provided by Modibbo Adama University, Yola, Nigeria, and Tertiary Education Trust Fund.
Open Research
Data Availability
The data used to support the findings of this study are available from the corresponding author upon request.


