Analysis of MRR, Thrust Force, and Torque in Drilling Al/BN/Al2O3 Composites using Hybrid Grey–Taguchi Technique
Abstract
The demand for hybrid composite materials has been expanding globally in all kinds of mechanical industries. Drilling is one of the basic operations required in manufacturing of various components and choosing optimum parameters of drilling is vital for getting good quality holes. The main objective of our work is to determine the ideal parameters of drilling and tool coatings required to minimize the thrust force and torque in drilling and to maximize the material removal rate (MRR) using Grey–Taguchi technique. Hybrid composite specimen made by reinforcing Al7075 alloy with 4% of aluminum oxide and 2% of boron nitride in stir casting process and drilling was carried out in a sequence at different drilling feed rates (40, 80, and 120 mm/min) and spindle speeds (1,200, 2,400, and 3,600 rpm) in a vertical machining center attached with drill tool dynamometer, using twist drills of diameter 5 mm and point angle 118° made of uncoated carbide, diamond-like carbon (DLC)-coated carbide and high carbon (HC)-coated carbide. The recorded thrust force and torque from the dynamometer and the computed MRRs during each drilling operation are tabulated as per Taguchi’s L27 orthogonal array and the results are analyzed using hybrid Grey–Taguchi technique. In our analysis, the optimum thrust force of 62.12 N and torque of 0.766 Nm were obtained when using a DLC-coated tool at a maximum speed of 3,600 rpm and minimum feed rate of 40 mm/min. An optimum MRR of 178.79 mm3/s was obtained while using DLC coated at a maximum speed of 3,600 rpm and a maximum feed rate of 120 mm/min.
1. Introduction
The aluminum hybrid composites have been focused by many investigators in recent years, mainly due to their excellent mechanical properties, extreme resistance to corrosion, and wide scope of applications [1]. While fabricating mechanical components using composite materials, effective drilling operation is unavoidable at the stage of assembly by mechanical joining processes like riveting, bolting, etc., and this task is highly formidable one because of the reinforcement by hard ceramic particles [2]. These kinds of challenges provide more scope for research in this domain. Various responses, like high material removal rate (MRR), better surface finish, minimum drilling force and torque, minimum cylindricity, and least circularity error, are considered for effective drilling process and among these responses, MRR, thrust force, and torque are viewed in our investigations.
Taguchi technique is one of the statistical methods developed by Genichi Taguchi, a Japanese statistician, to improve the quality of a manufacturing process or product by keeping the variance very low at the output. In our investigations, Taguchi technique is integrated with Grey relational analysis (GRA) [3, 4] to find out the ideal drilling parameters that minimize the thrust force and maximize the MRR. Multiperformance features integrating many parameters at a time can be effectively analyzed by GRA by converting the multiple performance characteristics into one numerical score known as Grey relational grade (GRG) [5]. Based on GRG, the optimum level of parameters can be obtained.
1.1. Related Works
Udaya Prakash et al. [6] investigated the effect of various drilling parameters on burr height and the force induced on drilling LM6/B4C/Fly ash composites using GRA and found that the feed rate is the most influencing factor subsequently the reinforcement percentage and drilling speed. Bammidi et al. [7] investigated the drilling behavior of Ti–6Al–4V alloy and found out the optimum parameters to maximize MRR and minimize the circularity error using Taguchi and analysis of variance (ANOVA) techniques. Palanikumar and Muniaraj [8] carried out drilling experiments on Al6061 reinforced with SiC and graphite using carbide drills of varying diameters coated with TiN and the effect of various drilling parameters influencing thrust force is determined by response surface methodology. Sarala and Udaya Prakash [9] investigated the influence of various drilling criteria, tool materials, and reinforcement percentages on surface finish, drilling force, etc., while drilling LM6-based hybrid composite materials to find out ideal parameters using GRA technique. In this study, we have chosen aluminum–zinc alloy (AA7075) as the base material because. It exhibits very good mechanical properties with great fatigue and corrosion resistance. Boron nitride and alumina have chosen as reinforcement materials to improve the tribological properties of the base material further and find its applications in automobiles, aerospace, and high-stressed structural components [10]. The size of reinforcement particles used are 70 µm of BN and 50 µm of alumina. Because of the extremely abrasive nature of the reinforcement materials used, drilling of this hybrid composite material is tedious and so there is more scope for research in this area.
According to the literature review, few studies have been conducted on the machining of hybrid aluminum metal matrix composites reinforced with primary (aluminum oxide) and secondary (boron nitride) ceramic particles because of wettability limitations. Therefore, conducting drilling experiments on the developed hybrid metal matrix composites while using diamond-like carbon (DLC)- and high carbon (HC)-coated carbide drills with different point angles, feed rates, and drilling speeds is considered to be novel in this work. To design and analyze experiments, Taguchi methodology is employed.
Our objective is to examine and explore the effect of tool coatings, drilling speed, and the drilling feed rate on the MRR, drilling force developed, and drilling torque during the drilling process. The drilling process was carried out by VF30 computer numerical control (CNC) machining center.
2. Materials and Methods
For our investigation, we have chosen aluminum7075 as the base material, boron nitride, and alumina as reinforcements. The major composition of Al7075 is given in Table 1.
| Element | Zinc | Magnesium | Copper | Iron | Chromium | Manganese | Silicon | Titanium | Aluminum |
|---|---|---|---|---|---|---|---|---|---|
| % | 5.5 | 2.5 | 1.5 | 0.5 | 0.25 | 0.3 | 0.4 | 0.2 | Balance |
The hybrid composite specimen was prepared by stir casting method, in which small pieces of Al7075 cut from a long rod are heated in a crucible above the liquidous temperature and the molten metal is mixed with preheated BN of APS 70 µm with a density of 3.7 g/cm3 and Al2O3 of APS 50 µm with a density of 3.75 g/cm3 by mechanical stirring at the speed of 300–400 rpm for half an hour and the semisolid mixture is poured into the cavity and permitted to become hardened in the air. The cast specimen is milled to the size of 100 mm × 100 mm × 10 mm for our experimentation.
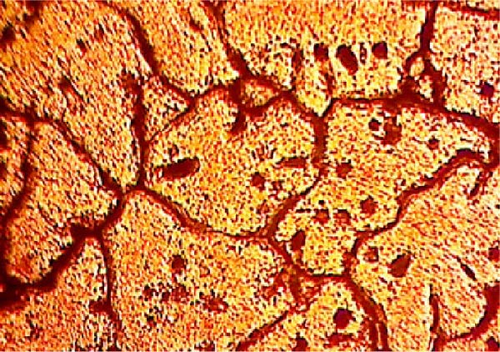
Figure 1 shows the microstructures of the specimen under magnification of 100x and 200x, here, the boron nitride particles in the composite are shown by distinct and thick grain fringes and few of the particles are scattered in the matrix. It also shows the homogeneous mixing of aluminum oxide in the aluminum matrix.

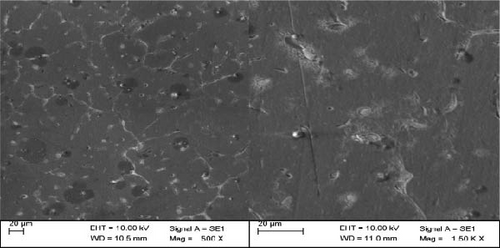
The homogeneity of the reinforcements boron nitride and alumina in the base metal Al7075 is assured by the scanning electron microscopy image of the prepared specimen with 500x and 1,500x magnification as shown in Figure 2. The surface becomes fine and the aluminum flakes are extruded on the surface. Figure 2 also shows the aluminum oxide particles on the surface as gray dots.
The hardness of aluminum hybrid composites was analyzed as per American Society for Testing and Materials standards and it was observed that the presence of hard ceramic reinforcement increases the hardness of synthesized composites. This is due to the fact that these hard ceramic reinforcement hinders the motion of dislocation and it reduces the grain size. It was observed that the hardness of synthesized composites (169 MPa) increased to 49% in comparison with cast alloy. Considering this as a prime factor it was decided to perform drilling operation using CNC for manufacturing applications.
The induced force and torque during drilling were measured with the help of Kistler dynamometer coupled with the machine and recorded by dynaware software. By measuring the weight of the specimen before and after drilling every hole and the time taken, the MRR can be calculated. The three levels of drilling speed, feed, and tool coating materials used are mentioned in Table 2.
| Level | Tool material | Spindle speed (rpm) | Feed rate (mm/min) |
|---|---|---|---|
| 1 | Uncoated carbide (A) | 1,200 | 40 |
| 2 | DLC coated (B) | 2,400 | 80 |
| 3 | HC coated (C) | 3,600 | 120 |
- DLC: diamond like carbon, HC: high carbon. Diameter of all the twist drills is 5 mm and their point angle is 118°.
We planned our experimental design according to Taguchi’s L27 orthogonal array for the three parameters under three levels, to determine the most effective tool coating material for the optimum speed and feed of the drilling process to attain minimum drilling force, torque and maximum MRR using GRA coupled with Taguchi technique.
Taguchi technique is an effectively coordinated way to find the most influencing combination of input factors. In this technique, a tailor made L27 orthogonal array was utilized to detect the most influencing factors.
Grey analysis involves a transparent group of statements concerning system solutions. Mostly, there is no solution at one end and at the other end, this system with excellent data features a distinctive solution. Within the middle, Grey systems can provide a kind of obtainable solution. GRA does not commit to notice the simplest result, however, will offer techniques to determine a decent and an applicable result for real-world issues [11].
The results of our experiments are investigated for optimization using Grey–Taguchi technique, which is a hybrid technique used for optimization. Taguchi technique is one of the significant techniques used to determine the optimal level of the input parameters for a single objective function. But this approach is not suitable for multiobjective problems and so we go for a hybrid technique like Grey–Taguchi method [12, 13].
For Taguchi technique, we have performed drilling experiments using 27 different combinations of the three parameters, and their responses viz, thrust force, drilling torque, and MRR are determined and tabulated. Induced force and torque during drilling operations were taken directly from the output of drill tool dynamometer using dynaware software and the MRR value was calculated by the weight loss during each experiment.
The three output responses of 27 drilling experiments were evaluated by their corresponding SNR values (S/N ratio) using smaller the better formula for thrust force and torque and larger the better formula for MRR and are named SNR1, SNR2, and SNR3, respectively.
The formulae to calculate the SNR values are given in Equations (1) and (2), where Y is the response value and n is the number of trials. As we need to compare the SNR values of all the three responses and all the responses are in different ranges, we have to normalize SNR1, SNR2, and SNR3 values into the range of 0–1. Equations (3) and (4) show the formulae for normalization [15].
In hybrid Grey–Taguchi analysis, the Grey relational coefficient (GRC) can be calculated from the normalized SNR values, using the formula given in Equation (5), following which the GRG can be determined, which is helpful to find the relation between the best experimental result and the actual one.
Since the values are normalized, Δmin and Δmax are always equal to 0 and 1, respectively. The GRG is estimated by taking the mean value of GRC for each and every trial [16].
3. Results and Discussion
The tool material, drilling speed in rpm, and the tool feed rate in mm/min are the three input factors considered in our experimental study and the output parameters thrust force, drilling torque, and the MRR values are determined and tabulated as per Taguchi’s L27 array as shown in Table 4. SNR values for thrust force, drilling torque, and the MRR are estimated individually for 27 trials and are named SNR1, SNR2, and SNR3, respectively in Table 3.
| Trial no. | Tool material | Speed (rpm) | Feed rate (mm/min) | Thrust force (N) | Torque (Nm) | MRR (mm3/s) | SNRA1 | SNRA2 | SNRA3 |
|---|---|---|---|---|---|---|---|---|---|
| 1 | A | 1,200 | 40 | 135.6 | 1.349 | 34.06 | −42.645 | −2.599 | 30.646 |
| 2 | A | 1,200 | 80 | 198.5 | 1.808 | 67.85 | −45.955 | −5.144 | 36.631 |
| 3 | A | 1,200 | 120 | 269.82 | 2.501 | 106.78 | −48.621 | −7.963 | 40.570 |
| 4 | A | 2,400 | 40 | 120.7 | 1.191 | 42.19 | −41.634 | −1.521 | 32.504 |
| 5 | A | 2,400 | 80 | 166.84 | 1.749 | 86.85 | −44.446 | −4.855 | 38.775 |
| 6 | A | 2,400 | 120 | 190.82 | 2.015 | 122.18 | −45.612 | −6.086 | 41.740 |
| 7 | A | 3,600 | 40 | 102.04 | 0.995 | 53.52 | −40.175 | 0.046 | 34.570 |
| 8 | A | 3,600 | 80 | 120.9 | 1.160 | 101.32 | −41.649 | −1.291 | 40.114 |
| 9 | A | 3,600 | 120 | 161.2 | 1.595 | 146.78 | −44.147 | −4.053 | 43.333 |
| 10 | B | 1,200 | 40 | 112.71 | 1.154 | 31.93 | −41.039 | −1.246 | 30.084 |
| 11 | B | 1,200 | 80 | 182.8 | 1.902 | 87.59 | −45.240 | −5.582 | 38.849 |
| 12 | B | 1,200 | 120 | 235.21 | 2.297 | 125.99 | −47.429 | −7.225 | 42.006 |
| 13 | B | 2,400 | 40 | 78.84 | 0.809 | 51.63 | −37.935 | 1.839 | 34.258 |
| 14 | B | 2,400 | 80 | 122.84 | 1.310 | 107.86 | −41.787 | −2.348 | 40.657 |
| 15 | B | 2,400 | 120 | 162.54 | 1.813 | 157.39 | −44.219 | −5.166 | 43.939 |
| 16 | B | 3,600 | 40 | 62.12 | 0.766 | 58.39 | −35.865 | 2.318 | 35.327 |
| 17 | B | 3,600 | 80 | 94.72 | 0.970 | 126.52 | −39.529 | 0.266 | 42.043 |
| 18 | B | 3,600 | 120 | 112.7 | 1.201 | 179.78 | −41.038 | −1.588 | 45.095 |
| 19 | C | 1,200 | 40 | 128.71 | 1.311 | 36.50 | −42.192 | −2.349 | 31.245 |
| 20 | C | 1,200 | 80 | 190.21 | 2.047 | 77.73 | −45.585 | −6.222 | 37.811 |
| 21 | C | 1,200 | 120 | 280.2 | 2.683 | 111.39 | −48.949 | −8.573 | 40.937 |
| 22 | C | 2,400 | 40 | 104.27 | 1.091 | 52.20 | −40.363 | −0.757 | 34.353 |
| 23 | C | 2,400 | 80 | 157.8 | 1.619 | 100.99 | −43.962 | −4.184 | 40.086 |
| 24 | C | 2,400 | 120 | 188.38 | 1.922 | 156.79 | −45.501 | −5.674 | 43.906 |
| 25 | C | 3,600 | 40 | 83.03 | 0.892 | 58.53 | −38.385 | 0.997 | 35.347 |
| 26 | C | 3,600 | 80 | 111.08 | 1.099 | 113.92 | −40.913 | −0.816 | 41.132 |
| 27 | C | 3,600 | 120 | 153.92 | 1.561 | 175.18 | −43.746 | −3.867 | 44.870 |
| Trial no. | Normalizing sequence | Deviation sequence | Grey relational coefficient | GRG | ||||||
|---|---|---|---|---|---|---|---|---|---|---|
| Thrust force (N) | Torque (Nm) | MRR (mm3/s) | Thrust force (N) | Torque (Nm) | MRR (mm3/s) | Thrust force (N) | Torque (Nm) | MRR (mm3/s) | ||
| 1 | 0.518 | 0.451 | 0.037 | 0.482 | 0.549 | 0.963 | 0.509 | 0.477 | 0.342 | 0.443 |
| 2 | 0.771 | 0.685 | 0.436 | 0.229 | 0.315 | 0.564 | 0.686 | 0.614 | 0.470 | 0.590 |
| 3 | 0.975 | 0.944 | 0.699 | 0.025 | 0.056 | 0.301 | 0.952 | 0.899 | 0.624 | 0.825 |
| 4 | 0.441 | 0.352 | 0.161 | 0.559 | 0.648 | 0.839 | 0.472 | 0.436 | 0.373 | 0.427 |
| 5 | 0.656 | 0.659 | 0.579 | 0.344 | 0.341 | 0.421 | 0.592 | 0.594 | 0.543 | 0.576 |
| 6 | 0.745 | 0.772 | 0.776 | 0.255 | 0.228 | 0.224 | 0.662 | 0.686 | 0.691 | 0.680 |
| 7 | 0.329 | 0.209 | 0.299 | 0.671 | 0.791 | 0.701 | 0.427 | 0.387 | 0.416 | 0.410 |
| 8 | 0.442 | 0.331 | 0.668 | 0.558 | 0.669 | 0.332 | 0.473 | 0.428 | 0.601 | 0.501 |
| 9 | 0.633 | 0.585 | 0.883 | 0.367 | 0.415 | 0.117 | 0.577 | 0.546 | 0.810 | 0.644 |
| 10 | 0.395 | 0.327 | 0.000 | 0.605 | 0.673 | 1.000 | 0.453 | 0.426 | 0.333 | 0.404 |
| 11 | 0.716 | 0.725 | 0.584 | 0.284 | 0.275 | 0.416 | 0.638 | 0.645 | 0.546 | 0.610 |
| 12 | 0.884 | 0.876 | 0.794 | 0.116 | 0.124 | 0.206 | 0.811 | 0.802 | 0.708 | 0.774 |
| 13 | 0.158 | 0.044 | 0.278 | 0.842 | 0.956 | 0.722 | 0.373 | 0.343 | 0.409 | 0.375 |
| 14 | 0.453 | 0.428 | 0.704 | 0.547 | 0.572 | 0.296 | 0.477 | 0.467 | 0.628 | 0.524 |
| 15 | 0.638 | 0.687 | 0.923 | 0.362 | 0.313 | 0.077 | 0.580 | 0.615 | 0.867 | 0.687 |
| 16 | 0.000 | 0.000 | 0.349 | 1.000 | 1.000 | 0.651 | 0.333 | 0.333 | 0.435 | 0.367 |
| 17 | 0.280 | 0.188 | 0.797 | 0.720 | 0.812 | 0.203 | 0.410 | 0.381 | 0.711 | 0.501 |
| 18 | 0.395 | 0.359 | 1.000 | 0.605 | 0.641 | 0.000 | 0.453 | 0.438 | 1.000 | 0.630 |
| 19 | 0.484 | 0.429 | 0.077 | 0.516 | 0.571 | 0.923 | 0.492 | 0.467 | 0.351 | 0.437 |
| 20 | 0.743 | 0.784 | 0.515 | 0.257 | 0.216 | 0.485 | 0.660 | 0.698 | 0.507 | 0.622 |
| 21 | 1.000 | 1.000 | 0.723 | 0.000 | 0.000 | 0.277 | 1.000 | 1.000 | 0.643 | 0.881 |
| 22 | 0.344 | 0.282 | 0.284 | 0.656 | 0.718 | 0.716 | 0.432 | 0.411 | 0.411 | 0.418 |
| 23 | 0.619 | 0.597 | 0.666 | 0.381 | 0.403 | 0.334 | 0.567 | 0.554 | 0.600 | 0.574 |
| 24 | 0.736 | 0.734 | 0.921 | 0.264 | 0.266 | 0.079 | 0.655 | 0.653 | 0.863 | 0.724 |
| 25 | 0.193 | 0.121 | 0.351 | 0.807 | 0.879 | 0.649 | 0.382 | 0.363 | 0.435 | 0.393 |
| 26 | 0.386 | 0.288 | 0.736 | 0.614 | 0.712 | 0.264 | 0.449 | 0.412 | 0.654 | 0.505 |
| 27 | 0.602 | 0.568 | 0.985 | 0.398 | 0.432 | 0.015 | 0.557 | 0.536 | 0.971 | 0.688 |
The SNRs of all the responses are normalized using Equation (4) for thrust force and drilling torque and Equation (5) for MRR and the normalizing sequences for the 27 trials are entered in Table 3. The deviation sequences and calculated by subtracting normal sequence values from 1 and also entered in Table 3.
Assuming the distinguishing coefficient of 0.5, the GRCs for all the trails were evaluated by Equation (5), and the mean GRCs of all the three responses for each trial are estimated as GRG and tabulated in Table 4.
For all the three responses, the average GRGs are estimated at all the three levels and are tabulated as response table which is shown in Table 5. Finally, the mean of all these nine GRGs is marked as mean GRG in the same table.
| Factors | Level 1 | Level 2 | Level 3 | Delta | Rank |
|---|---|---|---|---|---|
| A | 0.5662 | 0.5414 | 0.5824 | 0.0162 | 3 |
| B | 0.6206 | 0.5539 | 0.5155 | 0.1051 | 2 |
| C | 0.4083 | 0.5558 | 0.7260 | 0.3177 | 1 |
| Mean Grey relational grade = 0.5633. | |||||
The ideal level of input factors for the drilling operations are found to be the maximum GRG for each factor from the response table and so the optimum parameters are level 3 for the factor A (high carbon-coated tool), level 1 for the factor B (spindle speed of 1,200 rpm), and level 3 for the factor C (feed rate of 120 mm/min). The highly influencing factors of drilling to optimize the drilling force, drilling torque, and MRR are found to be the tool feed rate followed by spindle speed and tool material as shown by the rank in the response table.
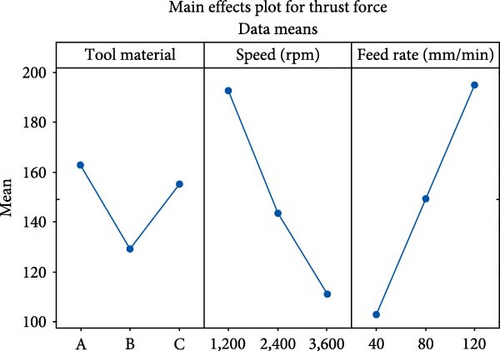
Minitab has been used to obtain the main effect plot for thrust force which is shown in Figure 3. The main effect plots represent the influence of various parameters on thrust force graphically. The effect of drilling speed and feed are high on thrust force as the range of their means are higher than that of the tool material. It is inferred from the main effect plots that the thrust force is minimum when using DLC tool with high speed and low feed.
Similarly, the main effect plot for the drilling torque is obtained and is shown in Figure 4. From the plots, we can conclude that the influence of various factors of drilling on the torque is more or less similar to that of the thrust force and so the torque will be when using DLC tool with high speed and low feed.
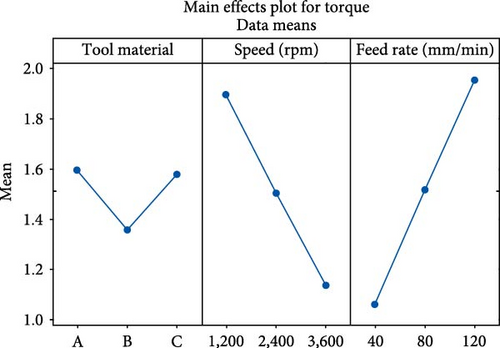
Figure 5 shows the main effect plot for MRR, and the parameters to maximize the MRR are found to be DLC tool with high speed and high feed. The plot also indicates that the range of the mean data are maximum for feed rate and we can conclude that the feed rate is the most influencing factor for MRR.
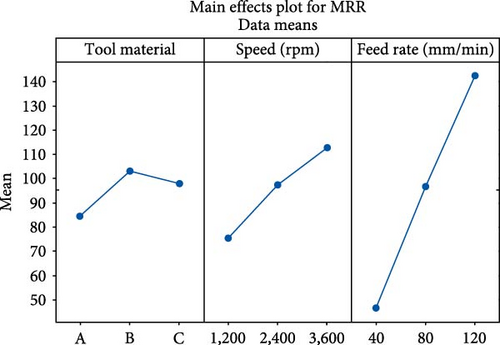
Figures 3–5 show the main effect plots for single objective function viz, to minimize thrust force, torque, and to maximize MRR, respectively, and the combined multiobjective function can be optimized by optimizing the GRGs estimated by the hybrid Taguchi–Grey analysis.
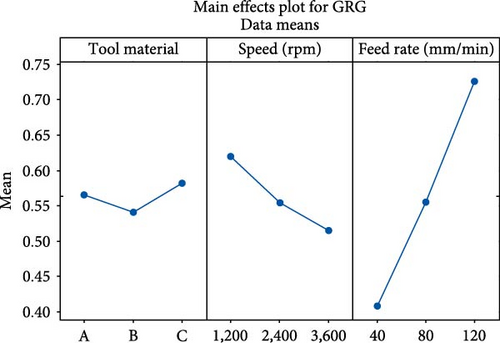
The main effect plot for the GRG is shown in Figure 6, and the drilling parameters to optimize the GRG are found to be a HC-coated tool with a lower speed and higher feed rate. The graphs also indicate that the range of the mean data are higher for feed rate than that of speed and tool material and we can conclude that the feed rate is the most influencing factor affecting the combined objective function.
The ANOVA is found and shown in Table 6. The confidence level is 95% and so the probability of various input factors less than or equal to 0.05 show their noticeable influence of them on the GRGs. The percentage contributions of the three factors on GRG also shown in the table and it can be concluded that the tool feed rate is the most influencing factor (% contribution of 84.82) for GRG followed by speed and the tool coating.
| Source | df | Adj. SS | Adj. MS | F-value | P-value | % Contribution |
|---|---|---|---|---|---|---|
| Tool material | 2 | 0.007706 | 0.003853 | 3.37 | 0.050 | 1.44 |
| Speed (rpm) | 2 | 0.050877 | 0.025439 | 22.25 | 0 | 9.49 |
| Feed rate (mm/min) | 2 | 0.45493 | 0.227465 | 198.98 | 0 | 84.82 |
| Error | 20 | 0.022863 | 0.001143 | 4.26 | ||
| Total | 26 | 0.536376 | 100.00 |
Similar kind of results were recorded for thrust force and MRR by Palanikumar and Muniaraj [8] and Kamath et al. [17], respectively.
4. Confirmation Test
To conduct the confirmation test, the predicted GRG value is to be estimated first using the formula given in Equation (6).
Here ζm denotes the mean or average GRG value and denotes the GRG value at the optimum level. r represents the response and n represents the number of parameters.
Using Equation (6), it was found that the value of predicted GRG for the drilling experiments is 0.8023.
Finally, a confirmation drilling experiment is carried out to validate the result of Taguchi–Grey analysis. For confirmation experiment, the optimum input factors have been selected, that is high carbon-coated drilling tool is used at the speed of 1,200 rpm and the feed rate of 120 mm/min, and all the response values are taken and tabulated in Table 7.
| Response | Thrust force (N) | Torque (Nm) | MRR (mm3/s) |
|---|---|---|---|
| Value | 103.01 | 3.6 | 2.94 |
The GRG for the values obtained from the confirmation test is evaluated as 0.8386, which is in excellent concurrence with the predicted value of GRG, that is, 0.8023.
5. Conclusions
Aluminum-based hybrid composite (Al7075/BN/Al2O3) specimens in the shape of square slabs were cast by stir casting and machined, in which the drilling was carried out as per Taguchi’s L27 orthogonal array using three different drill tools under three different drilling speeds, and three different feed rates. The inferences concluded from the experimental investigations are mentioned here.
- (i)
It is noticed that a minimum drilling force of 62.12 N and torque of 0.766 Nm were induced on the material while using DLC-coated drilling tool under higher drilling speed (3,600 rpm in our case) and at a lower feed rate (40 mm/min).
- (ii)
The findings of the analysis have revealed that the MRR could be maximized (178.79 mm3/s) when the drilling speed and feed rate are higher (3,600 rpm and 120 mm/min, respectively) with DLC-coated carbide drills.
- (iii)
The multiobjective function of thrust force, drilling torque, and MRR is optimized by hybrid Taguchi–Grey analysis method, and it was concluded that the high carbon-coated drilling tool with lower cutting speed and higher feed are producing optimum results.
- (iv)
Also, ANOVA was carried out and the percentage contribution of all the three input parameters to get optimum results were found. By ANOVA technique, it was concluded that feed rate is influencing more on the responses than speed and tool coatings.
- (v)
Finally, confirmation drilling test was carried out using optimum parameters, and the responses are analyzed by hybrid TaguchiGrey method to find out the GRG. It is inferred that there is a great agreement between the predicted and actual GRG values.
Conflicts of Interest
The authors declare that they have no conflicts of interest.
Funding
Authors declared that no funding was received for this research and publication. It was performed as a part of the Employment Hawassa University, Ethiopia.
Acknowledgments
The authors would like to thank the VELS Institute of Science, Technology & Advanced Studies, Chennai, India for their excellent support for the submission of their papers.
Open Research
Data Availability
The data used to support the findings of this study are included in the article. Should further data or information be required, these are available from the corresponding author upon request.


