Arbuscular Mycorrhizal Fungi Enhance Drought Stress Tolerance by Regulating Osmotic Balance, the Antioxidant System, and the Expression of Drought-Responsive Genes in Vitis vinifera L.
Abstract
Background and Aims. Drought harms the growth and productivity of grapevines; it thus poses a major threat to the development of viticulture in the background of ongoing climate change. Arbuscular mycorrhizal fungi (AMF) can be used to enhance the resistance/tolerance of plants to environmental stress. The effects of AMF on the osmotic regulation, antioxidant substances, and expression of drought-responsive genes in the grapevine Vitis vinifera L. cv. Ecolly were studied. Methods and Results. The experiment was conducted in a greenhouse in a completely randomized block design with four treatments: AMF colonization, well-watered; non-AMF colonization, well-watered; AMF colonization with drought stress; and non-AMF colonization with drought stress. The concentration of sucrose and proline in the leaves was higher in mycorrhizal grapevine than in nonmycorrhizal grapevine under drought stress. The concentration of malonaldehyde, hydrogen peroxide, superoxide anion, and glutathione and the activity of superoxide dismutase and peroxidase activity in leaves were higher in mycorrhizal grapevine than in nonmycorrhizal grapevine under drought conditions. AMF inoculation affected the expression of drought-responsive genes. Mycorrhization upregulated the expression of VvNCED, VvP5CS, VvSIP, VvPIP1;2, and VvTIP2;1 genes under drought stress. Conclusions. AMF could reduce the harm caused by drought stress by regulating osmosis, antioxidant activities, and the expression of key drought-responsive genes and aquaporin genes. Significance of the Study. This work provides insights into the physiological and biochemical activities influenced by AMF on grapevine under drought stress.
1. Introduction
Drought stress has an adverse effect on the survival and productivity of plants [1]. Stress caused by drought triggers greater annual losses in crop yield than all pathogens combined [1]. Grapevine (Vitis vinifera L.) is not the most drought-sensitive fruit plant, and moderate water stress during maturation enhances grape quality [2, 3]. However, long-term water deficits can negatively affect the regular physiological processes and yield of grapevines [3]. Most wine grapes are cultivated in arid or semiarid areas in northwestern China [4]. Grapevines in this region often experience drought stress during the growing season. Drought is expected to increase in frequency with global climate change [5].
Drought negatively affects various physiological and biochemical processes of plants [6]; for example, drought reduces photosynthetic efficiency, induces osmotic stress and the accumulation of reactive oxygen species (ROS), and leads to oxidative stress and membrane damage [7, 8]. Drought has negative effects on regular physiological activities, and this results in the inhibition of plant growth and reductions in yield [9].
Arbuscular mycorrhizal fungi (AMF) are members of the phylum Glomeromycota, which are beneficial soil microorganisms [10]. They can form mutualistic symbioses with approximately 80% of terrestrial plant roots [11]. Several studies have shown that AMF can enhance the resistance of plants to both biotic and abiotic stresses [8]. AMF are an ecofriendly and sustainable biological solution for alleviating the effects of environmental stress on plants. The effects of AMF on the resistance of plants to environmental stress have received increased research interest in recent years.
AMF have been shown to enhance the drought resistance of many fruits and crops, such as apple [12], citrus [13, 14], blueberry [15], maize [8], rice [16], wheat [17], soybean [18], common bean [19], Knautia arvensis [20], and tomato [21]. Additionally, a few studies have reported that AMF symbiosis increases the tolerance of grapevine to water stress and water-use efficiency [3, 22]. The mechanism underlying the effect of AMF on the drought tolerance of grapevine remains unclear.
Studies on plants other than grapevines have revealed the mechanism by which AMF mediate resistance to drought stress in plants at the physiological, biochemical, and molecular levels [23]. For example, AMF inoculation increases plant biomass, the concentration of osmolytes, and antioxidant enzyme activity in Zenia insignis [24]; the accumulation of protective substances (soluble protein, proline, and flavonoids) is higher in mycorrhizal white clove, and this improves the drought tolerance of plants [25]. AMF enhance the drought tolerance of citrus by upregulating the expression of genes involved in the response to osmotic stress and the enzymatic and nonenzymatic antioxidant defense systems [13, 14]. Drought stress induces plant water deficit and decreases the water potential in plants, which leads to a reduction in cell turgor. In response to drought, organic solute compounds, such as sugars, proline, and soluble proteins, accumulate in plants, which maintain the turgor and physiological activity [26]. AMF can increase the concentrations of organic osmolytes to reduce osmotic potential when plants experience water deficits [27]. Drought stress also disturbs the metabolism of ROS, which leads to their accumulation, such as superoxide anion (O2−), hydroxyl radical (−OH), and hydrogen peroxide (H2O2) [28]. Antioxidant enzymes facilitate the scavenging of ROS and ameliorate oxidative stress induced by ROS accumulation in cells [7, 29, 30]. AMF can increase the activity of antioxidant enzymes to rapidly scavenge ROS and maintain ROS at low levels when plants experience water stress [23].
Our knowledge of the response of mycorrhizal plants to drought stress remains poor. First, the effects of AMF on the drought resistance of plants are complex and involve changes in the expression of various genes and signaling pathways. Furthermore, many factors including AMF species, host plants, soil type, trial conditions, and stress severity all affect the resistance of plants to drought stress. Previous studies have focused on characterizing the expression of aquaporin genes. The authors in [31, 32] studied the expression of root TIP aquaporin genes in potted trifoliate orange seedlings. The expression of root PtTIP1;2, PtTIP1;3, and PtTIP4;1 was increased by AMF under drought stress, and the expression of root PtTIP2;1 and PtTIP5;1 was downregulated. Quiroga et al. [33] characterized the expression of genes encoding root PIPs and TIPs in drought-sensitive and drought-tolerant maize cultivars. They showed that the expression of ZmPIP1;1, ZmPIP2;2, and ZmTIP1;1 was downregulated by AMF under drought stress in the drought-sensitive cultivar; however, no significant changes in the expression of ZmPIP1;3, ZmPIP1;6, ZmPIP2;4, ZmTIP2;3, and ZmTIP4;1 were observed. In the drought-tolerant cultivar, only the expression of ZmTIP4;1 was regulated by AMF under drought stress, and no significant changes were observed in the expression of other aquaporin genes. Liu et al. [34] characterized the expression of aquaporin PIP genes of Populus × canadensis “Neva” and found that the expression of PIP1 genes and PIP2;2 was upregulated by AMF under drought stress, and the expression of PIP2;1 and PIP2;3 was downregulated. Porcel et al. [35] characterized the expression of aquaporin PIP genes in Glycine max and Lactuca sativa and found that the expression of PIP2 genes was downregulated by AMF. The expression patterns of aquaporins were complex, diverse, and unpredictable during the response of mycorrhizal plants to drought stress.
The aim of this study was to understand the response of mycorrhizal grapevines to drought stress by characterizing changes in osmotic regulation, antioxidant regulation, and gene expression.
2. Materials and Methods
2.1. Experimental Materials and Design
The top layer (0–20 cm) of soil was collected from land in Yangling, Shaanxi Province, China. The Lou soil in this study is classified as a Eum-Orthic Anthrosol according to FAO soil taxonomy. The pH of the soil was 7.6, and the content of available nitrogen, phosphorus, and potassium was 3.6 mg/kg, 4.2 mg/kg, and 132.3 mg/kg, respectively [36, 37]. The soil was autoclaved at 121°C for 2 h before potting.
Vitis vinifera L. cv. Ecolly selected by Northwest A&F University with high resistance to disease was used in the experiments [38]. Vitis vinifera L. cv. Ecolly, a wine grape cultivar, is a crossbreed of Chardonnay, Riesling, and Chenin blanc [39]. Two-year own-rooted grapevines were planted with 5 kg of soil in each pot. The grapevines were cultivated in a greenhouse under controlled conditions of 20–25°C temperature and 12–14 h of light from Jan. 2021 to Sep. 2021. The grapevines were potted at the end of January and inoculated with AMF in March.
The AMF inoculum was a commercial product (MycoApply®, Compostwerks Co., USA) containing Funneliformis mosseae, G. aggregatum, and Claroideoglomus etunicatum. The AMF inoculum was observed in a previous experiment [40] to result in the high performance of vines. AMF were inoculated per the specifications of the product on 25 March 2021. Each plant was inoculated with 5 g of inoculum by adding to a hole dug. The hole was then covered, and the pots were watered. The colonized grapevines were provided regular water management for five months. The water stress treatment was initiated after five months and applied from 30 August 2021 to 9 September 2021.
The experiment was conducted in a completely randomized block design with four treatments with 15 replicates (pots) per treatment: AMF colonization, well-watered (AW); non-AMF colonization, well-watered (NW); AMF colonization with drought stress (AD); and non-AMF colonization with drought stress (ND). Plants in well-watered treatments were watered regularly and plants in the water stress treatments were not watered. Well-watered potted soil was maintained at around 70% of the maximum field water-holding capacity by weighing the pots. Sampling was initiated on six of the 15 replicate plants per treatment on 9 September 2021, 10 days after watering was stopped. The six pots were chosen randomly from 15 replicate plants. Potted soil was at approximately 40% of the maximum field water-holding capacity at 7 days after watering.
2.2. Microscopic Observation of AMF Colonization
Roots from each treatment replicate were cut into fragments and incubated for 20 min at 90°C in 10% KOH. They were then bleached for 30 min with alkaline H2O2 solution, acidified in 1% HCL at 90°C for 10 min, and stained for 25 min at 90°C in 0.05% trypan blue in acidic glycerol solution [41]. The samples were stored in an acidic glycerol solution for 72 h. The roots were then mounted on microscope slides with an acidic glycerol solution. The photos were taken using a microscope with a CCD camera (Leica, German). AMF colonization data were reported in a previous paper [37]. The grapevine plants that were not treated with inoculum were not colonized by AMF. Rates of AMF colonization and arbuscules colonization on plants in the inoculated treatments were 89.2% and 76.8%, respectively [37]. New additional photos are presented in Figure S1 (Supplementary Figure 1).
2.3. Determination of the Concentration of Osmolytes
For sucrose concentration assessment, fresh laminae tissue (0.5 g) from each treatment replicate was ground with distilled water and then extracted in 80% ethanol, and the homogenate was centrifuged at 5,000 g for 10 min. The sucrose concentration in leaves was measured following the method of Cao and Jiang [42].
For soluble protein concentration assessment, fresh laminae tissue (0.8 g) from each treatment replicate was ground with potassium phosphate buffer (pH 7.0); it was then centrifuged at 5,000 g for 10 min. The soluble protein concentration in leaves was measured using the dying method with Coomassie brilliant blue [43].
For proline concentration assessment, fresh laminae tissue (0.5 g) from each treatment replicate was macerated in 3% sulfosalicylic acid using a pestle and mortar. It was then centrifuged at 3,000 g for 10 min. The proline concentration in leaves was measured using the colorimetric method with acid ninhydrin [44].
2.4. Oxidative Stress Indicators
For malondialdehyde (MDA) concentration assessment, fresh laminae samples (1.0 g) from each treatment replicate were homogenized with 5 mL of 0.1% (w/v) trichloroacetic acid and centrifuged at 3,000 g for 10 min. The mixture, including 2 mL of supernatant and 2 mL of 0.67% thiobarbituric acid, was incubated at 100°C for 30 min and then centrifuged at 3,000 g for 10 min. The MDA concentration was measured using the thiobarbituric acid-reactive substances assay of Hodges et al. [45]. MDA absorption was measured spectrophotometrically at 450, 532, and 600 nm.
For hydrogen peroxide (H2O2) concentration assessment, fresh laminae samples (1.0 g) from each treatment replicate were homogenized in 5 mL of 0.1% (w/v) trichloroacetic acid and centrifuged at 12,000 g for 15 min. The H2O2 concentration in plant extracts was measured using titanium (IV) following the method of Patterson et al. [46].
For superoxide anion radical O2− concentration assessment, fresh laminae samples (1.0 g) from each treatment replicate were homogenized with 5 mL of 0.1 mol/L phosphate buffer (pH 7.8) and centrifuged at 4,000 g for 10 min at 4°C. The O2− concentration was measured using the hydroxylamine method following the method of Bai et al. [47].
2.5. Determination of the Ascorbic Acid (AsA) and Glutathione (GSH) Concentration
Fresh laminae tissues (1.0 g) from each treatment replicate were homogenized at 4°C with 5% (w/v) trichloroacetic acid and then centrifuged for 15 min at 20,000 g. The AsA concentration was measured using the method of Costa et al. [48]. The GSH concentration was measured using the method of Baker et al. [49].
2.6. Antioxidant Enzyme Activity Assay
Samples of laminae (1.0 g) from each treatment replicate were ground in a chilled mortar with 1% (w/v) PVP, homogenized with 15 mL of 50 mM potassium phosphate buffer (pH 7.8), and then centrifuged at 10,000 rpm for 15 min. The resulting supernatant was used to determine the activities of superoxide dismutase (SOD; EC 1.15.1.1), catalase (CAT; EC 1.11.1.6), and peroxidase (POD; EC 1.11.1.7).
SOD activity for each plant replicate was measured using nitroblue tetrazolium (NBT) [50]; CAT activity was measured by estimating the decomposition rate of hydrogen peroxide [51]; POD activity was measured using guaiacol following the method of Maehly [52]. The activities of these enzymes were expressed as U/(g∗ h) FW.
Ascorbate peroxidase (APX; EC 1.11.1.1) and glutathione reductase (GR; EC 1.6.4.2) enzymes were extracted following the method of Shan and Liang [53]. Frozen laminae tissue from each replicate plant (1.0 g) was ground into a fine powder in liquid nitrogen with a mortar and pestle. The fine powder was homogenized in 6 ml of 50 mM KH2PO4 (pH 7.5) containing 0.1 mM EDTA, 0.3% (v/v) Triton X-100, and 1% (w/v) insoluble PVP. The extract was immediately centrifuged at 13,000 g for 15 min at 4°C. The supernatant was then used to measure enzyme activity.
The ascorbate peroxidase (APX; EC 1.11.1.1) activity was measured by analyzing ascorbate oxidation followed by a decrease in the absorbance at 290 nm [54]. GR activity was measured using the method of Grace and Logan [55].
2.6.1. RNA Extraction and Analysis of the Expression of Key Genes via Real-Time qPCR
Samples of grape laminae from each replicate plant that were previously ground in liquid nitrogen were used for total RNA extraction. Three independent biological replicates were used per extraction. Total RNA was extracted from each sample using the Plant RNA Kit (Vazyme, China) following the manufacturer’s instructions. RNA concentration was measured spectrophotometrically using NanoDrop ND-1000 (ThermoFisher, USA). RNA purity was estimated by calculating the A260/A280 ratio. RNA integrity was qualified by agarose electrophoresis. cDNA was synthesized using the first-strand cDNA Fast Synthesis Kit (Vazyme, China) with 1 μg RNA following the manufacturer’s protocol. cDNA was diluted 5 times after cDNA synthesis, and then, 2 μl of it was added to the master mix. Real-time PCR was performed using ChamQ Universal SYBR qPCR Master Mix (Vazyme, China). The qPCR reactions were conducted on a qTOWER3G (Analytik Jena, Germany). A three-step experimental run protocol was used: (1) denaturation program (3 min at 95°C); (2) amplification and quantification program repeated 40 times (denaturing at 95°C for 10 s; annealing and elongating at 60°C for 30 s); and (3) melting curve program (15 s at 95°C; 60 s at 60°C; 15s at 95°C). The actin gene was used as the internal control (Reid et al. 2006). Gene-specific primer pairs used are listed in Supplementary Table S1. Genes selected for further analysis included NCED (9-cis-epoxycarotenoid dioxygenase), P5CS (δ1-pyrrolin-5-carboxylate synthetase), CYP (abscisic acid 8′-hydroxylase 4), BG (beta-glucosidase), and aquaporin genes: SIP, PIP1;2, PIP2;2, TIP1;1, TIP 2;1, and TIP 4;1.
Melting curve analysis was performed to confirm the amplification of specific genes. The expression values were normalized according to the average expression levels of the reference gene and calculated using the 2−△△Ct method [56]. Three biological replicates were performed.
2.7. Data Analysis
For each of the six biological replicates per treatment, the average value was obtained based on three measurements. Statistical analyses were performed in R statistical computing environment (R Development Core team 2010). A two-way analysis of variance was conducted, and differences between means were evaluated using a Tukey’s test at the 5% level. Graphs were made using GraphPad Prism 9 software.
3. Results
3.1. Osmolytes Concentration
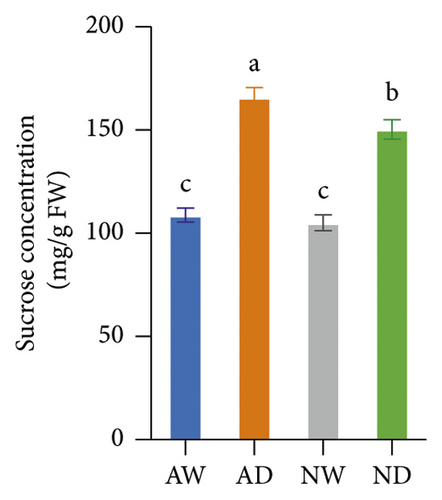
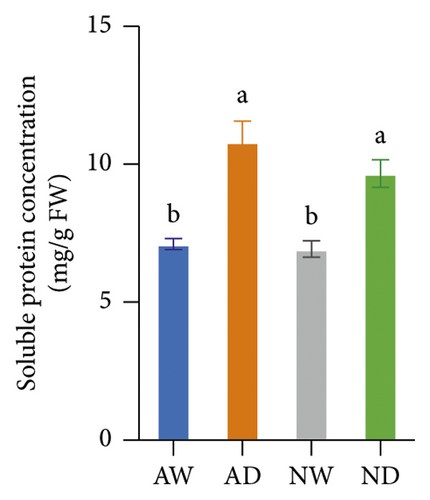
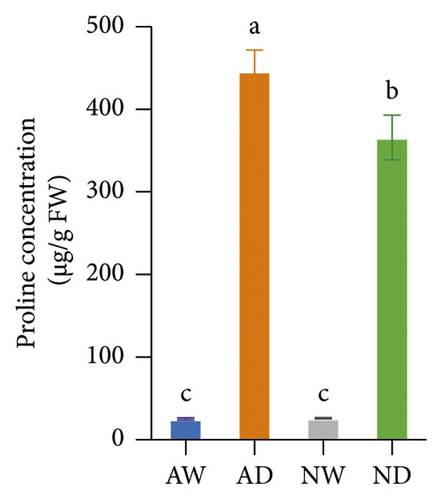
Drought stress significantly increased the concentration of sucrose, soluble protein, and proline in both mycorrhizal and nonmycorrhizal plants. The concentration of sucrose, soluble protein, and proline was not affected by the inoculation treatments when plants were well watered. The concentration of sucrose and proline was significantly higher in AD than in ND after 10 days of water stress treatments; there was no significant difference in the soluble protein concentration between AD and ND (Figure 1).
3.2. Oxidative Stress Indicators
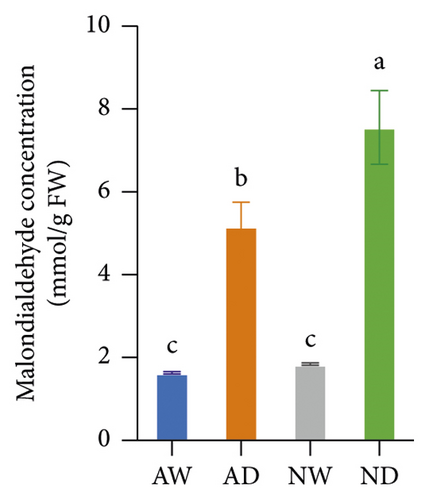
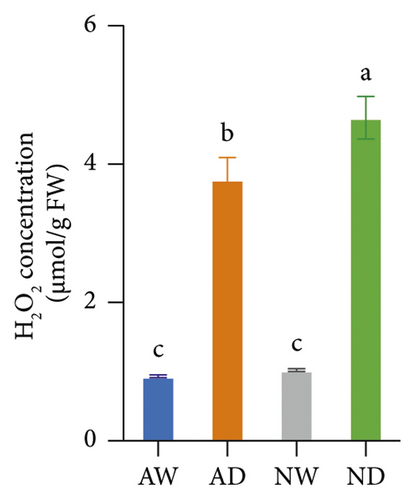
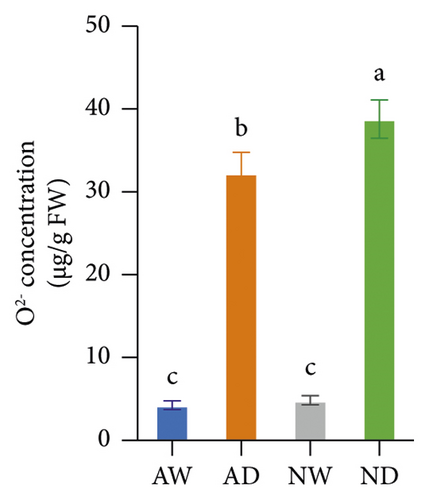
The concentration of MDA, H2O2, and O2− was significantly higher in drought-exposed plants than in well-watered plants (Figure 2). There were no significant differences in the MDA, H2O2, and O2− concentration between mycorrhizal and nonmycorrhizal plants under well-watered conditions. The concentration of MDA, H2O2, and O2− was lower in AMF-inoculated plants than in uninoculated plants under water stress. AMF inoculation reduced the accumulation of H2O2 and O2− under drought stress, which reduced lipid peroxidation.
3.3. AsA and GSH Concentration
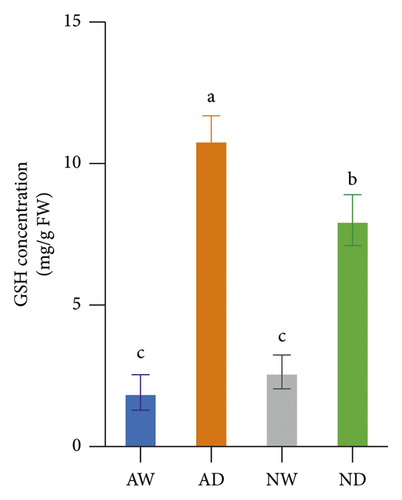
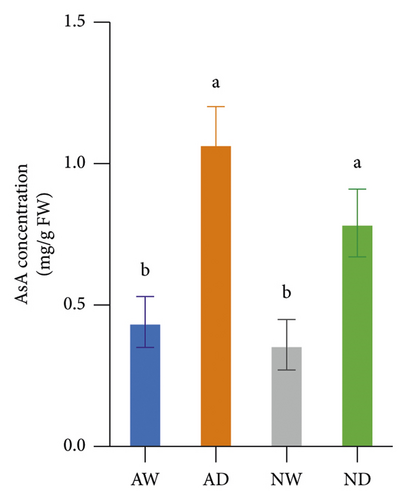
The GSH concentration in leaves was higher in mycorrhizal plants (p < 0.05) than in nonmycorrhizal plants under water stress, and no significant difference in the GSH concentration was observed between mycorrhizal plants and nonmycorrhizal plants under well-watered conditions (Figure 3). The AsA concentration in leaves did not differ significantly between mycorrhizal plants and nonmycorrhizal plants, regardless of the amount of water applied. The GSH and AsA concentration in leaves was significantly higher in plants exposed to water stress than in well-watered plants.
3.4. Antioxidant Enzyme Activity
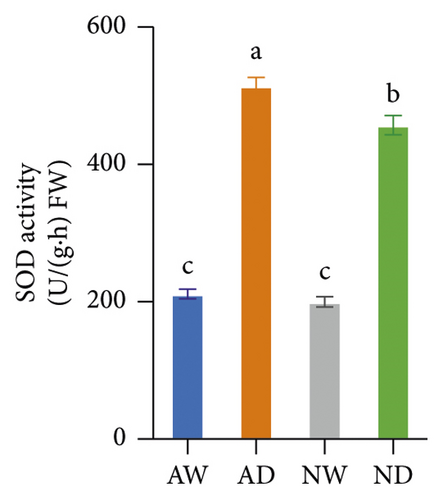
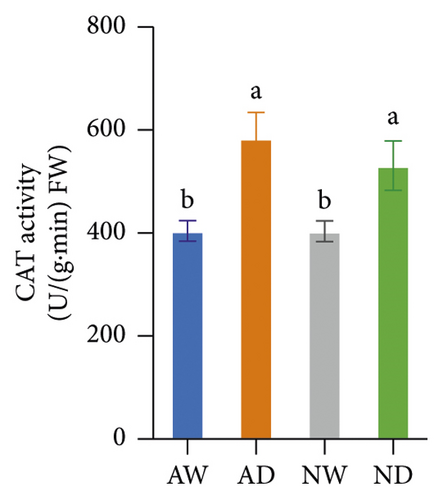
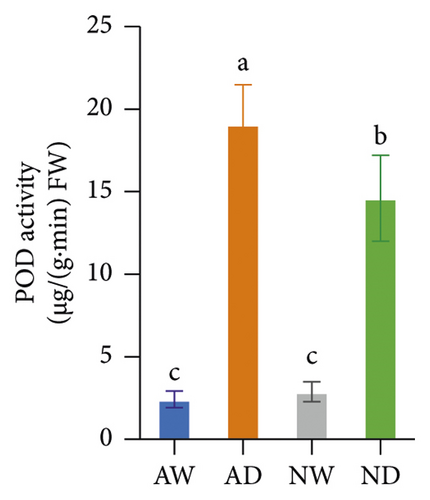
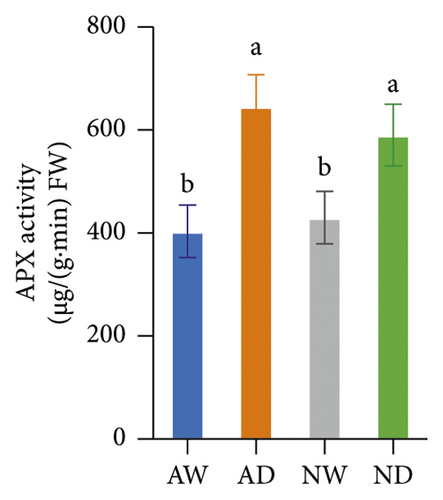
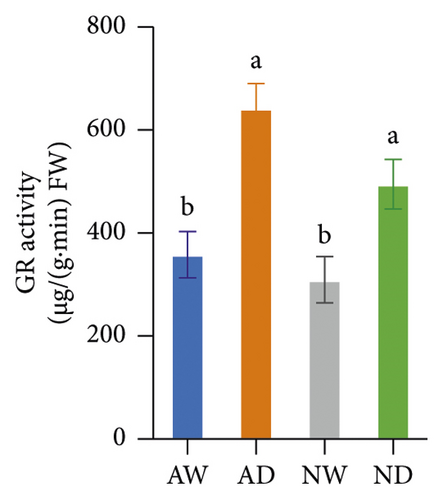
The activity of SOD, POD, CAT, APX, and GR in mycorrhizal plants and nonmycorrhizal plants did not differ significantly under well-watered conditions (Figure 4). The activities of all assayed antioxidant enzymes increased following exposure to drought stress. The activities of SOD and POD enzymes were significantly higher in AMF-inoculated plants than in noninoculated plants under drought stress conditions. The activity of CAT, APX, and GR did not significantly differ between mycorrhizal plants and nonmycorrhizal plants under water stress.
3.5. Relative Expression Levels of Drought-Responsive Genes
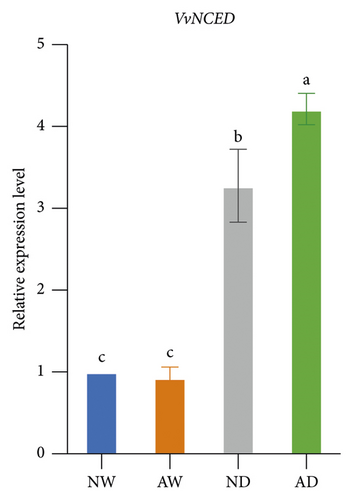
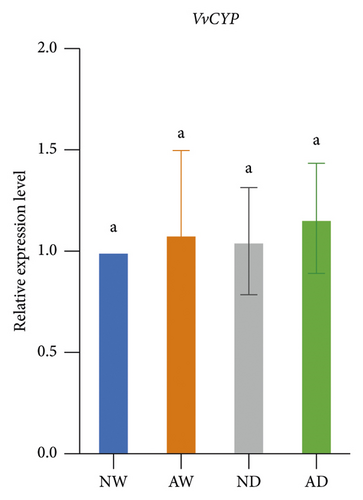
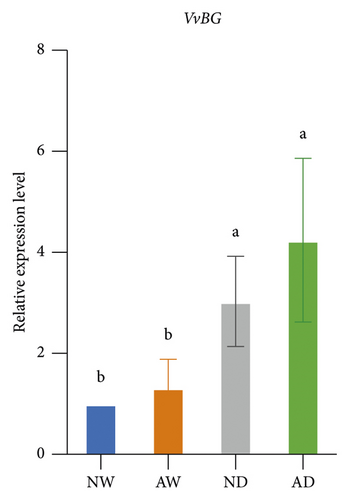
The expression of drought stress-related genes, including VvNCED, VvP5CS, VvCYP, and VvBG, was analyzed (Figure 5). The expression of VvNCED and VvP5CS was both upregulated. The expression of VvNCED and VvP5CS was significantly upregulated by drought stress regardless of whether plants were inoculated with AMF. The expression of VvNCED and VvP5CS was not affected by AMF inoculation under well-watered conditions, and the expression of VvNCED and VvP5CS was upregulated by AMF inoculation under drought stress relative to the uninoculated treatment. The relative expression of CYP genes was not significantly altered by AMF inoculation or water stress. Drought stress increased the expression of VvBG in plants. The expression of VvBG did not significantly differ between mycorrhizal plants and nonmycorrhizal plants under well-watered conditions. A similar expression was observed under water stress conditions, and the transcript expression of VvBG was not significantly affected by AMF inoculation.

3.6. Relative Expression Levels of Aquaporin Genes
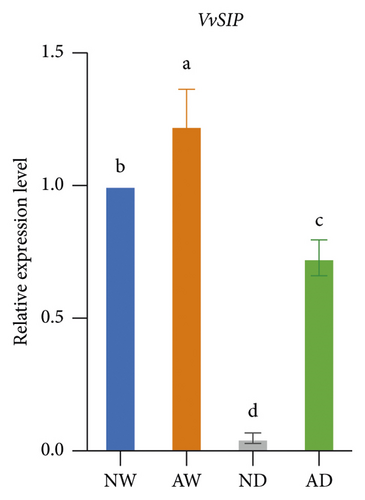
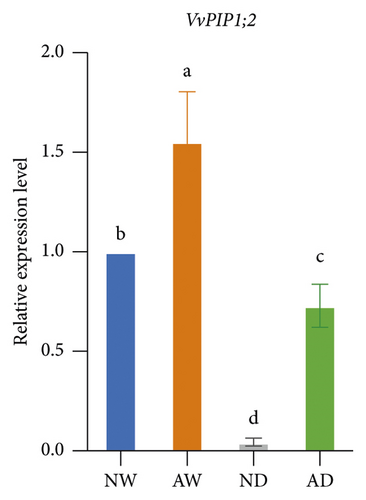
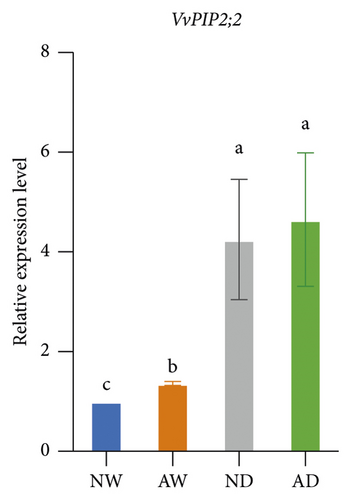
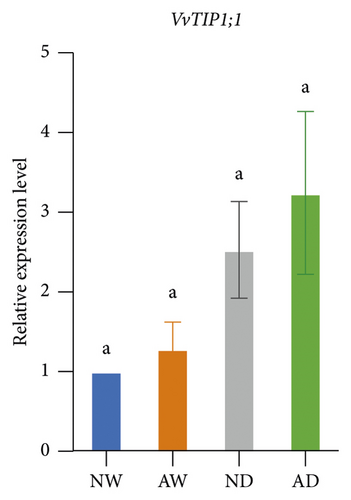
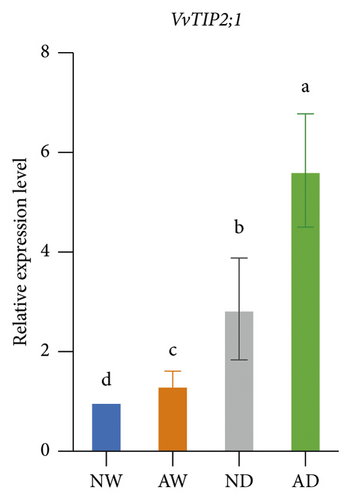
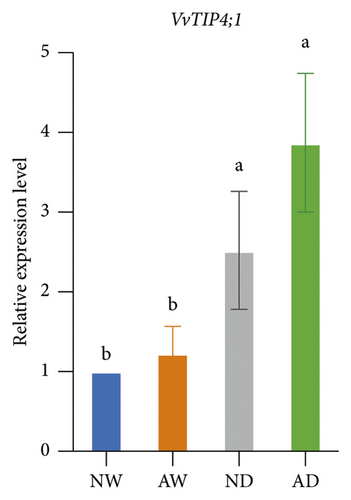
The expression of aquaporins, including VvSIP, VvPIP1;2, VvPIP2;2, VvTIP1;1, VvTIP2;1, and VvTIP4;1, in the different treatments was analyzed (Figure 6). The expression of these aquaporin genes varied. The expression of VvSIP and VvPIP1;2 was upregulated in leaves of mycorrhizal plants relative to nonmycorrhizal plants under both water levels. The expression of VvSIP and VvPIP1;2 was downregulated when plants were subjected to water deficits regardless of whether they were inoculated with AMF. Under well-watered conditions, AMF inoculation increased the expression of VvPIP2;2. Drought increased the relative expression of VvPIP2;2 both in leaves of mycorrhizal and nonmycorrhizal plants. No significant differences in the expression of VvTIP1;1 were observed among treatments. The expression of VvTIP2;1 was upregulated in leaves of mycorrhizal plants under both water conditions. Drought increased the expression of VvTIP2;1 in leaves of mycorrhizal and nonmycorrhizal plants. VvTIP4;1 expression did not vary significantly among the AMF inoculation treatments. The expression of VvTIP4;1 was significantly higher in the water stress treatments than in the control.
4. Discussion
4.1. Osmotic Organic Solutes
Plants accumulate several types of organic substances, e.g., sugars and proline, to regulate plasma osmotic potential and protect enzymes and plasma membranes [7]. The findings of our study showed that mycorrhization can result in the production of more compatible organic solutes, including sucrose and proline, under drought stress. The soluble protein also tended to be higher in mycorrhizal plants than in nonmycorrhizal plants under drought stress. This is consistent with the results of a previous study showing that osmolytes, including sugars, proteins, and proline, are accumulated to a greater degree in bioenergy grass (Saccharum arundinaceum retz.) inoculated with AMF than in uninoculated bioenergy grass under drought stress [57].
Proline is a well-known organic compound that mediates osmotic adjustments induced by drought stress. The accumulation of proline in the leaves reduces osmotic potential and maintains turgor pressure, which allows plants to maintain photosynthetic activity under drought conditions [58]. The higher proline concentration in AMF-inoculated plants compared with uninoculated plants under drought suggests that AMF-inoculation improves the osmotic adjustment capacity of grapevines [58]. Ouledali et al. [59] found that osmotic adjustments mediated by proline are initiated earlier in AMF-inoculated plants compared with uninoculated plants. This is consistent with the findings in several other species such as Antirrhinum majus [60], Erythrina variegata [61], Cyclobalanopsis glauca [62], Ocimum gratissimum [63], Saccharum arundinaceum retz. [57], and sweet potato [64]. In contrast, several previous studies have found that the proline concentration is lower in mycorrhizal plants than in nonmycorrhizal plants, such as in Lactuca sativa [65], rice [66], Poncirus trifoliata [67], and Pistacia vera [68]. These contradictory findings might result from differences in plant species, the intensity and duration of drought, and the environment.
4.2. Antioxidant Activity
Marked increases in the concentration of H2O2, MDA, and O2− in drought-stressed plants are indicators of oxidative stress caused by water deficits. Decreases in the concentration of H2O2, MDA, and O2− were observed in mycorrhizal plants, and these decreases indicate reduced oxidative damage. The variation among treatments in the H2O2 and MDA concentration is similar to that observed in previous studies of Pelargonium graveolens [69] and trifoliate orange (Huang et al. 2017). O2− is the main byproduct of cellular aerobic metabolism, and it can damage DNA when it binds to hydroxyl groups. The variation among treatments in the O2− concentration is consistent with that in trifoliate orange [70]. The O2− concentration was lower in mycorrhizal plants than in nonmycorrhizal plants under drought stress, and these results were consistent with the findings of a previous study of Iris wilsonii [71] showing that the O2− concentration was lower in mycorrhizal plants than in nonmycorrhizal plants under chromium stress.
The scavenging of O2− and H2O2 was achieved by several antioxidant enzymes acting in synchrony. For example, SOD converts O2− into H2O2, and CAT, POD, and APX mediate the conversion of H2O2 into H2O [27]. SOD and POD activities were higher in mycorrhizal grapevine than in nonmycorrhizal grapevine under drought stress, and this suggests that AMF inoculation can enhance the activity of antioxidative enzymes and protect plants from oxidative stress. The H2O2, MDA, and O2− concentration was lower, and SOD and POD activities were higher in mycorrhizal grapevine than in nonmycorrhizal grapevine under drought stress, suggesting that AMF inoculation enhanced the ROS-scavenging ability and reduced ROS damage caused by stress, which enhanced the tolerance of grapevine to drought.
4.3. Expression of Drought-Responsive Genes
Proline has several functions in cells, including acting as an osmoprotectant, regulating redox potentials, scavenging hydroxyl radicals, and protecting macromolecules against denaturation [72]. Drought stress usually induces increases in proline in plant tissues, which mainly stems from de novo synthesis [73]. The P5CS gene encodes δ1-pyrrolin-5-carboxylate synthetase, which is the key rate-limiting enzyme involved in the de novo biosynthesis of proline [74]. The upregulation of the expression of VvP5CS was consistent with the higher proline concentration in mycorrhizal plants than in nonmycorrhizal plants under drought conditions. Aside from VvP5CS, the drought-responsive genes VvNCED, VvCYP, and VvBG have received much research attention, and all of these genes are involved in ABA metabolism. The NCED gene encodes 9-cis-epoxycarotenoid dioxygenase, which catalyzes the rate-limiting step in the biosynthesis of the stress hormone ABA [75]. CYP encodes abscisic acid 8′-hydroxylase and is the key enzyme involved in ABA catabolism [76]. BG encodes beta-glucosidase, which increases active abscisic acid by hydrolyzing glucose-conjugated biologically inactive ABA [77]. Generally, drought triggers the biosynthesis of ABA in plants. ABA then induces the responses of several genes and pathways to mediate resistance to drought stress. The expression of VvNCED and VvP5CS was higher in mycorrhizal grapevine than in nonmycorrhizal grapevine, suggesting that AMF inoculation regulated the expression of drought-responsive genes under drought stress.
Aquaporins are well-known water channels. They are involved in the transport of various substances, including small neutral solutes (glycerol, urea, nitrogen, hydrogen peroxide, and ammonia), gasses (carbon dioxide and oxygen), and metal ions [78, 79]. Furthermore, aquaporins can interact with other proteins involved in other activities [80]. For example, the interaction between AtPIP1;4 and Harpin 1 promotes the transport of carbon dioxide and photosynthesis [81]. The multifunctional and complex roles of aquaporins may contribute to the complexity and diversity of gene expression patterns among aquaporins.
AMF inoculation affected the expression of aquaporin genes under both well-watered and water-stressed conditions. Under nonstressed conditions, AMF regulated the expression of TIPs in roots of parsley [82] and roots of Medicago truncatula [83], PIPs in roots of poplar [84], and NIPs and XIPs in roots of lotus [85]. Under water-stressed conditions, AMF regulated the expression of PIPs and TIPs in roots of maize [86], PIPs in leaves of maize [87], PIPs in roots of Glycine max and Lactuca sativa [35], and PIPs and TIPs in roots, stem, and leaves of Robinia pseudoacacia L. [88]. Symbiotic relationships were assumed to alter the allocation of water and nutrients between plants and AMF and thus regulate the expression of plant aquaporins.
Aquaporins play key roles in both preventing water loss from tissues and maintaining CO2 homeostasis when plants are exposed to drought stress [78]. Some aquaporins have lower permeability to water and thus mediate the transport of solutes [89]. Groszmann et al. [80] assumed that the expression of most of the genes encoding PIPs was downregulated; however, the expression of certain PIP isoforms was upregulated during drought, and this could compensate for the decline in CO2 in the intercellular space due to stomatal closure induced by drought. This might explain why opposite patterns of relative expression of some aquaporins were observed. Additionally, the highly diverse expression patterns of aquaporins might be related to variations in the intensity of drought stress, aquaporin isoforms, plant tissues and species, and other stimuli similar to drought [78, 79]. Opposite expression patterns of aquaporin isoform genes during drought exposure have been observed in roots of chickpea (Cicer arietinum) variety ILC588 [90]. Quiroga et al. [86] studied the expression of root PIPs and the TIP1;1 aquaporin gene in potted maize seedlings and found that the expression of root PIP1, PIP2;4, PIP2;5, and TIP1;1 was reduced by AMF under drought stress, whereas no significant changes were observed in the expression of PIP2, PIP2;1/2;2, and PIP2;6 under drought stress. The research on maize found that expression patterns of PIP aquaporins are dependent on the position of the leaf on the plant [87]. The upper third (L3) and ear (L5) leaf showed different expression patterns of PIP aquaporins. Aquaporins expression in upper L3 leaves appeared insensitive to drought, irrespective of symbiotic state whereas the expression in the L5 leaf of nonmycorrhizal plants showed strong downregulation of all PIPs (PIP1; 1, PIP1; 2, PIP1; 5, PIP2; 1, PIP2; 4, and PIP2; 5). The expression of aquaporins differed depending on the drought stress conditions; for example, the expression patterns of aquaporins differ when the length of exposure to drought is long and short [91].
Future studies of the expression of each individual aquaporin gene under different conditions could provide more insights into the regulation of aquaporins.
5. Conclusions
We analyzed the effect of AMF symbiosis on osmotic adjustment, antioxidant activities, and gene expression under drought stress. AMF inoculation increased the sucrose and proline concentration in the leaves of grapevines under drought stress. The concentration of MDA, H2O2, and O2− was lower, and the concentration of GSH and the activity of SOD and POD were higher in mycorrhizal grapevine than in nonmycorrhizal grapevine under drought conditions. AMF inoculation upregulated the expression of VvNCED, VvP5CS, VvSIP, VvPIP1;2, and VvTIP2;1 under drought stress. These findings indicated that inoculation with AMF can enhance the drought tolerance of grapevine by increasing osmolyte accumulation and antioxidant activities and regulating the expression of key drought-responsive genes and aquaporin genes.
Abbreviations
-
- AMF:
-
- Arbuscular mycorrhizal fungi
-
- ROS:
-
- Reactive oxygen species
-
- O2−:
-
- Superoxide anion
-
- −OH:
-
- Hydroxyl radical
-
- H2O2:
-
- Hydrogen peroxide
-
- MDA:
-
- Malondialdehyde
-
- AsA:
-
- Ascorbic acid
-
- GSH:
-
- Glutathione
-
- SOD:
-
- Superoxide dismutase
-
- CAT:
-
- Catalase
-
- POD:
-
- Peroxidase
-
- APX:
-
- Ascorbate peroxidase
-
- GR:
-
- Glutathione reductase
-
- NCED:
-
- 9-cis-Epoxycarotenoid dioxygenase
-
- P5CS:
-
- Δ1-Pyrrolin-5-carboxylate synthetase
-
- CYP:
-
- Abscisic acid 8′-hydroxylase 4
-
- BG:
-
- Beta-glucosidase.
Conflicts of Interest
The authors declare that there are no conflicts of interest.
Authors’ Contributions
Q.Y. designed and performed the experiments, analyzed the data, and wrote the draft. H.W. and H.L. acquired the funding and revised the manuscript.
Acknowledgments
The research was funded by the Program of Research and Application of Key Technologies for the Sustainable Development of the Wine Industry (grant number: LYNJ202110).
Open Research
Data Availability
All data included in this study are available upon request by contact with the corresponding author.


