Practicality of STAT3 Gene Polymorphisms and Sorafenib Trough Concentration as Biomarkers for Sorafenib-Induced Hand-Foot Skin Reaction in Hepatocellular Carcinoma
Abstract
Introduction. The aim of this study was to evaluate the practicality of the signal transducer and activator of transcription (STAT) 3 polymorphisms as a predictive biomarker and sorafenib trough concentration as a monitoring biomarker for hand-foot skin reaction (HFSR) in patients with hepatocellular carcinoma (HCC). Methods. In total, 43 Japanese HCC patients were included. Sorafenib concentrations were measured, if possible, on days 8, 29, 35, and 57. The sorafenib concentration on day 8 (Cday8) was used for the analysis of HFSR occurring up to day 29. The median concentration for each patient (Cmedian) was used for HFSR occurring up to day 57 (study period). The STAT3 single nucleotide polymorphism (SNP) rs4796793 was determined using cell-free DNA extracted from plasma. Result. The Cday8 tended to be higher in the HFSR onset or grade ≥ 2 HFSR severity group than in the non-HFSR or grade ≤ 1 HFSR severity group. The Cmedian was significantly higher in the HFSR onset or grade ≥ 2 group than in the non-HFSR or grade ≤ 1 HFSR group. The Cmedian thresholds for predicting HFSR onset and severity were 3.62 μg/mL and 6.10 μg/mL, respectively. There was no association between STAT3 rs4796793 and HFSR onset or severity. In multivariate analysis, Cmedian values ≥ 3.62 μg/mL and >6.10 μg/mL were associated with the increased risk of HFSR onset (odds ratio: 16.6, p < 0.01) and severity (odds ratio: 15.7, p < 0.01), respectively. Conclusion. Monitoring of the sorafenib trough concentration may be practical for avoiding HFSR.
1. Introduction
Sorafenib is an oral small-molecule multikinase inhibitor that inhibits the activity of several protein kinases, including VEGFR receptors, PDGFR-β, and RAF kinase [1]. Compared with placebo, sorafenib has a significant positive effect on the overall survival of patients with advanced hepatocellular carcinoma (HCC) [2]. Although the first-line drug for advanced HCC is atezolizumab plus bevacizumab [3], sorafenib is the oral first-line therapy when that treatment is not indicated, for example, when the patient has a comorbidity such as an autoimmune disease.
Sorafenib is usually administered at a fixed dose of 400 mg twice daily, but the dose is often reduced due to early and severe adverse effects. The most common adverse effects associated with sorafenib treatment are hand-foot skin reaction (HFSR), hypertension, rash, and diarrhea [4]. In particular, HFSR with painful erythema, edema, and desquamation on the patient’s palms and soles is defined as a severe adverse effect (grade ≥ 2). Severe HFSR can limit activities of daily living and impair quality of life and may result in dose reduction and discontinuation [5, 6]. Therefore, prediction and monitoring of HFSR development are necessary to continue sorafenib treatment.
Recent trials have indicated that Asian patients have increased susceptibility to HFSR induced by sorafenib treatment [2]. Therefore, it is possible that genetic polymorphisms, which are highly frequent in Japanese people, may be factors in the increased incidence of HFSR. Several previous studies reported the effects of genetic polymorphisms on dermatological adverse events. Lee et al. suggested that SNPs of TNF-α, VEGF 1991CC, and UGT1A9 IVS -37431AA are associated with grade ≥ 2 HFSR [7]. In other report, SNP profiles of CYP3A4, CYP3A5, UGT1A9, UGT1A8, and MRP2 had no clear associations with the development of dermatological adverse events [8]. The results vary; accordingly, further information is needed for confirmation.
The signal transducer and activator of transcription (STAT) 3 protein has dual functions as a signal transduction factor and transcription factor and is also involved in the regulation of cellular differentiation, survival, and proliferation [9]. STAT3 is expressed in cells throughout the body and is responsible for a wide range of cellular functions by transcriptionally regulating proteins involved in maintaining cellular homeostasis, such as cell proliferation, the cell cycle, and inflammation [10]. It has been reported that the inhibitory effect of sorafenib on cell proliferation is mediated by STAT3 inhibition [11]. The development of skin toxicity, especially HFSR, with sorafenib treatment for HCC has been reported to be significantly associated with improved survival [12, 13]. In addition, STAT3 plays a very important role in maintaining homeostasis in the skin tissue [14]. Therefore, STAT3 is considered to be closely related to multitarget tyrosine kinase inhibitor (mTKI)-induced HFSR development. Many single nucleotide polymorphisms (SNPs) in STAT3 have been identified in the Japanese population [15]. A previous study reported an odds ratio (OR) of 10.75 for HFSR onset with the GC and CC genotypes of rs4796793, one of the STAT3 SNPs, versus the GG genotype in patients with renal cell carcinoma treated with mTKIs, including sorafenib [16]. In other words, STAT3 gene polymorphism may be useful for predicting sorafenib-induced HFSR development.
The pharmacokinetics of sorafenib show large interindividual variations [17]. The monitoring of the trough concentration or the area under the blood concentration (AUC) of sorafenib administered at a fixed dose may help predict the occurrence of adverse effects during treatment. Previous reports on the benefits of sorafenib trough concentration or AUC monitoring for HFSR have yielded controversial results [8, 18–20]. In another report, the authors proposed that therapeutic drug monitoring with a target sorafenib trough concentration of 3.75 μg/mL was not feasible [21]. In the report, the first dose adjustment was made 4 weeks after the start of oral administration. However, it has been reported that the onset of HFSR occurs within 4 weeks after the start of oral administration [7]. Therefore, sorafenib concentration monitoring before 4 weeks may be clinically useful.
In the present study, we evaluated the practicality of STAT3 polymorphism as a predictive biomarker and sorafenib blood concentration as a monitoring biomarker for sorafenib-induced HFSR in patients with HCC.
2. Methods
2.1. Patients
Patients with unresectable HCC treated with sorafenib between July 2014 and October 2017 were included. Eligibility criteria were age 20 years or older, an Eastern Cooperative Oncology Group performance status of 0 or 1, and a child-Pugh score ≤7 (Child class A or B). Exclusion criteria were New York Heart Association class III or higher heart failure, history of symptomatic coronary artery disease or myocardial infarction within 24 weeks prior to enrollment, arrhythmia requiring control with antiarrhythmic drugs such as β-blockers or digoxin, uncontrolled hypertension, and use of drugs that inhibit or induce CYP3A4.
2.2. Treatment Protocol
All patients were administered sorafenib orally at a dose of 400 mg twice daily. The dose was adjusted or discontinued based on adverse events or disease progression. Patients who experienced grade ≥ 3 toxicity (according to common toxicity criteria (CTC-AE) version 4.0) or intolerable toxicity had sorafenib treatment withheld until adequate recovery was achieved. Sorafenib was administered without food or with a low- or moderate-fat meal. The study period was 57 days after the start of sorafenib administration.
2.3. Measurement of Sorafenib Plasma Concentration
Plasma samples (5 mL) were obtained for measurement of the trough concentration of sorafenib at scheduled trial visits on days 8, 29, 36, and 57. The plasma elimination half-life of sorafenib in Japanese patients with HCC has been reported to be 25.5 h [22]. Thus, in this study, the sorafenib concentration 4 days after the start, restart, or dose change of sorafenib was used for analysis. Plasma was separated by centrifugation (1610 × g, 10 min) and stored at −80°C until measurement. Sorafenib plasma concentrations were measured by high-performance liquid chromatography (HPLC) with minor modifications of the method of Blanchet et al. [23].
2.4. Genotyping Procedures for STAT3 Gene Polymorphisms
We selected the rs4796793 SNP of STAT3 for genotyping in this study. Cell-free DNA (cfDNA) was extracted from plasma using an ISOSPIN Blood and Plasma DNA kit (Nippon Gene, Tokyo, Japan), and the rs4796793 SNP was genotyped. To determine the rs4796793 allele, polymerase chain reaction (PCR) was performed using a KOD FX polymerase (Toyobo, Osaka, Japan). The following primer pairs were used: forward primer, 5′-CCCATCTCCG CCTATAGTCT CTTG-3′; reverse primer, 5′-TGGCCTCTCC TATCTGCTAT TCATG-3′. The PCR conditions were as follows: initial denaturation at 94°C for 2 min, denaturation at 98°C for 10 s, annealing at 65.2°C for 10 s, and extension at 68°C for 20 s. The number of amplification cycles was 35. The Wizard® SV Gel and PCR Clean-Up System (Promega Japan, Tokyo, Japan) was used to purify the PCR products.
Direct sequencing was performed by Azenta Life Sciences (Tokyo, Japan). Genotypes of the rs4796793 SNP were determined according to the genotype diagnostic criteria for this study. The criteria were created using 64 HCC patient samples in different studies (jRCTs031190017 and jRCTs031190103) to avoid discrepancies between the diagnoses made using whole blood-derived DNA and plasma-derived cfDNA obtained from the same patients.
2.5. Assessment of HFSR
The assessment of HFSR was performed weekly for the first month and then every 4 weeks thereafter. Sorafenib-induced HFSR was graded according to CTC-AE version 4.0.
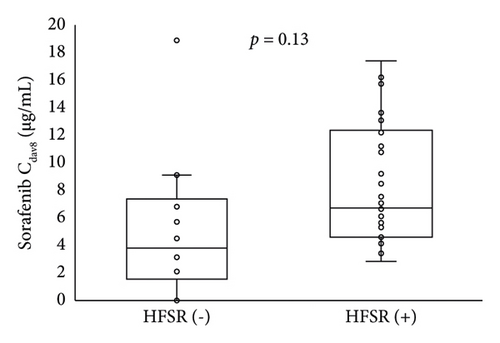
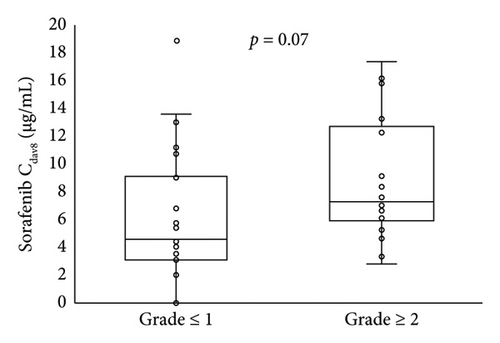
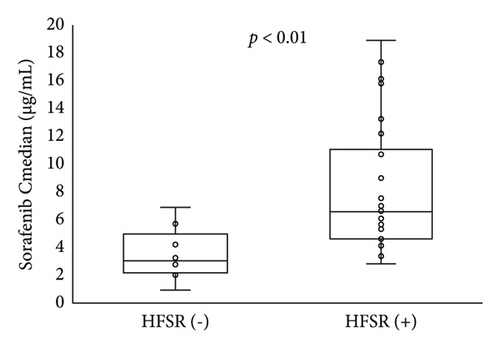
For early-stage HFSR analysis (i.e., up to day 29), the trough sorafenib concentration on day 8 (Cday8) was used to analyze the relationship of HFSR onset or the worst grade of HFSR in the first 29 days with the sorafenib concentration. For analysis of all follow-up periods (i.e., up to day 57), the median trough concentration after the start of administration (Cmedian) for each patient was used to analyze the relationship of HFSR at 57 days with the sorafenib concentration. The Cmedian until the onset or worst grade of HFSR was used for patients who had experienced HFSR events. The Cmedian up to day 57 was used for patients who had not experienced HFSR events.
2.6. Statistical Analysis
Results are expressed as the median and range. The statistical significance of differences in nonparametric values between the two groups was analyzed with the Mann–Whitney U test. Fisher’s exact probability test was used to compare the proportion of patients with a given characteristic between the two groups. ROC curve analysis was performed to assess the discriminatory ability of trough sorafenib concentrations for HFSR onset or grade ≥ 2 HFSR. Logistic regression analyses were used to identify parameters associated with HFSR onset or grade ≥ 2 HFSR, and ORs with 95% confidence intervals (95% Cis) were estimated. Age ≥ 70 years, sex, body weight ≥ 61.3 kg, serum alpha-fetoprotein level ≥400, child-Pugh classification A or B, sorafenib concentration, and STAT3 polymorphisms were analyzed in univariate logistic regression analyses. Multivariate analysis was performed using sorafenib concentration and STAT3 polymorphisms as independent variables by the forced entry method. A p value less than 0.05 was considered statistically significant. ROC curve analysis was performed using JMP Pro® version 15 (SAS Institute Inc., Cary, NC). All other analyses were performed using SPSS Statistics® version 24.0 (IBM Japan Ltd., Tokyo, Japan).
3. Results
3.1. Patient Characteristics
A total of 43 patients were included in this study. The baseline characteristics are presented in Table 1. Their median age was 70 years, and all eligible patients had a child-Pugh score ≤ 7. The distribution of rs4796793 genotypes was similar to the distribution in the Japanese population from the National Center for Biotechnology Information (NCBI) database (https://www.ncbi.nlm.nih.gov/snp/rs4796793).
| Characteristics | Patients (N = 43) |
|---|---|
| Age, median (range) | 70 (54–84) |
| Sex, n (%) | |
| Male | 38 (88.4) |
| Female | 5 (11.6) |
| BW (kg), median (range) | 61.3 (36.0–77.4) |
| AFP, n (%) | |
| <400 ng/mL | 26 (60.5) |
| ≥400 ng/mL | 17 (39.5) |
| Child–Pugh (score), n (%) | |
| A (5-6) | 37 (86.0) |
| B (7) | 6 (14.0) |
| rs4796793 genotype, n (%) | |
| G/G | 6 (14.0) |
| G/C | 21 (48.8) |
| C/C | 16 (37.2) |
- BW, body weight; AFP, alpha-fetoprotein.
3.2. Changes in Sorafenib Concentration and Daily Dose
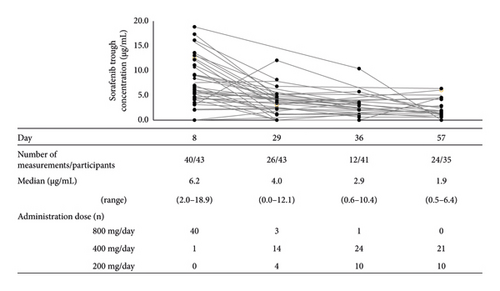
All patients started treatment with the standard dose of 400 mg sorafenib twice daily. Only three patients continued the initial dose until day 29, and no patients continued the initial dose until day 57. The reasons for the initial dose reduction and severity were HFSR in 16 patients (grade 2: n = 14, grade 3: n = 2), anorexia and fatigue in 6 (grade 1: n = 1, grade 2: n = 5), hematologic toxicity in 5 (grade 2: n = 3, grade 3: n = 2), increased hepatobiliary test values in 4 (grade 2: n = 1, grade 3: n = 3), rash in 3 (grade 2: n = 2, grade 3: n = 1), stomatitis in 2 (grade 2: n = 2), and others in 4. One patient discontinued treatment because of disease progression. The median plasma concentrations of sorafenib decreased with the treatment duration (Figure 1).
3.3. Association of Sorafenib Trough Concentration or STAT3 Polymorphisms with HFSR
The number of patients with HFSRs and their most severe grade during the study period are presented in Table 2. Of the 43 patients, 30 (69.8%) experienced HFSR. Of these, 29 (96.7%) developed HFSR within 29 days. Grade ≥ 2 HFSR developed in 63.3% of those with HFSR.
| N = 43 | |
|---|---|
| Development of HFSR, n (%) | 30 (69.8) |
| Development by day 29, n | 29 |
| Most severe grade, n (%) | |
| Grade 1 | 11 (36.7) |
| Grade 2 | 15 (50.0) |
| Grade 3 | 4 (13.3) |
- HFSR, hand-foot skin reaction.
The relationship of HFSR onset and severity up to day 29 with the sorafenib trough concentration on day 8 is shown in Figure 2. Patients who developed HFSR and those with grade ≥ 2 severity tended to have higher blood concentrations of sorafenib on day 8. Table 3 shows the relationship of STAT3 gene polymorphisms with HFSR onset or severity; no significant relationship was found.
| HFSR onset | HFSR severity | |||||
|---|---|---|---|---|---|---|
| HFSR (−) | HFSR (+) | p | Grade ≤ 1 | Grade ≥ 2 | p | |
| GG | 2 | 4 | 0.65 | 4 | 2 | 0.50 |
| GC, CC | 12 | 25 | 21 | 16 | ||
- HFSR, hand-foot skin reaction.
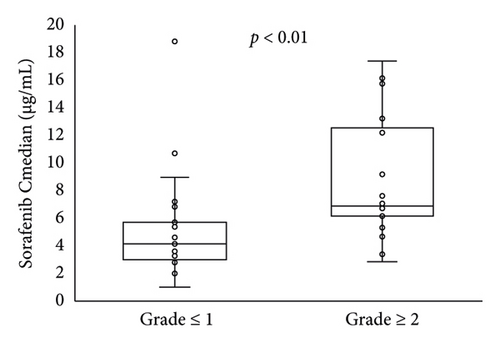
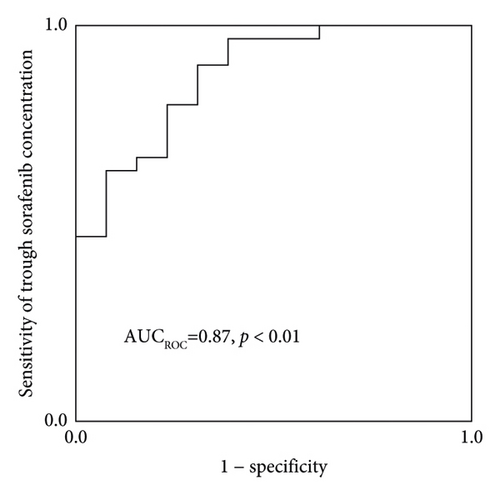
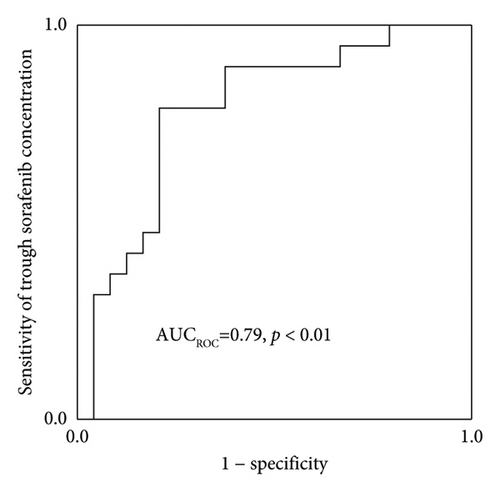
The Cmedian sorafenib was significantly higher in patients with HFSR onset or grade ≥ 2 severity up to day 57 (Figure 3). Based on an ROC curve plotted using the Cmedian (Figure 4), the threshold values of the trough sorafenib concentration predicting HFSR onset and HFSR severity (grade ≥ 2) were 3.62 μg/mL (AUC 0.87, p < 0.01) and 6.10 μg/mL (AUC 0.79, p = 0.02), respectively. There was no significant correlation between STAT3 gene polymorphisms and HFSR (Table 4).
| HFSR onset | HFSR severity | |||||
|---|---|---|---|---|---|---|
| HFSR (−) | HFSR (+) | p | Grade ≤ 1 | Grade ≥ 2 | p | |
| GG | 2 | 4 | 0.60 | 4 | 2 | 0.45 |
| GC, CC | 11 | 26 | 20 | 17 | ||
- HFSR, hand-foot skin reaction.
Table 5 shows the results of univariate and multivariate logistic regression analyses for HFSR onset or grade ≥ 2 up to day 57. In univariate logistic regression analysis, body weight and the Cmedian were independent variables for the increased risk. Because a significant correlation was observed between the trough concentration/dose ratio of sorafenib and body weight (ρ = −0.48, p < 0.001, Spearman’s rank correlation coefficient) and multicollinearity was expected, body weight was excluded from the multivariate analysis. In the multivariate analysis including the Cmedian and STAT3 rs4796793 SNP, a Cmedian ≥ 3.62 μg/mL was associated with an increased risk of HFSR onset (OR 16.6; 95% CI 3.2–87.3, p < 0.01). A Cmedian ≥ 6.10 μg/mL was independently associated with the increased risk of HFSR severity (OR 15.7; 95% CI 3.3–75.7, p < 0.01). No significant difference was observed between the STAT3 rs4796793 SNP and HFSR onset or severity.
| Total | HFSR onset | HFSR ≥ grade 2 | ||||||
|---|---|---|---|---|---|---|---|---|
| Univariate analysis | Multivariate analysis | Univariate analysis | Multivariate analysis | |||||
| OR (95% CI) | p | OR (95% CI) | p | OR (95% CI) | p | OR (95% CI) | p | |
| Age ≥70 years | 0.39 (0.10–10.21) | 0.18 | 0.94 (0.28–3.14) | 0.92 | ||||
| Female sex | 0.99 | 0.48 (0.07–3.24) | 0.46 | |||||
| BW ≥ 61.3 kg | 0.20 (0.05–0.88) | 0.03 | 0.09 (0.02–0.37) | <0.01 | ||||
| AFP ≥ 400 ng/mL | 0.63 (0.16–2.53) | 0.51 | 0.63 (0.18–2.20) | 0.46 | ||||
| Child–Pugh score ≥ 7 | 4.20 (0.61–28.9) | 0.15 | 3.6 (0.37–35.3) | 0.27 | ||||
| Cmedian (μg/mL) ≥ 3.62 | 14.6 (3.01–71.0) | <0.01 | 16.6 (3.17–87.3) | <0.01 | — | — | — | — |
| Cmedian (μg/mL) ≥ 6.10 | — | — | — | 14.3 (3.24–62.5) | <0.01 | 15.7 (3.27–75.7) | <0.01 | |
| rs4796793GC or CC | 0.85 (0.13–5.31) | 0.86 | 0.42 (0.05–3.82) | 0.51 | 0.59 (0.10–3.62) | 0.57 | 1.64 (0.18–14.9) | 0.66 |
- BW, body weight; AFP, alpha-fetoprotein; Cmedian, sorafenib median concentration.
4. Discussion
HFSR causes pain, activity limitation, and deterioration of ADLs and is one of the dose-limiting toxicities of sorafenib treatment. In our study, most cases of HFSR occurred within 29 days, and 63.3% (19 of 30) were grade 2 or higher. Thus, early monitoring of the onset of HFSR is important for continued treatment with sorafenib. We retrospectively investigated the relationship of the sorafenib trough concentration and STAT3 gene polymorphism with sorafenib-induced HFSR. We found that STAT3 gene polymorphisms were not a predictive biomarker for sorafenib-induced HFSR. On the other hand, the sorafenib trough concentration may be a predictive biomarker for HFSR.
Because the STAT3 gene polymorphism was analyzed retrospectively, we used plasma samples for the measurement of the sorafenib concentration for the STAT3 analysis. Because cfDNA may contain circulating DNA from tumor cells [24], the SNPs detected in the present study might be derived from cancer cells. STAT3 gene polymorphisms have not been reported in HCC [25–27]. The distribution of genotypes for each STAT3 SNP in the subjects of this study was similar to the distribution in the Japanese population from the NCBI database. Therefore, we expect that STAT3 gene polymorphisms detected in cfDNA could be used for the analysis of HFSR.
Previous reports have shown that the selective loss of STAT3 in keratinocytes impairs wound healing and that skin-specific STAT3 transgenic mice develop psoriasis [28]. In another report, STAT3 was essential for skin regeneration in vitro [29]. Ito et al. reported that the rs4796793 SNP located near the 5′ end of the STAT3 coding region reduces STAT3 expression [30]. A previous work described a significant relationship between the STAT3 gene polymorphism rs4796793 and HFSR induced by sunitinib, sorafenib, and axitinib in renal cell carcinoma [16]. Therefore, we hypothesized that rs4796793 SNP would be involved in sorafenib-induced HFSR in patients with HCC. However, we found no association between the onset or severity of HFSR and the STAT3 gene polymorphism during the study period. It has been suggested that patients with renal cell carcinoma are more likely to develop HFSR compared with those with HCC although the reason for this is unclear [4]. The reason why the results differed from those of a previous report [16] may be that the targeted cancers were different and because exposure indicators such as blood concentration were not previously examined.
A previous report examined whether other genetic polymorphisms were risk factors for sorafenib-induced HFSR. The SNPs of VFGF 1991CC, TNF-alpha-308GG, and UGT1A9 IVS1-37431 have been reported to be risk factors for grade ≥ 2 HFSR [7]. In particular, the UGT1A9 gene polymorphism affects the metabolism of sorafenib, suggesting that the effect is directly reflected in the sorafenib concentration, which was evaluated in the present study. To examine genetic polymorphisms associated with the increased risk of HFSR, it is necessary to increase the number of patients and examine multiple genetic polymorphisms.
Guchelaar et al. reported that dose escalation targeting a trough level of 3.75 μg/mL was not a feasible approach [21]. This trough level was the mean or median of the observed concentration after the administration of 400 mg of sorafenib twice daily in previous reports. In that work [18], the first evaluation of the sorafenib concentration was performed 4 weeks after the start of oral administration. However, the onset of HFSR has been reported to occur within 4 weeks from the start of oral administration [7], and it may be necessary to evaluate the blood concentration more frequently in the initial period of administration. On day 8 after sorafenib initiation, there was a high rate of retention at the starting dose and the sorafenib concentration was thought to be at a steady state, and it is thus assumed that the Cday8 is related to HFSR onset or severity up to 29 days after oral sorafenib initiation. Therefore, we evaluated the Cday8 as an early monitoring biomarker for HFSR up to day 29. In our results, 40 patients (93%) were still taking 800 mg sorafenib twice daily on day 8 (Figure 1). The Cday8 tended to be higher in patients who developed HFSR and those with grade ≥ 2 severity up to day 29 but not significantly (Figure 2). This may indicate that weekly assessments of sorafenib trough concentrations, not only on day 8, are needed up to day 29.
The Cmedian was associated with HFSR over the trial period. Based on the ROC curve, the threshold values of the sorafenib concentrations for predicting HFSR onset or grade ≥ 2 were 3.62 and 6.10 μg/mL, respectively. From the results of multivariate analysis, the odds ratios for the thresholds of onset and grade ≥ 2 severity were 16.6 and 15.7, respectively. Fukudo et al. reported that the estimated threshold for predicting grade ≥ 2 HFSR based on an ROC curve was 5.78 μg/mL [6], which is comparable to our findings. In another report, Noda et al. determined that the sorafenib trough blood concentration was significantly related to grade ≥ 2 adverse effects (fatigue, diarrhea, HFSR, and rash) and that the threshold for predicting grade ≥ 3 adverse effects was 3.45 μg/mL [18]. The following aspects differed from those of our study: (1) starting dose proportions (800 mg/day in the present study vs. 800 mg/day (n = 4), 400 mg/day (n = 14), and 200 mg/day (n = 8) based on the treating physicians’ recommendation), (2) proportion of child-Pugh B patients (14% in the present study vs. 30.8% in Noda et al.), and (3) severity of adverse effects to be evaluated (grade 2 in the present study vs. 3 in Noda et al.). Therefore, a rigorous comparison of the results is not possible.
Various studies have examined which exposure index to use for analysis. The evaluation of the use of the sorafenib concentration in a similar time frame as adverse effect onset or severity is meaningful [6], but it has the disadvantage that it does not always reflect the drug exposure up to that point. In our study, the Cmedian until HFSR onset or the worst grade of HFSR was used to assess the relationship between the sorafenib concentration and HFSR because we expected that it would be a better exposure index. On the other hand, it should be noted that we used the Cmedian obtained over the entire study period for patients who had not experienced HFSR events.
Our results show a large variation in sorafenib concentration on day 8 (Figure 2, all 800 mg/day doses). Therefore, the establishment of an exact target sorafenib concentration is difficult. However, if the sorafenib concentration is higher than the abovementioned value, a dose reduction may help avoid serious adverse effects. Although we did not examine efficacy, previous reports suggested a sorafenib trough concentration of 1.40 μg/mL or higher for the sorafenib treatment response [18]. Therefore, it would be advisable to measure the trough concentration after dose reduction. In addition, the AUC of sorafenib has been reported to be significantly higher in patients with grade ≥ 2 HFSR than in patients with grade < 2 HFSR [19]. Because sorafenib is often administered on an outpatient basis, repeated blood collections to measure AUC are impractical. Therefore, trough concentration measurement is considered a desirable approach for evaluation purposes. In our study, only 3 patients were able to continue on the starting sorafenib dose of 800 mg/day by day 29. The previous reports have attempted to start with doses lower than 800 mg and then dose escalation as tolerated [31]. In dose escalation studies, it may be useful to incorporate not only tolerability but also trough concentrations as objective indicators. A prospective clinical trial is a future task.
This report has the following limitations: (1) use of cfDNA for polymorphism diagnosis, (2) a design other than that of a prospective clinical trial, and (3) existence of selection bias such as small number of participants and only Japanese subjects. Different populations or races may have different results. Although the STAT3 rs4796793 SNP was not a predictor of sorafenib-induced HFSR in this study, a prospective study including other factors is required.
5. Conclusion
In our study, the STAT3 rs4796793 SNP was not predictive of sorafenib-induced HFSR. Monitoring of the sorafenib trough concentration and consideration of a dose reduction if the level greatly exceeds the threshold value may be practical ways to avoid serious HFSRs and continue sorafenib treatment.
Ethical Approval
This study was approved by the Biomedical Research Ethics Committee of the Chiba University Graduate School of Medicine (926). This study was performed in accordance with the Declaration of Helsinki.
Consent
Informed consent was obtained from all subjects participating in the study. Consent for the STAT3 gene polymorphism was obtained by opting out.
Conflicts of Interest
Sadahisa Ogasawara received honoraria from Bayer, Leverkusen, Eisai, Eli Lilly, Chugai Pharmaceutical, AstraZeneca, and Merck & Co.; consulting or advisory fees from Bayer, Eisai, Merck & Co., Chugai Pharmaceutical, Eli Lilly, and AstraZeneca; and research grants from Bayer, AstraZeneca, Eli Lilly, Gilead Sciences, and Eisai. Naoya Kato received honoraria from Bayer Yakuhin, Eisai, Sumitomo Dainippon Pharma, and Merck & Co.; consulting or advisory fees from Bayer Yakuhin, Chugai Pharmaceutical, Eli Lilly Japan, Takeda Pharmaceutical, and Eisai; and research grants from Bayer Yakuhin, Chugai Pharmaceutical, Eisai, Eli Lilly Japan, and Takeda Pharmaceutical.
Authors’ Contributions
HT was responsible for conceptualization, investigation, and original draft writing. TS was responsible for investigation of the study. MU was responsible for the methodology and investigation. NK was responsible for investigation and review writing and editing. SO was responsible for conceptualization, investigation, and funding acquisition. NK was responsible for funding acquisition and review writing and editing. SY, TS, and II were responsible for review writing and editing. All authors have read and approved the final manuscript.
Acknowledgments
This work was supported by research funding from Bayer. They had no involvement in any other aspect of this study. The authors thank the staff in the Division of Pharmacy and the Chiba University Hospital staff for their assistance with this work.
Open Research
Data Availability
The data used to support the findings of this study are available from the corresponding author upon reasonable request.


