Maximum Power Extraction in Photovoltaic Systems Using High-Performance Adaptive Control Approach
Abstract
The nonlinearities present in photovoltaic (PV) generator models can significantly impact the performance of PV systems, leading to decreased system efficiency and reduced profitability. This paper is aimed at addressing these challenges by developing a novel control algorithm based on a high-performance adaptive control method for photovoltaic systems. The proposed algorithm is designed to effectively track set points and optimize power extraction even in the presence of disturbances. The key contribution of this work lies in the application of this control strategy specifically to PV systems to achieve optimal performance. When compared to traditional control methods, the proposed approach demonstrates significant improvements, notably in terms of power extraction efficiency and system loss reduction. Moreover, the control algorithm effectively ensures accurate tracking of set points. These outcomes underscore the notable performance enhancements facilitated by the proposed algorithm. In conclusion, the developed control algorithm offers superior performance in optimizing power extraction and maintaining precise set point tracking for PV systems, leading to improved system efficiency and increased profitability.
1. Introduction
In the pursuit of sustainable and low-carbon energy solutions, the imperative to mitigate carbon emissions has fueled extensive research into renewable energy systems [1]. Solar renewable energy systems create significantly fewer harmful environmental effects than conventional energy sources, such as air pollution and greenhouse gas emissions [2]. Renewable energy sources are extensively used in several sectors, such as energy production [3, 4], transportation [5, 6], and agriculture [7, 8]. The effectiveness of renewable energy systems in energy production depends greatly on external (environmental) factors. Due to changing effects and circumstances, solar renewable energy does not have a fixed voltage or current source [9].
Maximum power point tracking (MPPT) is a technique used in solar renewable energy systems (SRES) to automatically track photovoltaic arrays’ maximum power point (MPP) [10, 11]. The rapid and abrupt changes in the environment have a substantial impact on both the MPP and the output I-V curve of PV arrays [12, 13]. Therefore, when developing and putting into practice MPPT algorithms, the environment parameter fluctuation should be considered. The literature on SRES has thoroughly covered a number of significant research subjects, including rapid changes in solar irradiance, changes in PV array temperature, and partial shadowing conditions (PSC) [14, 15]. A variety of high-accuracy MPPT methods have been provided by researchers to control the internal and exterior effects of SRES. Additionally, as stated in [16, 17], researchers have created a variety of analytical and numerical MPPT methods for application in SRES. The terminal voltage (V) and current of the detected PV array have mostly been tuned (I). To harvest the maximum PV power possible, further research projects have employed the measured λ and T.
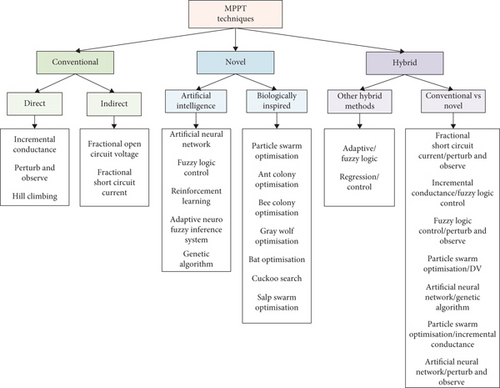
MPPT algorithms are classified into three categories (Figure 1) based on the type of optimization algorithm used [18]. The first group represents the conventional MPPT methods, which are classified into two categories: the direct (online) and indirect (offline) approach [9, 19]. Perturb and observe and incremental conductance algorithms, derived from hill climbing local search family optimization algorithms, have been presented as direct MPPT methods [20]. Fractional open circuit voltage and fractional short circuit current are the commonly used indirect MPPT methods, where V and I are computed based on a ratio of the open circuit voltage (Voc) or the short circuit current (Isc) in the offline state [21]. The second group represents the novel MPPT methods, which were used to obtain the global MPP in SRES. Novel optimization algorithms, including artificial intelligence and biologically inspired, have been used to obtain the global MPP [9, 22, 23]. In this article, the novel MPPT approaches are classified according to their interaction with λ and T. The third group represents the hybrid methods, which are a combination between conventional MPPT algorithms and novel MPPT techniques [14]. Various hybrid techniques have been used in the SRES. However, only a few hybrid MPPT methods based on linear or nonlinear control systems are found in the literature [24].
The aim of this paper is the development of a new algorithm inspired from an indirect adaptive control method applied to the photovoltaic system to ensure optimum power point tracking. The superiority of this control technique compared with others appears in its ability to adapt to different functional circumstances and its speed, accuracy, and robustness against the presence of various disturbances.
This paper is structured as follows: Section 2 presents the solar PV cell model. Section 3 is devoted to the presentation of indirect adaptive control. Section 4 addresses the use of the proposed control algorithm in the PV system. The robustness study is presented in Section 4. In the final section, conclusions and perspectives are drawn.
2. PV Cell Modeling
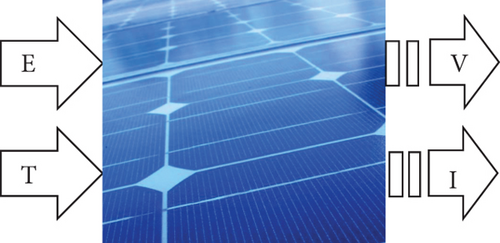
Generally, the choice of a model is related to the targeted utility. Since a PV cell forms the cornerstone of a module, it is preferable to provide a broad description of a PV cell before moving on to the study of the model with five parameters. The inputs and outputs of a solar PV cell are highlighted in Figure 2, where E, T, V, and I represent, respectively, irradiation, environment temperature, voltage, and current.
Several mathematical models are used to describe the behavior and operation of PV. Two methods are presented below: the single-diode model and the dual-diode model.
2.1. Modeling of a Single-Diode PV Cell
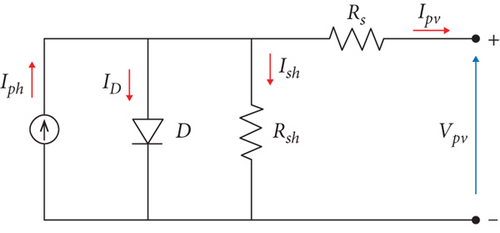
The equivalent electric circuit of the PV cell is given in Figure 3. The diode in the equivalent circuit below emulates some phenomena that occur at the panel cell level. A shunt resistor Rsh is used to model the losses caused by contaminants surrounding the junction and on the cell’s corners, while a series resistor RS is used to model the ohmic losses [25, 26].
2.1.1. The Diode Current (ID)
2.1.2. Saturation Current (Ish)
2.2. Modeling of a Dual-Diode PV Cell
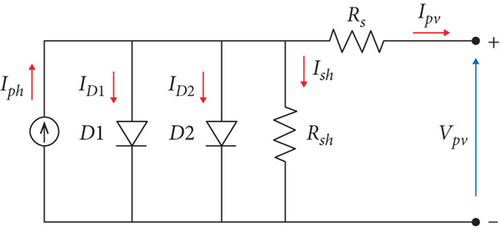
In this model, the photovoltaic cell is represented by the electrical circuit illustrated in Figure 4 which consists of a current source modeling the luminous flux, two diodes for the polarization of the cell, a shunt resistance, and a series resistance.
The method used in our work is that of single-diode because it is the most commonly used method for modeling the behavior of a photovoltaic (PV) cell due to its simplicity, sufficient accuracy, intuitive understanding, availability, and standardization. As mentioned earlier, the single-diode model requires only a few parameters to characterize the performance of the PV cell, making it easily accessible even to beginners. Additionally, the single-diode model is based on a representation of the PV cell in terms of a single-diode element, which makes it easier to understand intuitively. Furthermore, the one-diode model has been standardized by the International Electrotechnical Commission (IEC) and is widely used in the PV industry for the characterization and certification of PV cells.
In this paper, a PV cell of type SIEMENS SM 110-24 is used. Table 1 shown below provides the technical information of the last-mentioned PV cell type.
| Symbol | Description | Values | Unit |
|---|---|---|---|
| Ppv | PV power | 110 | W |
| Impp | Maximum current at PPM | 3.15 | A |
| Vmpp | The maximum voltage at PPM | 35 | V |
| Icc | Short circuit current | 3.45 | A |
| Vco | Open circuit voltage | 43.5 | V |
| aoc | Temperature coefficient of short circuit current | 1.4 | mA/°C |
| Boc | Voltage coefficient | -152 | mV/°C |
| Pmpp | Maximum power | 110 | W |
3. Indirect Adaptative Control
The basic philosophy of indirect adaptive control is to use input-output data to estimate the parameters of an unknown system. The estimated parameters are then used to alter the controller settings so that the controlled system’s transfer function matches that of the model [32, 33]. The indirect adaptive control has been applied on many applications, among them [30–32]. The block diagram of the indirect adaptive control is shown in Figure 5. One can notice how controller parameters are continuously adapted by the designed model.
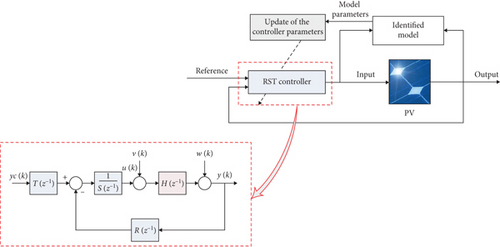
The polynomial coefficients A(z−1) and B(z−1) given by equations (12) and (13) are identified using the recursive least square method, as it will be discussed in the subsection below.
3.1. Algorithm of Recursive Least Squares
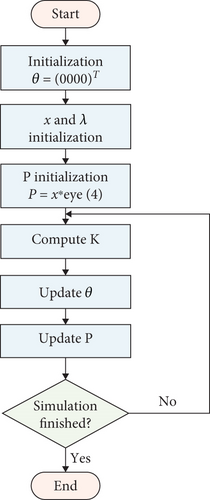
The flowchart shown in Figure 6 describes the main steps of the used least square method.
3.2. RST Control Approach
By using an algebraic approach of pole positioning, the RST controller is created. The aim is to simulate in closed loop the system behavior that may be represented as a rational fraction z−1 using a transfer function model z−1. This function is typically of the second order and is defined using the following types of criteria: static gain, damping, and overshoot [33, 34]. The model’s denominator Am(z−1) is often determined using these criteria. On the other hand, Bm(z−1) cannot be entirely forced as an option. These limits will not have a significant impact on the behavior of the system since the influence of the transfer function’s zeros is less than that of its poles [35, 36].
The internal structure of the RST controller used in this paper is highlighted in Figure 5, where R, S, and T are discrete polynomials [37, 38].
3.2.1. Algebraic Synthesis of the RST Control Law
- (i)
Pd(z−1) consists of the system’s dominant poles
- (ii)
Pa(z−1) consists of the system’s auxiliary poles
With , , 0.25 ≤ wnTe ≤ 1.5, and 0.7 ≤ ζ ≤ 1. For Pa(z−1), the auxiliary poles are introduced for robustness, and they are chosen faster than the dominant poles [43, 44].
4. Simulation and Results
Table 2 lists the different PV panel parameters. The control method consists of an identifier based on the least mean squares algorithm with a forgetting factor, an adaptive controller, a system, and RST polynomials [45, 46]. The recursive method with a fixed forgetting factor was used to estimate the system parameters in real time and to update the coefficients of the RST controller polynomials at each instant t. The developed Simulink simulation model is illustrated in Figure 7.
| Experimental parameters | Value |
|---|---|
| Es | 1000 W/m2 |
| Ta | 25°C |
| P1 | 0.00345 |
| P2 | 0.58 × 10⁻⁵ |
| P3 | −0.336 × 10⁻⁴ |
| P4 | 381.2367 |
| Rs | 0.6 Ω |
| Rp | 150 Ω |
| Ns | 72 |
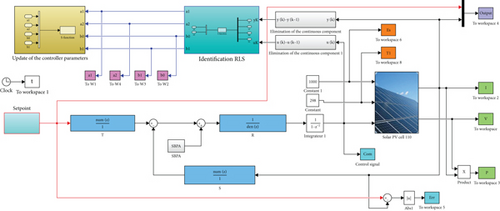
After several simulations were performed using the different parameter values obtained using the identification algorithm, we obtained the best plant parameters in terms of error and convergence. These parameters are summarized in Table 3 [47, 48].
|
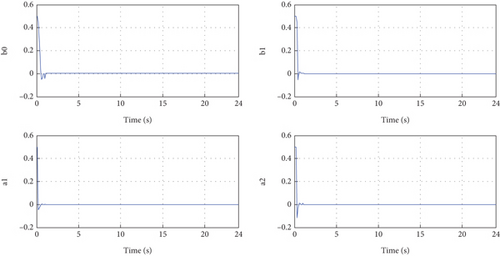
Figure 8 presents a significant observation regarding the evolution of the determined model parameters. The plotted data clearly demonstrates the convergence of all coefficients of the identified model to constant values. This convergence implies that the identification model successfully captures the dynamics and behavior of the actual system. Consequently, the identification approach used in this study is validated, as it effectively estimates the parameters of the system based on available data. The confirmed accuracy of the identification model establishes its reliability in representing the actual system, reinforcing the validity of the employed methodology [49, 50]. Therefore, the findings from Figure 8 provide strong evidence supporting the successful validation of the identification approach and its ability to accurately represent the behavior of the studied system.
The obtained RST controller parameters are given in Table 4.
|
To maximize power extraction and restore the reference signal that served as our control, we simulated the panel in an open loop with 1000 W/m2 of irradiation and 25°C of temperature, and the simulation results are shown in Figure 9.
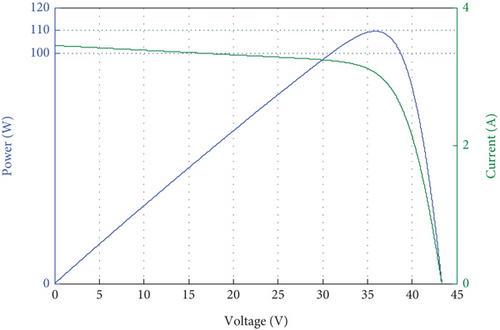
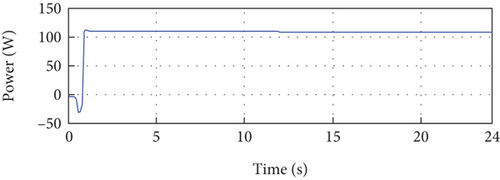
From Figure 9, one can notice that the maximum power, voltage, and current at the maximum power point are, respectively, as follows: Pmpp = 109.2092W, Vmpp = 34.9980V, and Impp = 3.1204A.
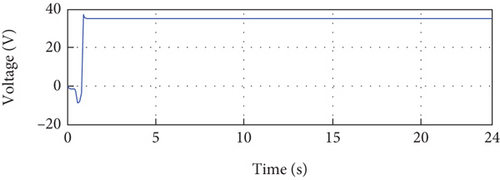
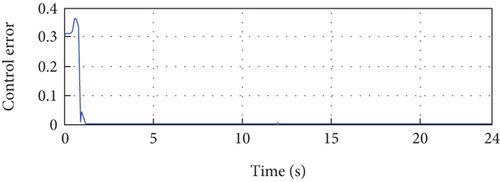
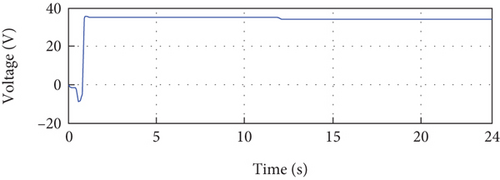
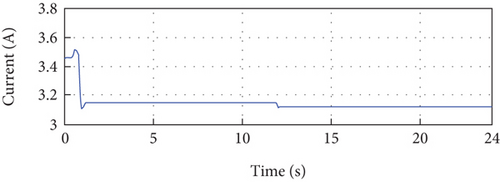
Figure 10 presents the simulation results conducted under specific conditions of a temperature of 25°C and an irradiance of 1000 W/m2. In Figure 10(a), it is evident that the PV current closely tracks its reference value with a tolerable error, indicating a successful current control. Moving to Figure 10(c), the behavior of the PV voltage is depicted. After an initial transition period of 1 second, the PV voltage converges to the desired reference voltage of 35 volts, demonstrating effective voltage control.
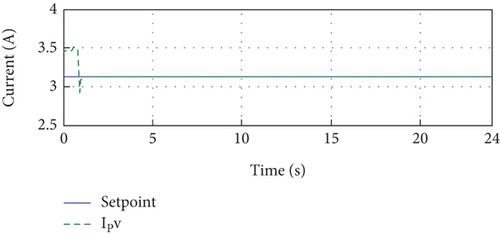
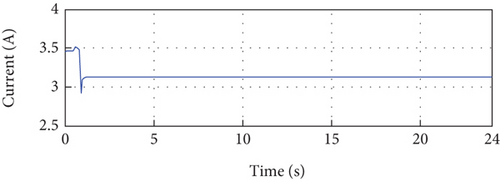
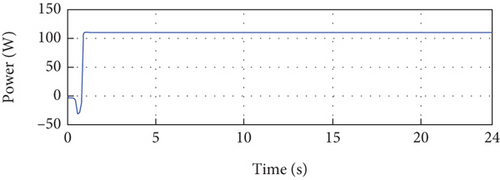
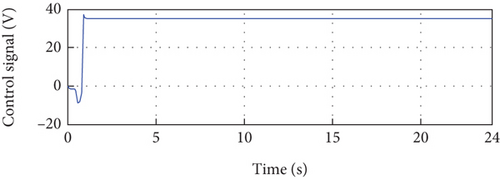
Examining Figure 10(e), we observe the developed PV power, which is the product of the PV current and voltage. This figure showcases the power output of the PV system, reflecting the combined effect of the controlled current and voltage. Figure 10(f) presents the control signal, which exhibits initial oscillations at the beginning of the simulation due to parameter adaptation. However, it stabilizes over time and reaches a steady-state value, indicating a successful control response.
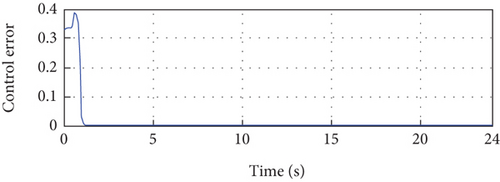
Lastly, Figure 10(b) illustrates the error between the control signal and the reference signal. Initially, this error experiences transient behavior due to parameter adaptation, but it gradually converges to almost zero, indicating the effectiveness of the control algorithm in minimizing deviations from the desired reference.
Overall, the simulation results presented in Figure 10 provide detailed insights into the behavior and performance of the PV system under the given conditions. The close tracking of the PV current and voltage to their respective references, the development of PV power, and the convergence of the control signal and error demonstrate the successful implementation of the control strategy and its ability to regulate the PV system’s performance simulation due to parameter adaptation. After that, it stabilizes at its steady-state value. Figure 10(b) depicts the error between the error control signal, which converges to almost zero after transient parameter adaptation.
To verify the effectiveness and robustness of the proposed control technique, three scenarios are considered. In the first scenario, the irradiance is varied, as shown in Figure 11(a), with a temperature fixed at a value of 25°C. The second scenario corresponds to the variation of the temperature, as shown in Figure 11(b), with irradiance set at a value of 1000 W/m2.
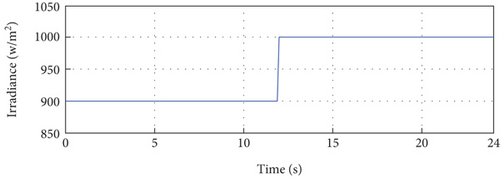
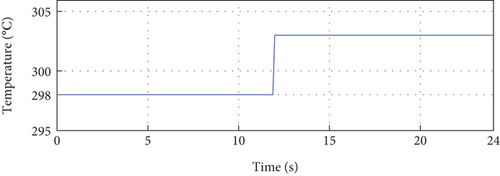
In the third scenario, we consider the variation of irradiance and temperature simultaneously, as shown in Figure 12.

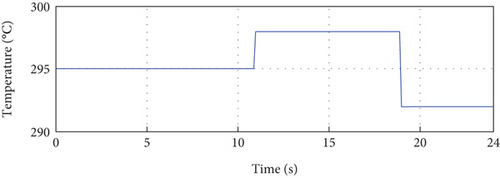
Figure 13(a) shows the PV output current and its reference. From Figure 13(a), we notice that the current IPV follows its reference perfectly despite the variation of the irradiance. This confirms that the control technique is efficient and robust against the variation of irradiance. The error between the PV-developed current and its reference is very small during the whole simulation period. The deviation at the beginning of the simulation period is due to the variation in the parameters of the identified model. In other words, as soon as we obtain the PV model parameters, the error between the PV current and its reference will vanish.
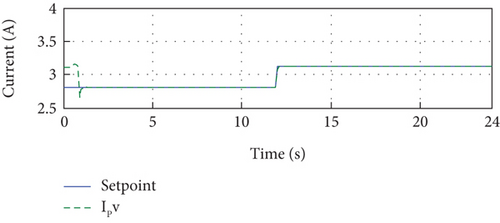


Figure 13(a) presents the comparison between the PV output current and its reference. It is evident from this figure that the current IPV consistently tracks its reference, demonstrating the effectiveness and robustness of the control technique against irradiance variations. The small error observed between the PV-developed current and its reference throughout the entire simulation period further confirms the accuracy of the control approach. The initial deviation in the error can be attributed to the variation in the identified model’s parameters. However, as soon as the PV model parameters are obtained, the error between the PV current and its reference diminishes.
Figure 13(b) displays the error between the reference and the output PV current over the entire simulation time. This error is consistently small, validating the precise tracking of the current with respect to the reference.
Additionally, Figures 13(c) and 13(e) illustrate the corresponding voltage and power, respectively, for the current depicted in Figure 13(a). These figures demonstrate that both the voltage and current closely follow their respective references, indicating accurate control of these parameters.
Furthermore, Figure 13(f) exhibits the control signal, which remains stable throughout the simulation without any oscillations. This stability of the control signal affirms the reliability and effectiveness of the proposed control method.
In conclusion, the simulation results depicted in Figure 13 provide detailed insights into the performance of the control technique. The close tracking of the PV output current to its reference, the small error between them, and the precise control of voltage and power signify the efficiency and stability of the proposed control method, even in the presence of irradiance variations.
Figure 14(a) depicts the comparison between the output of the PV system and its reference. Notably, it is evident that the PV current IPV precisely follows its reference, even in the presence of temperature variations. This observation demonstrates the robustness and efficiency of our control approach. Throughout the entire simulation period, the error between the output of the PV system and its reference remains remarkably low, approaching zero. The initial deviation observed can be attributed to variations in the parameters of the identified model. However, once the model corresponding to the real system is obtained, the control becomes perfect.
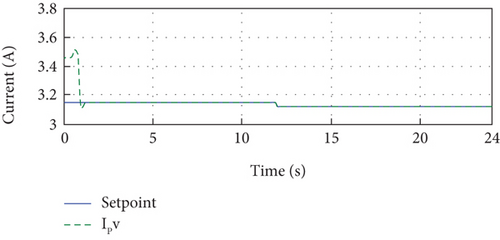
The error between the reference and the output PV current over the entire simulation period is illustrated in Figure 14(b), revealing consistently small error magnitudes. Figures 14(c) and 14(e) showcase the output voltage and power of the PV system, respectively. These figures are obtained from the control signal depicted in Figure 14(f).
In summary, the simulation results presented in Figure 14 provide detailed insights into the performance of the control approach. The precise tracking of the PV current to its reference, the minimal error observed, and the accurate control of voltage and power collectively demonstrate the robustness and effectiveness of the proposed control method, even in the face of temperature variations.
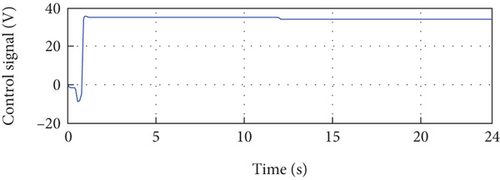
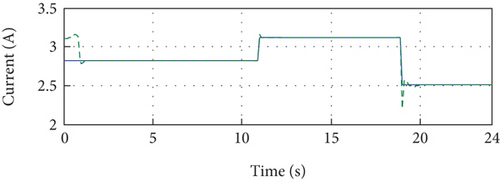
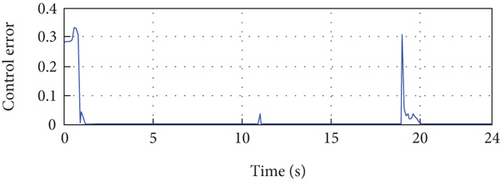
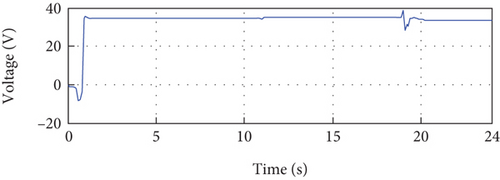
Figure 15(a) demonstrates the remarkable performance of the proposed method as the output of the PV system closely aligns with the reference, despite simultaneous variations in irradiance and temperature. This impressive tracking capability confirms the high performance of the proposed method. Furthermore, Figure 15(b) illustrates the error between the reference and the PV current output throughout the simulation period, showing consistently small error magnitudes. Figure 15(e) presents the output power of the PV system, which showcases the effectiveness of the proposed method in maintaining the desired power output.
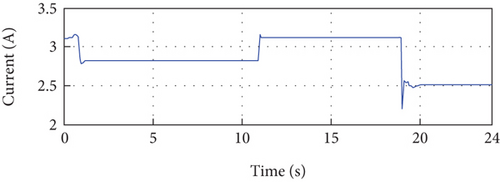
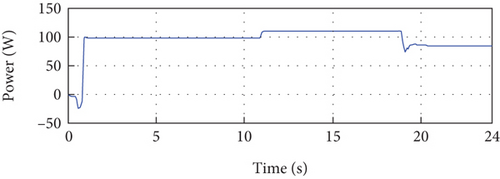
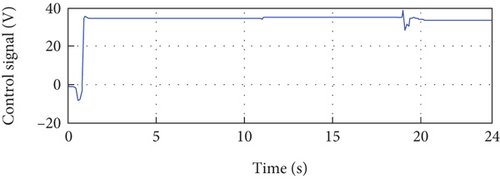
The analysis of the control signal (Figure 15(f)) reveals several important observations. Initially, oscillations are observed at the beginning of the simulation, which can be attributed to changes in the identified model parameters (a1, a2, b1, and b2). These oscillations may also be caused by initial disturbances. However, these oscillations quickly attenuate, and the control signal stabilizes. Two small oscillations are observed at instants 11 s and 19 s, which are due to changes in irradiance and temperature. Despite these disturbances, the control signal stabilizes after these two instants. This observation demonstrates the ability of the control to maintain system stability despite changes in irradiance and temperature. Overall, the analysis confirms the stability of the proposed control approach, despite the initial oscillations and variations in model parameters, irradiance, and temperature. This stability is crucial for ensuring consistent and predictable performance of the regulated system.
The simulation results obtained from the third scenario highlight the efficiency and robustness of the proposed method in handling simultaneous variations in temperature and irradiance. This observation allows us to conclude that the method presented in this paper exhibits strong resilience and performance in real-world conditions.
Overall, the simulation results presented in Figure 15 provide detailed evidence of the effectiveness and robustness of the proposed method. The accurate tracking of the PV system output, the minimal error between the output and reference, and the successful management of temperature and irradiance variations collectively emphasize the efficiency and reliability of the proposed method in practical applications.
4.1. Numerical Evaluation
Table 5 represents the obtained numerical results of the proposed method in terms of response time and current error.
| Scenarios/performance | Response time | Current error |
|---|---|---|
| Scenario 1: the irradiance is varied and the temperature is fixed at a value of 25°C | 0.8 s | 2.7736e − 007 A |
| Scenario 2: the temperature is varied and the irradiance is fixed at 1000 W/m2 | 0.8 s | 4.9307e − 007 A |
| Scenario 3: variation of irradiation and temperature simultaneously | 0.8 s | 1.4754e − 007 A |
From the results presented in Table 5, one can see that the accuracy values are very low, meaning that the error between the setpoint and the output of the system converges to zero, which means that the desired power is achieved. On the other hand, the system transient response is very satisfying because, at the beginning of the simulation period, the proposed method requires the identification of the real system, and once the system is identified, we notice the good follow-up of the maximum power.
5. Conclusion and Future Perspectives
In conclusion, this research introduces a novel and adaptive control strategy tailored for optimizing the performance of photovoltaic (PV) systems. By integrating indirect adaptive control, recursive least squares, and the RST controller, our approach effectively addresses the challenges posed by nonlinearities in PV models. The outcomes of our simulations demonstrate substantial advancements over conventional control methods, showcasing significant enhancements in power extraction efficiency, reduction of system losses, and accurate set point tracking. The incorporation of MPPT algorithms for automatic tracking of the maximum power point, coupled with a comprehensive mathematical modeling of PV cells through single-diode and dual-diode models, establishes a robust theoretical foundation for our study. The simulations conducted under varying environmental conditions, including fluctuations in irradiance and temperature, consistently validate the adaptability and effectiveness of the proposed control algorithm. Numerical results, characterized by low current errors and swift response times, underscore the precision and efficiency of our control strategy. These findings position our work as a valuable contribution to the field of renewable energy systems, offering insights into the intricacies of PV system optimization.
Looking ahead, future research endeavors will focus on broadening the scope of our control methodology. The incorporation of additional components such as converters, loads, and energy storage systems will enable a more comprehensive evaluation of our approach in diverse energy scenarios. Exploring the synergy with various renewable energy sources will further contribute to the versatility of the proposed control strategy. Moreover, ongoing efforts will be directed towards real-world implementation and validation of the developed control algorithm, paving the way for practical applications and industry integration. Continuous refinement and adaptation of the control strategy will be pursued to ensure its effectiveness in dynamic and evolving energy landscapes. In summary, this research not only advances the optimization of PV systems but also lays the groundwork for future investigations into the integration of renewable energy sources and the practical deployment of sophisticated control algorithms in real-world settings.
Nomenclature
-
- I:
-
- Current
-
- IPV:
-
- PV current
-
- Iph:
-
- Photocurrent
-
- Ish:
-
- Saturation current
-
- ID, ID1, ID2:
-
- Current of the diodes
-
- I01, I02:
-
- Diode saturation currents
-
- Is:
-
- Saturation current
-
- Icc:
-
- Short circuit current
-
- Impp:
-
- Maximum current at PPM
-
- E:
-
- Irradiation
-
- T:
-
- Temperature
-
- V:
-
- Voltage
-
- Vpv:
-
- PV voltage
-
- Vmpp:
-
- The maximum voltage at PPM
-
- Vco:
-
- Open circuit voltage
-
- Ppv:
-
- PV power
-
- Pmpp:
-
- Maximum power
-
- D, D1, D2:
-
- Diodes
-
- Rsh:
-
- Shunt resistor
-
- Rs:
-
- Series resistor
-
- Tj:
-
- Junction temperature
-
- Tjref:
-
- Reference temperature
-
- Ta:
-
- Ambiante temperature
-
- E, Es:
-
- Illumination
-
- Eref, Esref:
-
- Illumination under STC conditions
-
- Eg:
-
- Gap energy
-
- P1, P2, P3:
-
- Fixed parameters
-
- P4:
-
- Constant
-
- Esref:
-
- Reference illumination
-
- Noct:
-
- Nominal solar cell operating temperature or mode
-
- Te:
-
- Simpling period
-
- u(z):
-
- Input
-
- y(z), y(k):
-
- Output
-
- yc(z):
-
- Setpoint
-
- v(k), w(k):
-
- Random external disturbances
-
- z−d, d:
-
- Delay
-
- P(z−1):
-
- Polynomial
-
- Pa(z−1):
-
- System’s auxiliary poles
-
- Pd(z−1):
-
- System’s dominant poles
-
- A(z−1), B(z−1):
-
- Discrete polynomials
-
- ξ:
-
- Damping coefficient
-
- wn:
-
- Proper pulsation
-
- λ:
-
- Forgetting factor
-
- φ:
-
- Vector that includes the identified PV system inputs and outputs.
-
- :
-
- Vector that contains the coefficients
-
- q:
-
- Elementary charge (1.6 × 10⁻¹⁹ C)
-
- k:
-
- Constant of Boltzmann
-
- A:
-
- The ideality coefficient of a cell
-
- Ns:
-
- Number of cells linked in series and/or parallel
-
- aoc:
-
- Temperature coefficient of short circuit current
-
- Boc:
-
- Voltage coefficient.
Conflicts of Interest
The authors declare that they have no conflicts of interest.
Open Research
Data Availability
Data is available on request.


