Dihydromyricetin Alleviates Nonalcoholic Fatty Liver Disease and Its Associated Metabolic Syndrome by Inhibiting Endoplasmic Reticulum Stress in LDLR−/− Mice Fed with a High-Fat and High-Fructose Diet
Abstract
Nonalcoholic fatty liver disease (NAFLD) is a chronic liver disease. Previous studies have shown that dihydromyricetin (DHM) is beneficial for NAFLD. However, whether DHM alleviates NAFLD by inhibiting liver endoplasmic reticulum (ER) stress remains unknown. Thus, this study aimed to identify the potential roles and mechanisms of DHM. Twenty-four male low-density lipoprotein receptor (LDLR−/−) knockout mice aged 8 weeks were randomly divided into normal control, control, and DHM groups. Normal control mice were fed a normal diet (ND), and the last two groups of mice were fed a high-fat and high-fructose diet (HFD) for 12 weeks, treated with or without DHM. DHM alleviated diet-induced hyperlipidemia as early as 4 weeks after and until the end of HFD feeding. HFD increased insulin resistance, and the opposite was observed in the DHM group. Compared to the control group, the body weight of the mice and adipocyte size and weight of the retroperitoneal and epididymal fat were remarkably reduced in the DHM group. The expression of genes related to lipid metabolism, such as Acox1 and Cpt1α, was significantly upregulated. Moreover, Mttp was downregulated in the two fat sits in the DHM group. DHM alleviated diet-induced lipid deposition in the liver and decreased liver triglyceride and total cholesterol content. DHM improved liver function by inhibiting ER stress, alleviating atherogenesis, and promoting vascular remodeling. In conclusion, dihydromyricetin improved NAFLD and related insulin resistance, hyperlipidemia, and atherogenesis by inhibiting liver ER stress in HFD-fed LDLR−/− mice.
1. Introduction
Nonalcoholic fatty liver disease (NAFLD) is a chronic liver disease characterized by excessive deposition of lipids in hepatocytes, excluding alcohol and other damaging factors, and it is closely related to insulin resistance, hyperlipidemia, and obesity [1]. NAFLD can be categorized into simple fatty liver (SFL) disease, nonalcoholic steatohepatitis (NASH), and cirrhosis [2]. Moreover, NASH can lead to cirrhosis and liver cancer [3]. With the global trend of obesity and related metabolic disorders, NAFLD has become a leading cause of chronic or end-stage liver disease in developed countries and rich areas of Asia [4]. The prevalence of NAFLD in the general adult population is 13 to 32%, among which 12 to 30% are NASH; cirrhosis in 10 years is up to 25% [5].
In addition to directly causing liver cirrhosis and hepatocellular carcinoma, NAFLD/NASH can contribute to the occurrence and development of type 2 diabetes and atherosclerosis (As) [6]. Malignant tumors, As, and cirrhosis are essential factors that affect the quality of life and life expectancy of patients with NASH [6, 7]. Therefore, NASH is a new challenge in contemporary medicine, and effective prevention and therapy are urgently needed.
For patients with NASH, changing their lifestyle or taking medications is beneficial. Although antihyperlipidemic drugs such as statins and fibrates are widely used in treating NASH, toxicity and side effects (such as hepatic dysfunction and rhabdomyolysis) have restricted the use of these drugs [8]. Therefore, researchers are investigating the use of natural medicines to treat NASH and its associated metabolic syndromes. Dihydromyricetin (DHM) is a type of flavonoid isolated from Chinese traditional medicine, such as Ampelopsis grossedentata, Vitis vinifera L., Ginkgo biloba L., Prunus amygdalus Batsch, and Myrica cerifera L. [9]. In China, it has been used to treat cough, pain, pyretic fever, jaundice, and hepatitis for hundreds of years. Recently, many other potential therapeutic effects (such as ameliorating NASH-associated hyperlipidemia, insulin resistance, diabetes, As, and hepatocellular carcinoma) have been explored [10, 11]. Liu et al. demonstrated that DHM could decrease plasma low-density lipoprotein (LDL) levels and alleviate As by preventing oxidative stress, inhibiting endothelial cell injury, and forming macrophage foam cells [12]. Furthermore, recent animal studies have shown that DHM alleviates NAFLD in hamsters by regulating multiple metabolic pathways [13]. In addition, DHM can alleviate insulin resistance by inhibiting inflammation through the phospholipase C-CaMKK-AMPK signaling pathway or by upregulating insulin receptor substrate-1 tyrosine phosphorylation [11, 14].
Excessive endoplasmic reticulum (ER) stress can affect tumor cells proliferation. A few studies have explored the effects of DHM on ER stress inhibition for the prevention and treatment of cancers [15]. In addition, ER stress aggravates NAFLD/NASH and related metabolic disorders. However, whether DHM alleviates NAFLD-related fatty liver disease, insulin resistance, and As by inhibiting ER stress in the liver has not yet been studied.
To elucidate this, we used a mouse model of NAFLD/NASH-associated metabolic disorders using high-fat and high-fructose (HFD) diet-fed LDL receptor knockout (LDLR−/−) mice to evaluate the effect of DHM on plasma lipids, fatty liver, insulin sensitivity, and As and to investigate its possible mechanism. We observed that suppressing liver ER stress using DHM could alleviate NAFLD/NASH and related hyperlipidemia, insulin resistance, adipose tissue expansion, and atherogenesis.
2. Materials and Methods
2.1. Materials
DHM (CAS: 27200-12-0) was purchased from Jiangsu Enming Bioengineering Technology Co. Ltd., with a 98% purity confirmed by using high-performance liquid chromatography. DHM was dissolved in a 0.5% sodium carboxymethyl cellulose (CMC-Na, Sigma-Aldrich) aqueous solution to a final concentration of 20 mg/mL.
2.2. Animals, Diets, and Experimental Designs
Twenty-four male LDLR−/− mice aged 4 weeks were purchased from Beijing Vital River Laboratory Animal Technology Co., Ltd. All animals were maintained on a 12 : 12-h light-dark cycle and fed ad libitum with a normal diet (ND) or a high-fat and high-fructose diet (HFD) (20% fat, 0.5% cholesterol, and 35% fructose). All animals were fed a normal diet for 4 weeks. The mice were then challenged with ND or HFD for 12 weeks, and their body weight were recorded weekly. The mice were randomly divided into three groups of eight mice each: normal control (ND), control (HFD), and DHM (HFD + DHM) groups. The control and DHM groups’ animals were fed on HFD, and the normal control group’s mice were fed on ND. DHM was dissolved in a suspension using 0.5% CMC-Na. The DHM group intragastrically received 250 mg/kg body weight of DHM daily [16], and the other two groups were intragastrically administered the same volume of 0.5% CMC-Na after being fed on ND or HFD. The food intake was recorded weekly. At the end of the HFD period, all mice were anesthetized with 80 mg/kg pentobarbital sodium (Sigma-Aldrich). Tissues and thoracic aortas were harvested. Tissues for western blot and real-time quantitative PCR (qPCR) were stored at −80°C, while those for morphological detection were soaked in paraformaldehyde until analysis. All animal experiments in this study followed the Principles of Laboratory Animal Care (NIH publication no. 85Y23; revised, 1996), and the experimental protocol was approved by the Animal Care Committee of Hebei University of Chinese Medicine Health Science Center.
2.3. Blood Analysis
Blood samples were collected from the orbital vein to measure baseline glucose levels after fasting for 14 h from mice. The mice were subjected to glucose (2 g/kg body weight) at 10 weeks on HFD or insulin (0.75 IU/kg body weight; Humulin) at 11 weeks on HFD by intraperitoneal injection. Blood samples were collected at 15, 30, 60, and 120 min (90 min for the insulin tolerance test) after glucose or insulin injection. An enzymatic kit (BioSino Bio-Technology and Science Inc., China) determined blood glucose levels. Blood samples were collected at 0, 4, 8, and 12 weeks of HFD for the determination of plasma total cholesterol (TC) and triacylglycerol (TG); TC, TG, LDL cholesterol (LDL-C), aspartate aminotransferase (AST), and alanine aminotransferase (ALT) were measured using an enzymatic kit (BioSino Bio-Technology and Science Inc., China). Insulin levels were determined using an ELISA kit (Excell, China). Blood samples for AST and ALT measurements were collected at the end of the HFD period. An enzymatic method was implemented to determine high-density lipoprotein cholesterol (HDL-C) levels, followed by precipitation of apolipoprotein B.
2.4. Histological Analysis
The hearts and livers were optimal cutting temperature (OCT) compound embedded and frozen at −20°C. The liver and aortic root sections were obtained by a continuous frozen section at a thickness of 7 μm. The sections were then fixed and stained with Oil Red O, and lipid deposition was analyzed using ImageJ software. The liver and adipose tissues were embedded in paraffin, and 4-μm tissue sections were obtained. The sections were stained using hematoxylin and eosin (HE) staining. ImageJ software was used to measure the area of the adipocytes (n = 200 adipocytes per animal and n = 5 animals per group).
2.5. RNA Isolation and Quantitative Real-Time PCR
Tissues were homogenized and extracted using TRIzol reagent (Invitrogen, Carlsbad, CA, USA). Chloroform extraction, isopropyl alcohol precipitation, and ethanol washing were performed, and total tissue RNA was obtained. First-strand cDNA was generated using an RT kit (Invitrogen). Quantitative real-time PCR (qRT-PCR) was performed using primers listed in Table 1. The comparative CT method was used for the relative quantitation of gene expression in the samples, which was normalized to GAPDH.
| Gene | Forward | Reverse |
|---|---|---|
| Gapdh | TGATGACATCAAGAAGGTGGTGAAG | TCCTTGGAGGCCATGTAGGCCAT |
| Pparg | GACCACTCGCATTCCTTT | CCACAGACTCGGCACTCA |
| Cetpa | GTTAGCCATGTGGTAGGAGACA | CCCAGCCGTTAGTGAAGAGT |
| Fasn | GGGTCTATGCCACGATTC | GTGTCCCATGTTGGATTTG |
| Acc1 | CTCCCGATTCATAATTGGGTCTG | TCGACCTTGTTTTACTAGGTGC |
| Scd1 | CGCTGGCACATCAACTTCAC | AGGAACTCAGAAGCCCAAAGC |
| Dgat2 | GCGCTACTTCCGAGACTACTT | GGGCCTTATGCCAGGAAACT |
| Atgl | ATGTTCCCGAGGGAGACCAA | GAGGCTCCGTAGATGTGAGTG |
| Hsl | GATTTACGCACGATGACACAGT | ACCTGCAAAGACATTAGACAGC |
| Cd36 | GGAGCCATCTTTGAGCCTTCA | GAACCAAACTGAGGAATGGATCT |
| Ppara | GGGCTTTCGGGATAGTTG | ATTGGGCTGTTGGCTGAT |
| Pgc1a | TATGGAGTGACATAGAGTGTGCT | GTCGCTACACCACTTCAATCC |
| Acox1 | GTACCAGCGTCGGGGATTG | AAAGGCTCAGGATGCCCTCG |
| Cpt1a | CTCCGCCTGAGCCATGAAG | CACCAGTGATGATGCCATTCT |
| Mttp | ATACAAGCTCACGTACTCCACT | TCTCTGTTGACCCGCATTTTC |
2.6. Western Blot Analysis
Radioimmunoprecipitation assay buffer was used to homogenize liver tissues, and the protein content was measured using a bicinchoninic acid protein assay kit (Pierce, Rockford, IL). Antibodies against Akt, phospho-Akt (Ser473) (Cell Signaling Technology, Danvers, MA, USA), CHOP, PDI, and β-actin (Proteintech, Wuhan, China) were used. ImageJ image analysis software was used to quantify and analyze protein bands. Arbitrary densitometry units were quantified and expressed as mean ± SEM.
2.7. Lipid Deposition Analysis of Liver Tissues
Approximately 100 mg of liver tissues was homogenized in 1 mL of cold PBS. A mixture of chloroform and methanol (CHCl3 : CH3OH = 2 : 1) was used for lipid extraction. Then, 1 mL 3% Triton X-100 was used to dissolve liver lipids after drying under nitrogen. The TG and TC levels were measured using the enzymatic methods described above.
2.8. Statistical Analysis
All data were represented as the mean (SEM). Statistical comparison between groups was carried out using a one-way ANOVA. A P value <0.05 was considered statistically significant. All analyses were performed using the GraphPad Prism software (GraphPad Software).
3. Results
3.1. Diet-Induced Hyperlipidemia Was Alleviated in the DHM-Treated LDLR−/− Mice
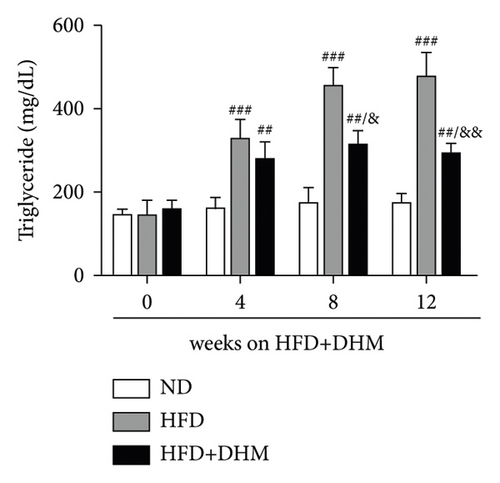
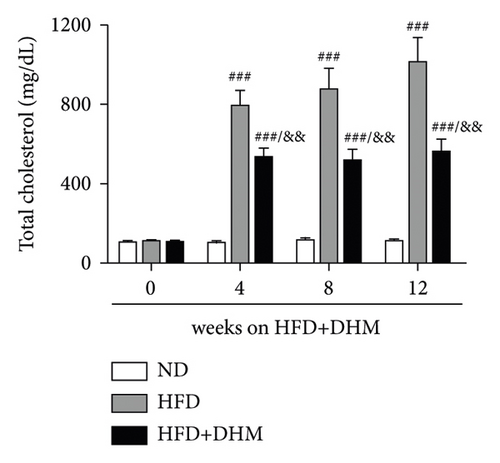
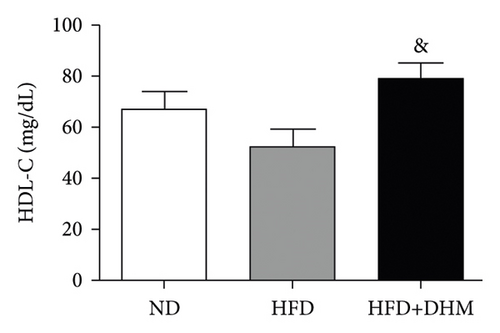
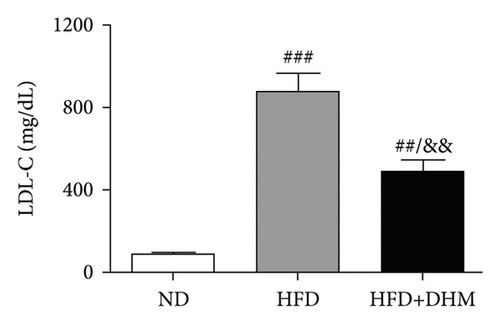
A high-fat diet can induce metabolic disorders such as hyperlipidemia and insulin resistance. Therefore, we determined the plasma levels of TC and TG. As shown in Figure 1, hyperlipidemia was induced in the control group (HFD) compared to that in the normal control group (ND). In addition, plasma TC and TG levels were significantly lower in the DHM group (HFD + DHM) than those in the control group (Figures 1(a)) and 1(b). HDL-C, the major antiatherosclerotic lipoprotein, was measured. The results indicated that the plasma HDL-C level had increased. At the same time, LDL-C was significantly reduced in the DHM group compared to that in the control group (Figures 1(c) and 1(d)).
3.2. Diet-Induced Insulin Resistance Was Alleviated in the DHM-Treated LDLR−/− Mice
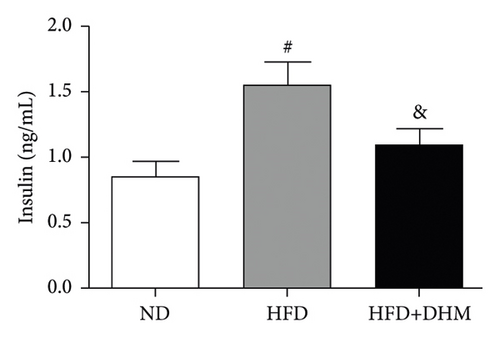
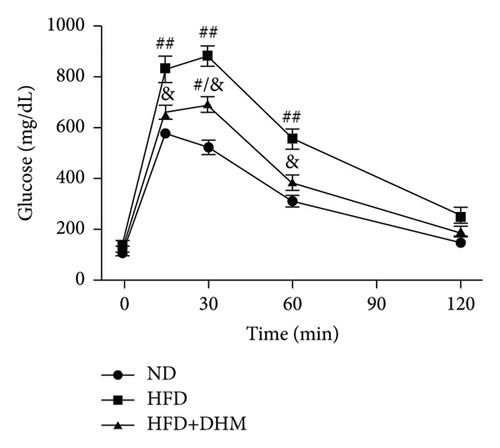
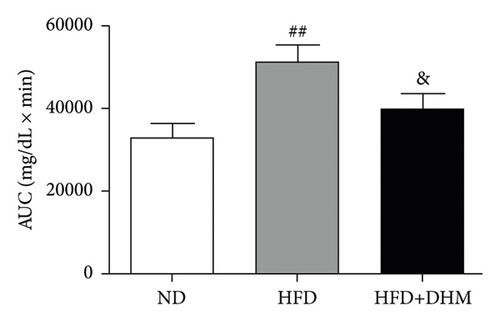
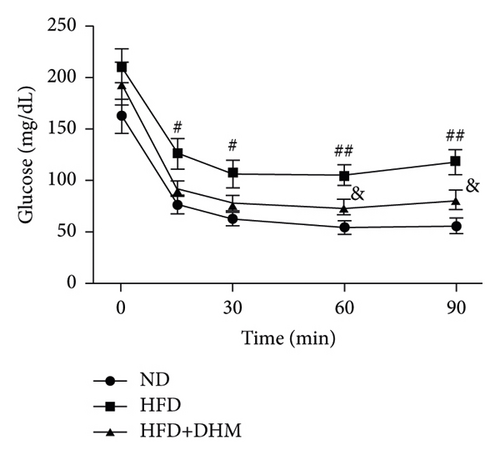
Plasma glucose levels were measured to investigate the role of DHM in insulin resistance. Insulin resistance in mice was significantly aggravated in the HFD group compared to that in the ND group (Figure 2). No significant differences in plasma glucose levels were observed among the three groups (Figure 2(a)). However, glucose tolerance was remarkably improved in the DHM group compared to that in the control group (Figures 2(c) and 2(d)). Insulin tolerance test (ITT) and insulin levels were analyzed to determine the role of DHM in insulin sensitivity in HFD-fed mice. Results show that insulin levels decreased, and insulin sensitivity strikingly improved in the DHM group (Figures 2(b), 2(e), and 2(f)).


3.3. Diet-Induced Visceral Obesity Was Alleviated in the DHM-Treated LDLR−/− Mice
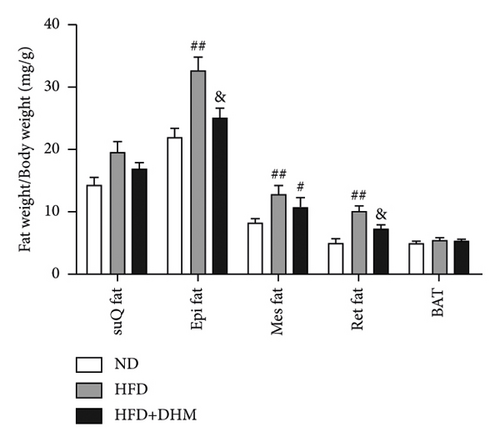
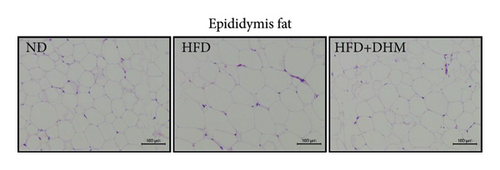
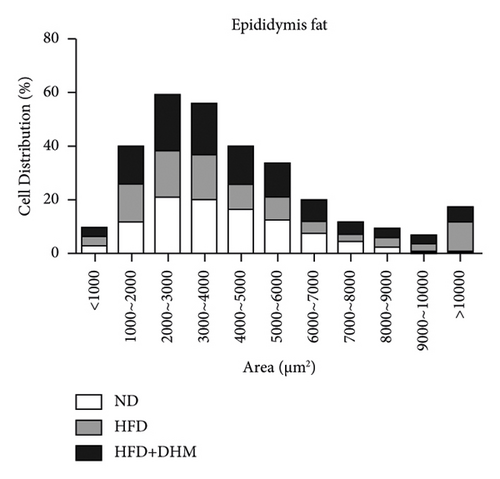
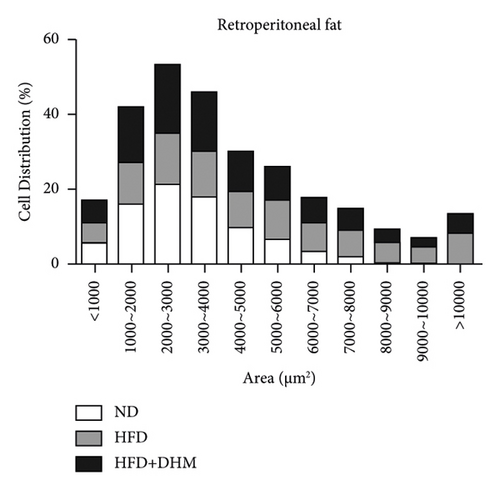
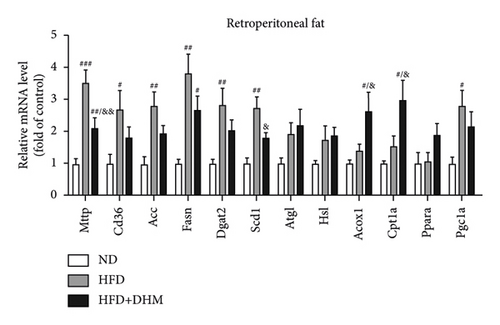
HFD led to body weight gain and an increase in the adipose tissue (Figure 3). However, it did not significantly affect the food intake of mice compared to ND (data not shown). During 12 weeks of HFD, body weight was significantly reduced in the DHM group compared to that in the control group (Figure 3(a)). Moreover, visceral fat (such as retroperitoneal fat and epididymis fat) was significantly lower in the DHM group than that in the control group (Figure 3(b)). H&E staining and quantitative results of the adipocyte area of the two fat sections showed a slight decrease in adipocyte size in the DHM group compared to that in the control group (Figures 3(c)–3(f)). Further investigation by qPCR suggested that genes associated with lipid synthesis (Scd1) and lipid transport (Mttp) were downregulated, and genes related to fatty acid oxidation (Acox1 and Cpt1α) were upregulated in the DHM group compared to those in the control group (Figures 3(g) and 3(h)). In contrast, no significant differences were observed in lipolysis (Atgl and Hsl). Thus, our data demonstrated that DHM could decrease lipid synthesis, increase lipid catabolism, and prevent obesity in LDLR−/− mice.



3.4. Diet-Induced Fatty Liver Was Alleviated in the DHM-Treated LDLR−/− Mice
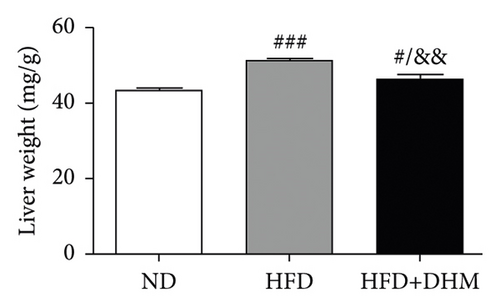
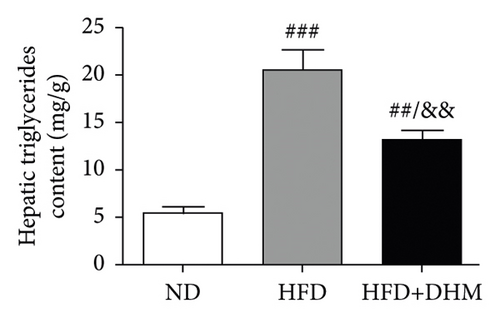
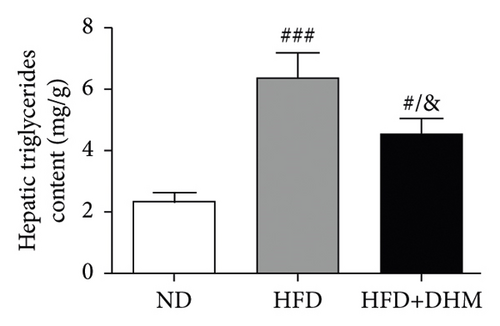
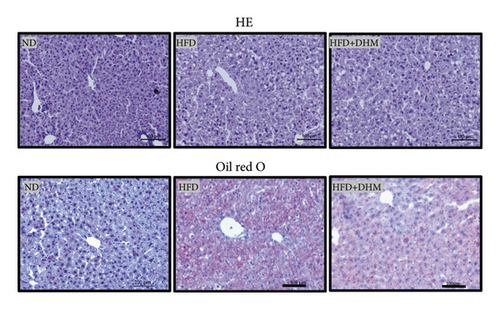
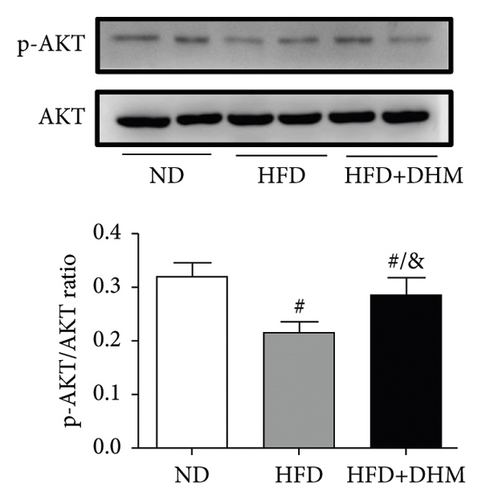
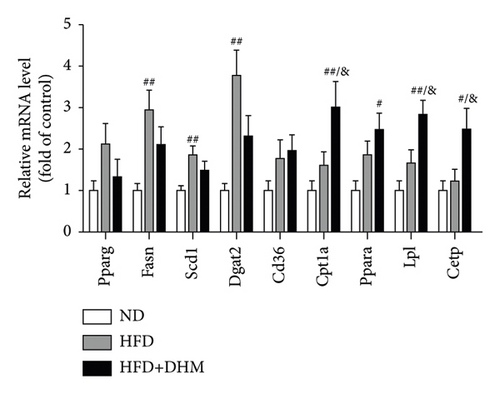
When the mice were treated with DHM, lipid levels were reduced (Figure 1). Elevated circulating lipid levels led to lipid deposition in the liver. Therefore, we assessed lipid deposition in the liver. Compared with the control group, the liver weight, TG, and TC contents were significantly lower in the DHM group mice (Figures 4(a)–4(c)). The decrease in liver lipid deposition was further confirmed by H&E and Oil Red O staining of liver tissue sections in the DHM group compared to that in the control group (Figure 4(d)). p-Akt, an insulin-sensitive organ, has been detected in the liver. A HFD significantly downregulated the expression of p-Akt, which was rescued by DHM (Figure 4(e)). Then, the expression of genes related to lipid metabolism was detected by qPCR. As shown in Figure 4(f), the mRNA levels of fatty acid oxidation (Cpt1α), lipolysis (Lpl), and cholesterol ester transport (Cetp) were significantly upregulated, and this indicates that lipolysis and lipid transport increased in the DHM group.
3.5. Diet-Induced Liver ER Stress Was Alleviated in the DHM-Treated LDLR−/− Mice
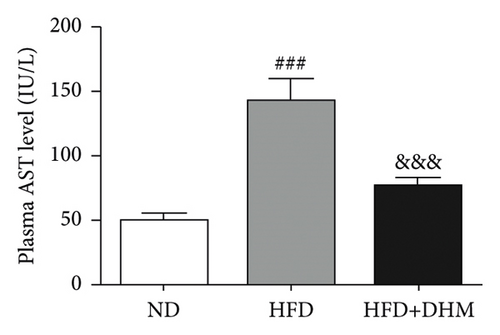
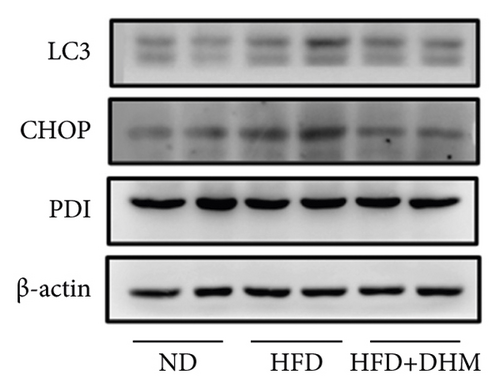
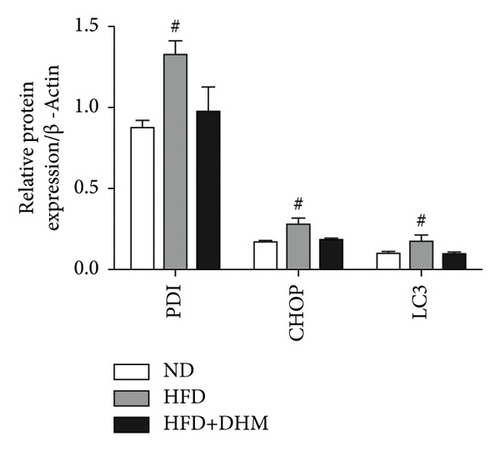
Liver function is influenced by lipid deposition. We then measured the plasma levels of aminotransferase. The results showed that the plasma levels of AST and ALT were significantly decreased when treated with DHM compared to the control group (Figures 5(a) and 5(b)). ER stress in the liver was moderately alleviated, as detected by western blot analysis of CHOP (Figures 5(c) and 5(d)). Therefore, our data suggest that ER stress in the liver was moderately alleviated in the DHM group.

3.6. Diet-Induced Atherogenesis Was Alleviated in the DHM-Treated LDLR−/− Mice
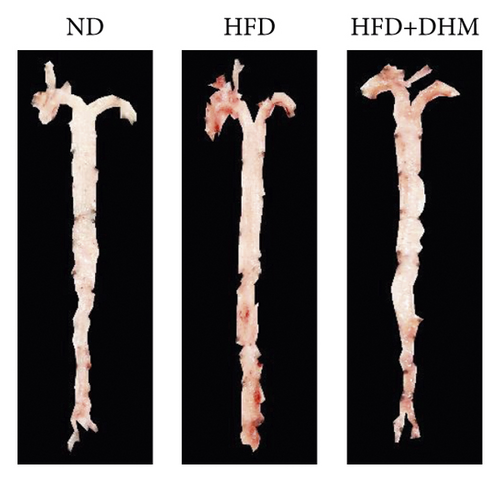
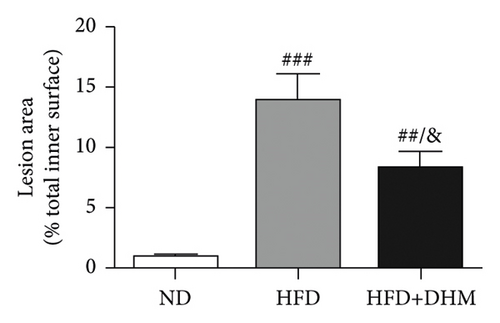
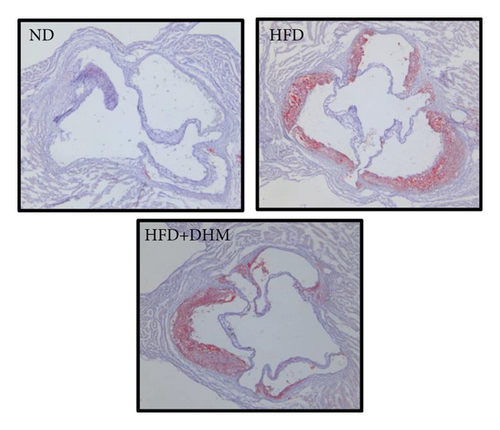
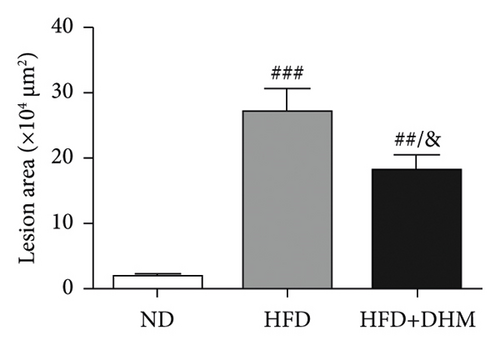
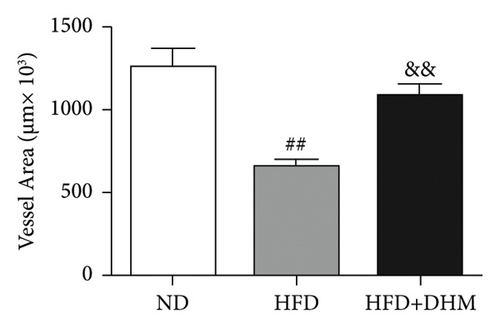
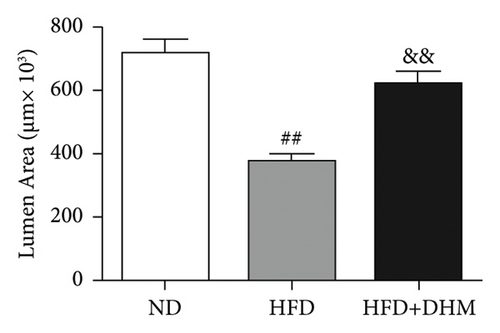
Atherogenesis could be aggravated in LDLR−/− mice fed on HFD. Thus, we examined atherogenesis in the three groups of mice. A significant decrease in the As area, visualized by Oil Red O staining, was observed in the aortas of the DHM group after 12 weeks of HFD feeding (Figures 6(a) and 6(b)) and in the aortic root, compared with that in the aortas of the control group (Figures 6(c) and 6(d)). Moreover, the vessel and lumen areas in the aortic root were significantly increased in the DHM group (Figures 6(e) and 6(f)). These data suggest that DHM could alleviate atherogenesis and increase vessel and lumen areas.
4. Discussion
In this study, we explored the role of dihydromyricetin in NAFLD/NASH and its related insulin resistance, hyperlipidemia, and subsequent atherogenesis on HFD feeding in LDLR−/− mice. Compared with the control group, we observed that (1) DHM significantly improved glucose tolerance and insulin sensitivity in mice; (2) the plasma levels of triglyceride, cholesterol, and visceral fat weight were significantly decreased; (3) liver lipid deposition was ameliorated, and liver cholesterol and triglyceride contents were significantly decreased; (4) liver function was dramatically improved, and ER stress was significantly suppressed; and (5) atherosclerotic lesions were significantly decreased in the DHM group.
The weights of retroperitoneal and epididymis fat in the DHM group decreased slightly (Figure 3). The downregulated genes related to TG synthesis and lipid transport and reduced adipocytes size in retroperitoneal fat and epididymis fat suggested that DHM could reduce the expansion of visceral fat by promoting fat mobilization and the β-oxidation of fatty acids. NAFLD/NASH is typically characterized by the ectopic deposition of lipids in the liver, indicating an elevated liver TG content. In the DHM group, the liver TG content was significantly reduced, mainly due to enhanced oxidative metabolism, and this ultimately resulted in decreased lipid deposition in the liver (Figure 4). The expression of genes in the liver related to cholesterol reverse transport (Cetp) was upregulated, resulting in a moderate decrease of liver cholesterol content. Akt is a key downstream molecule of the insulin signaling pathway and plays an essential role in regulating glucose and lipid metabolism. Akt phosphorylation promotes glycogenesis and glycolysis [17]. Moreover, Akt regulates the sterol regulatory element-binding transcription factor (SREBP-1c) to influence lipogenesis [18]. DHM upregulated p-Akt levels in the liver, suggesting that insulin signaling was moderately activated in the DHM group. Moreover, Akt activation may affect cholesterol metabolism via SREBP-1c. These results suggest that DHM inhibits liver lipid deposition by promoting liver lipid oxidation and cholesterol metabolism.
Ectopic lipid deposition in the liver induces fatty liver with an increase in plasma total cholesterol, triglyceride, and LDL-C levels and affects the function of the liver, resulting in elevated plasma levels of AST, ALT, and bilirubin and a decrease in total protein and albumin [1]. Several studies have shown that DHM plays a hepatoprotective role in mice fed with a high-fat diet, with reduced plasma lipid levels (such as TG, TC, and LDL-C) and transaminases of ALT or AST for instance [12, 19, 20]. In our study, the data showed that DHM reduce the plasma lipid levels and improve liver function, which is consistent with the results of previous studies.
Several studies have confirmed that a high-fructose diet can induce NASH and associated metabolic disorders [21]. Therefore, high-fructose diets are widely used in animal models of NASH and associated metabolic disorders. Unlike wild-type rodent animals, which hardly develop hyperlipidemia and As even though fed on a high-fat diet, LDLR−/− mice are naturally prone to hypercholesteremia and As. They can develop hyperlipidemia and As when challenged with high-fat diet feeding, just like hypercholesteremic patients. Therefore, we investigated the role of DHM in NASH and related metabolic disorders induced by a high-fat and high-fructose diet in LDLR−/− mice. Our results suggest that DHM could significantly alleviate insulin resistance induced by chronic HFD feeding, as confirmed by plasma insulin levels, GTT, and ITT. In addition, plasma lipid levels (measured using enzymic method) decreased. These results suggested that DHM can ameliorate NASH and associated hyperlipidemia, which is consistent with previous results.
The oral bioavailability of DHM is not high; however, it has obvious tissue distribution [22]. After oral administration, the concentration of DHM in the liver is approximately 20 times higher than that in the plasma [23, 24]. Thus, the amelioration of NAFLD by DHM may be related to DHM enrichment in the liver. Previous studies suggested that DHM could restrain NAFLD in vivo through several signaling pathways, such as NFκB/ p53, SIRT3, and AMPK/mTOR signaling and so on. However, the signaling pathway by which DHM alleviates NAFLD in LDLR−/− mice fed on HFD was not explored in this study, which was the first limitation of our study.
The ER is an evolutionarily conserved organelle with a strong homeostatic system. However, many factors lead to an imbalance in ER homeostasis, resulting in ER stress. Stress caused by endoplasmic reperfusion injury, oxidative stress, and physicochemical damage can lead to excessive protein synthesis in cells that exceed the protein-folding capacity, resulting in ER calcium metabolism disorders, lecithin synthesis disorders, and ER stress [25]. Unfolded protein response reduces unfolded protein load under ER stress conditions. However, in situations where ER homeostasis is disrupted due to severe or prolonged stress or unusual challenges (such as energy or nutritional overload and inflammation), ER stress triggers responses that lead to cell death caused by apoptosis [26].
High circulating lipid and glucose levels increase ER stress. Dyslipidemia, NASH, and insulin resistance may result from dyslipidemia-dependent ER stress [27]. Several studies have confirmed that DHM can reduce ER stress in tumor tissues or cells through various pathways [15]. The liver, the main organ of metabolism, is important for maintaining metabolic homeostasis in the whole body. Therefore, the inhibition of ER stress in liver tissues is beneficial for alleviating NAFLD/NASH and related metabolic disorders [28]. Our results showed that DHM downregulated CHOP levels (Figure 5), suggesting that DHM could improve NASH by reducing ER stress in the liver. In eukaryotic cells, there are three ER stress response pathways: PKR-like eukaryotic initiation factor 2α (eIF2α) kinase (PERK), inositol-requiring enzyme 1 (IRE1), and activating transcription factor 6 (ATF6). CHOP is a vital molecule downstream of the PERK signaling pathway, and its downregulation indicates the amelioration ER stress in the liver. However, IRE1α (an important UPR protein responsible for the splicing of X-box binding protein1 for ER homeostasis) and ATF6 were not determined in this study which is the second limitation. Thus, further studies are required to confirm whether DHM influences these two proteins.
In DHM-treated mice, plasma HDL-C levels were elevated, which may be related to the decrease in the lesion area of As because HDL-C is antiatherosclerotic cholesterol. Moreover, DHM can interact with the gut microbiota to improve As [29]. Aortic remodeling plays a vital role in the repair of vascular injury and atherosclerosis [30]. However, no studies have explored the effects of DHM on aortic remodeling. In our study, mice were subjected to HFD and DHM treatments to determine the role of DHM in preventing As aggravation and aortic remodeling. A reduction in the area of atherosclerotic lesions was observed in the mice treated with DHM. Moreover, the aortic root vessel and lumen areas were significantly enlarged compared to those in the control group, suggesting that DHM might promote aortic remodeling and increase effective blood flow. Plaque stability is closely associated with acute stroke and other cardiovascular and cerebrovascular diseases. Unstable plaques are characterized by more macrophages and foam cells, larger necrotic centers, and thinner fibrous caps. However, how DHM promotes vascular remodeling and whether DHM could improve plaque stability were not determined in this study and needed to be further explored, which is the third limitation of our study.
5. Conclusions
In conclusion, DHM, a compound isolated from many Chinese herbs, can improve NAFLD/NASH and related hyperlipidemia, adipogenesis, and insulin resistance by reducing ER stress in the liver, promoting vascular remodeling, and significantly preventing the formation of As.
Conflicts of Interest
The authors declare that they have no conflicts of interest.
Authors’ Contributions
L. L. and J. Z. conceptualized the study; L. L., Q. S., H. L., and Y. W. performed data curation; L. L. and H. L. performed formal analysis; L. L. and J. Z. were responsible for funding acquisition; J. Z. investigated the data; L. L. and Y. W. contributed to methodology; J. Z. was involved in study supervision; L. L. prepared the original draft; Q. S., H. L., W. Y., and J. Z. reviewed and edited the manuscript; and Lin Liu, Quan Shen, Yan Wang, and Hong Li contributed equally to this work.
Acknowledgments
This research was funded by the Science and Technology Department of Hebei Province, 223777149D, and Natural Science Foundation of Hebei Province, H2020423061, to J. Z.; Science and Technology Project of Hebei Education Department, QN2022092, to L. L.; Hebei Traditional Chinese Medicine Administration, 2022080, to L. L. and, 2017009, to J. Z.; Medical Science Research Project of Hebei Provincial Health Commission, 20231564, to L. L.; and Dr. Fund of Hebei University of Chinese Medicine, BSZ2021007, to L. L.
Open Research
Data Availability
The data used to support the findings of this study are available from L. L. and J. Z upon request.


