New Analysis of the Seasonal Variation of the Critical Frequencies foF2 by a Proposed Formula of the Power of Solar Radiation
Abstract
The present article is a new analysis of the seasonal variation of the critical frequencies foF2 by establishing a formula as a tool. Thus, from the formula of the power of solar radiation proposed, by its two components, one the power linked to the angles of attack of the solar rays and the other the power imparted to the Earth-Sun distance, we will understand the asymmetries foF2 peaks at the equinoxes and the various winter and semiannual anomalies. By the power component imparted to the contribution of sunspots, we will understand the reversal of the maximum peak during the growth and waning phase of the solar cycle. Finally, by the power component linked to the transport mechanism and the reinforcement by the solar wind of the ionization, we will understand the why of the noninversion of the maximum of the peaks.
1. Introduction
This paper is an approach that takes into account results from in situ measurements of the solar cycle 21 of the Ouagadougou and Dakar stations and the solar cycle 20 of the Djibouti station. The long-term objective is to find a formula for the temporal variation of the solar radiation power PS(t) and the critical frequencies foF2(t) which on the one hand would reproduce as well as possible the variations of the critical frequencies given by in situ measurements and on the other hand would be able to explain the main characteristics [1, 2]. To do this, this article will first present the curves of the in situ measurements of the stations of Ouagadoudou, Dakar, and Djibouti and the curves resulting from the proposed formula of PS(t). The second step in the discussion will be to show the process of elaboration of the solar radiation power PS(t) and by ricochet foF2(t).
2. Data
The data used are from the station of Ouagadougou (latitude 12.5° N, longitude 358.5° E) and Dakar (latitude 14.8° N, longitude 342.6° E) of solar cycle 21 during the period from 1975 to 1984 [3] and the Djibouti station (latitude 11.5° N, longitude 42.8° E) of solar cycle 20 during the period from 1964 to 1974 [3]. If for Djibouti we have considered the solar cycle 20, it is because all the data of the solar cycle 21 of this station are not available.
3. Materials and Methods
The Excel 2010 software is the “hardware” used to build the different curves. The method consists of using the data of the in situ measurements to build the graphs and in a second time to establish the formula of the power of the solar radiation and also to obtain graphs. After that observed profiles, we proceed to comments or explanations to justify the validity of the formula for the variations in the power of solar radiation that we have proposed.
4. Discussion
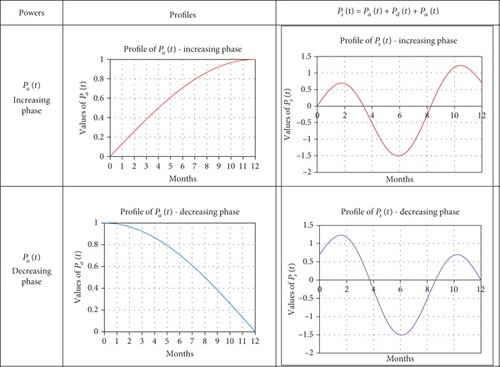
The proposed formula of PS(t) would be based on the observation (Figure 1) of variations in the powers of solar radiation Pα(t), Pd(t), and Pa(t) (Figure 1). These different powers have been used in our previous articles [4, 5] to explain the different characteristics observed in the seasonal variation of foF2. Thus, as a brief reminder in order to be better understood, Pα(t) is the part of the power induced by the variation of the angles, Pd(t) induced by the variation of the distance of the Earth from the Sun, and finally Pa(t) the part of the power which represents the contribution of sunspots.
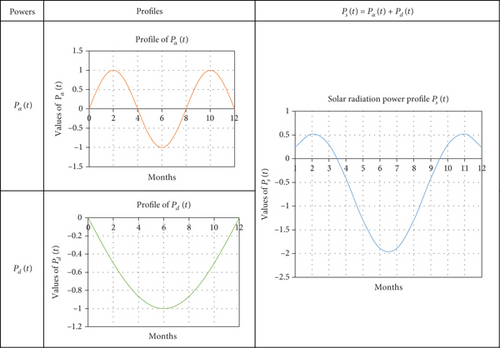
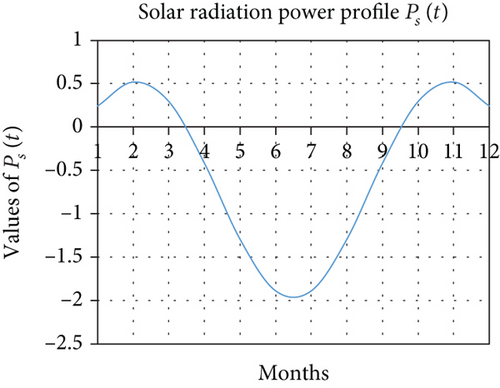
It is thus the effect of this power PS(φ, Ф) linked to the station if it is not zero that allows on the one hand to keep the profile given by PS(t) and on the other hand to no longer observe the negative values that would be given by the only representation of PS(t) that would rather mean that PS(t) would oscillate around an average value PS(φ, Ф) = 0. For example, if we consider the Ouagadougou station and then oscillate PS(t) around this average value given by the set of values, we obtain the following graph (Figure 2).
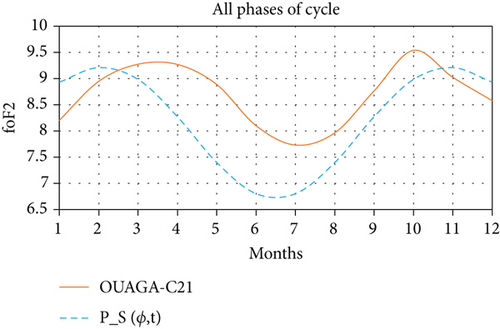
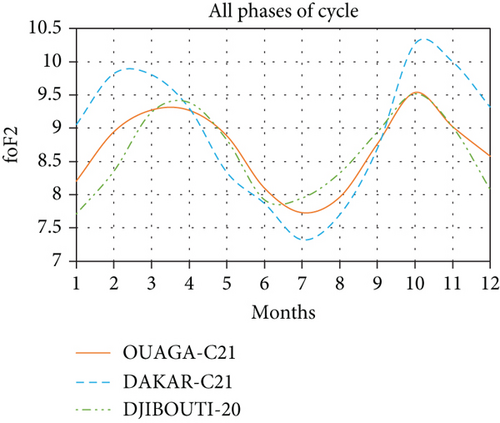
Thus, we see a near agreement in the variation of the two curves. Indeed, while the peaks reflecting the equinoctial asymmetry are observed for the in situ measurements in the months of March and October of 9.27 MHz and 9.53 MHz, respectively, those given by the simulation of PS(φ, Ф, t) are observed in the months of February and November of 9.21 and 9.22, respectively. Also, the lowest minimum is observed in the month of July both for in situ measurements of critical frequencies at 7.73 MHz and that given by the power of solar radiation at 6.80. The concordances observed with the Ouagadougou station are also observed if we consider the Dakar or Djibouti stations as shown in Figures 3(a) and 3(d). Thus, if the proposed formula reproduces the main characteristics as possible, would it also be able to reproduce the effects of sunspots on the variation of critical frequencies? Or, taking into account the very good correlation cycle of the sunspots and variation of the critical frequencies [6], one observes the strong tendency to the inversion of the maximum of peak during the phases of growth and decrease of the cycle of the sunspots.
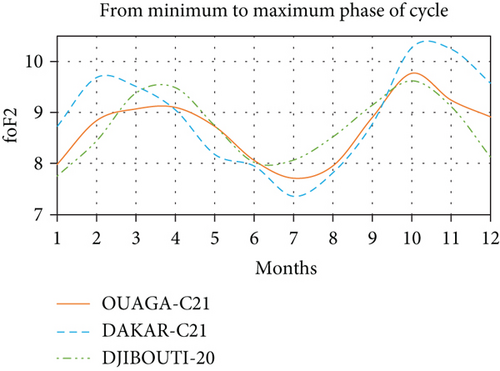
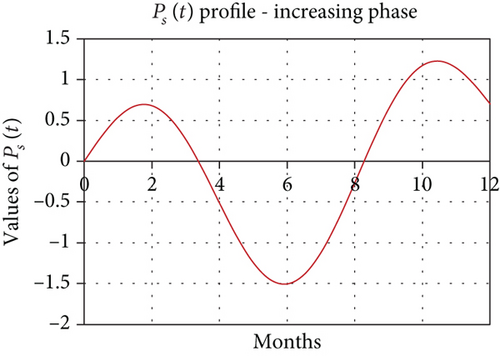
where Pa0 and Ta are counted as half an alternation, respectively, the amplitude and period of the additional power. The expected effects follow. Indeed and for example, if we consider the station of Dakar during the phase of growth of the minimum to the maximum of phase we obtain by also making oscillate Ps(t) around the average value considered as PS(φ, Ф) given by the set of values, we obtain the following graph (Figure 5).
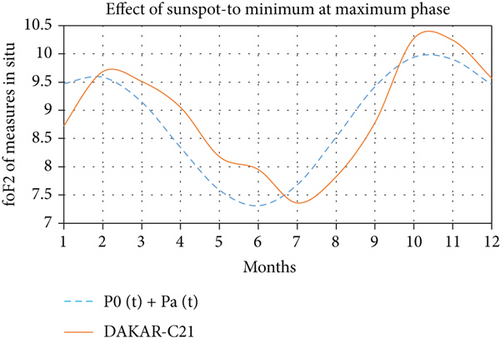
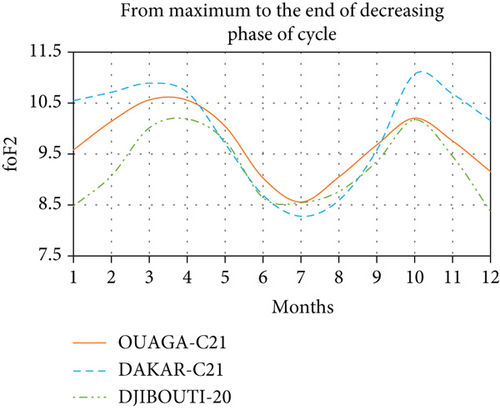
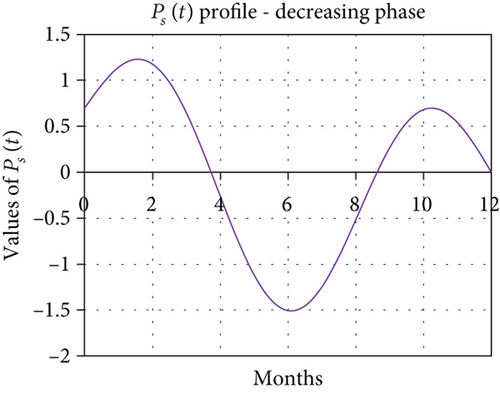
We also notice a quasiconcordant reproduction of the curve of variation of critical frequencies of the in situ measurements of the Dakar station to that given by the simulation of PS(φ, Ф, t). The equinox peaks are observed at the same period in February and October but at even higher amplitudes of 9.68 MHz and 10.27 MHz, respectively, for the in situ measurements and 9.59 and 9.94, respectively, for those given by the simulation of PS(φ, Ф, t). However, the lowest minimum is observed in July for the in situ measurements of critical frequencies at 7.36 MHz while that given by the simulation of the power of solar radiation at 7.31 in June. The concordances observed with the station of Dakar are also observed if we consider the stations of Ouagadougou or Djibouti as shown in Figures 3(b) and 3(e). For the decrease relating to the periods of the maximum of phase until the end of the phase of decrease, one notices by taking, for example, the station of Ouagadougou on the one hand a quasiconcordance from the point of view profile with the power of the solar radiation and on the other hand the effects of sunspots during this phase of decay as the following graph (Figure 6).
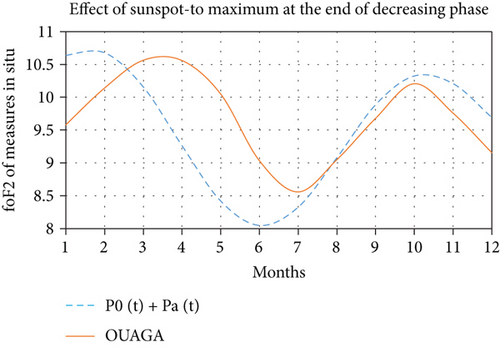
The amplitudes are large, and we note an inversion of the period of the peak maximum. Indeed, during the phase of growth of the minimum to the maximum of phase, the peaks of the equinoxes were observed in April at 9.10 MHz and in October at 9.77 MHz, whereas during the phase of decline, the peaks of the equinoxes are recorded in March at 10.56 MHz and 10.20 MHz in October. It is the same with the simulation of the solar radiation power where we note an inversion of the period of the maximum of peak. The month of February recorded the highest peak during the decay phase while it was recorded in November during the growth phase. However, we consider the Djibouti station, where Ps(t) has also been oscillated around the average value considered as PS(φ, Ф) given by all the values in the figures of the following graph (Figure 7).

We note to this effect a quasiconcordance even if it is not very pronounced given the fact that the peaks observed during the equinoxes for the in situ measurements of the station of Djibouti are almost identical to 10.19 MHz in April against 10.17 in October while it is not the case with the simulation of the power of solar radiation or the difference is much more noticeable. It could be observed for the Dakar station (Figures 3(c) and 3(f)) that even if there was no inversion of the period of the maximum peak, the gap between the two peaks is strongly reduced showing this strong propensity to peak inversion. It is therefore appropriate to recognize that the inversions announced by the sunspots of the maximum peak in favor of the autumn peak during the growth phase and in favor of the spring peak during the waning phase of the solar cycle are not always effective.
If so, how can we justify the noninversion of the peaks observed both at the Dakar station and at the Djibouti station during the phase of the decrease in the solar cycle?
Thus, justify why at this phase of decline the inversion was not effective as expected. The same analysis could be carried out in the growth phase. In such a case, the power Pvt(t) prevails over Ptp(t) at the peak of the spring equinox and Ptp(t) prevails over the power Pvt(t) at the peak of the autumn equinox.
5. Conclusion
At the end of this study, the formula proposed on the power of solar radiation inducing the variation of critical frequencies, to really say simple, is adapted. This formula is not only mathematical because it takes into account physical realities such as the Earth-Sun distance, the effects of sunspots, the transport mechanism, and the winds and solar flares and geographical position. Finally, the formula could strongly contribute to bringing a rational explanation both to the problem of the diurnal profiles of the critical frequencies foF2 and to that of the geomagnetic anomaly or equatorial anomaly.
Disclosure
The research was carried out within the framework of our scientific productions such as articles.
Conflicts of Interest
We declare that there is no conflict of interest regarding the publication of this article.
Open Research
Data Availability
The data of the in situ measurements were made available to us by the National School of Telecommunications of Brittany.


