Analytical Validation of Smartphone Spectroscopic Technic Used in an Educational Kinetic Study
Abstract
Use of smartphone-based spectroscopy is showing a constant growth since last year. It presents the advantage of being widely available for everyone. The most important thing is that it is still a low-cost method adapted to the education context. However, as all analytical methods, it should be validated to ensure the reliability of its results. In this study, we present the steps of the validation process with its statistical tests applied to the dosage of di-iode. Shapiro–Wilk test revealed that our method has a random character. Homogeneity of variance analyses using the Cochran test confirmed the precision of the method. The Fisher test revealed the linearity of the model of correlation between I2 concentration and the response. The relation between response and concentration is A = 1000 C + 0.002. From the parameters of the linear regression of the model, we deduced the limits of quantification and XLq = 4·10−5 mol·L−1 and XLd = 1·10−5 mol·L−1. Thanks to tightness of the sample, the method of I2 dosage was successfully applied in iodine quantification to monitor acetone iodination during time in the context of kinetic studies with minimum system trouble. Being low cost, this method can facilitate access to physical methods in educational laboratories.
1. Introduction
- (i)
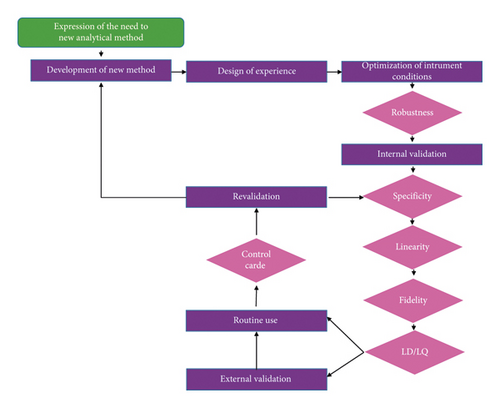
The selection of the method is a crucial step. Its selection affects directly the results.
- (ii)
The optimization of the method, an important step, that ensures the suitability of the method and the operation conditions of the routine.
- (iii)
The validation (internal or/and external) that ensures the verification of the results.
- (iv)
The routine use with a periodical control.

Smartphone-based spectroscopy is an emergent technic managed to quantify and describe physically human colour perception using a camera [2]. Nowadays, digitalizing images is becoming available for everyone [3]. Smartphone technology has now speared in every aspect of modern life. Since its first commercialization in 1990s, until now, smartphone use has widely expanded. In Tunisia, a North African country, in 2016, 70% of the Tunisian population possesses smartphones connected to either mobile or Wi-Fi connections according to a report of the consumer lab Ericson. The accessibility of these devices among high school students can encourage taking advantage of laboratory experiments and practical study. This type of spectroscopy is easy to handle and overcome technical problems related to material lack and damage [4–7]. It is important to be aware of the wide expansion of this type of spectroscopy which covers a lot of fields such as agriculture, biochemistry analyses, medical analyses, nanomaterial, and hazardous materials. This method can currently quantify copper [8], iron (III) [9], formaldehyde [10], water salinity [11], blood hematocrit [12], and acetazolamide [13].
The acceleration of this method spread out due to its facility and low-cost appeal to the necessity of an easy procedure establishment for its analytical validation [14]. In this study, we tried to implement a simple method using smartphone for the quantification of di-iode in order to quantify it in a kinetic lab. We describe the steps of the procedure for the analytical validation. As it is a non-normalized method, it has to be validated according to the EURACHEM Guide.
The acceleration of this method spread out due to its facility and low-cost appeals to the necessity of an easy procedure establishment for its analytical validation [14]. In this study, we tried to implement a simple method using smartphone for the quantification of di-iode in order to quantify it in a kinetic lab. Physical methods are preferred to chemical ones in reaction monitoring for kinetic studies. They are fast and they do not disturb progress. Sampling during the time is more accurate. UV-visible spectroscopy is the widely used technique mainly for coloured solutions [15]. But, this spectroscopic method is sophisticated and expensive. This apparatus cannot be afforded anywhere. Even it exists, it requires maintenance and spare parts. Use of smartphone overcomes this problem since it is affordable for all the students. So our method ensures availability at low-cost for educational institutions. However, the operation of photographing and transferring image to laptop for treatment by image J is still an awful operation in the method. To improve its accessibility and inclusiveness, it will be interesting to develop a smartphone application that treats images directly on the smartphone and not on a laptop. At this stage, we provide the method of smartphone use of a solution quantification, and we describe the steps of the procedure for its analytical validation. As it is a non-normalized method, it has to be validated according to the EURACHEM Guide [16]. This validation procedure has to be applied when developing smartphone new methods.
2. Materials and Methods
All reagents were handled while donning personal protection equipment (PPE), including a lab coat, gloves, and mainly eye protection under the hood. HCl is a strong acid, and skin contact should be avoided. Acetone and ethyl acetate are volatile organic solvents. They should be handled carefully. Iodine solutions must not be evacuated but stored to be correctly eliminated. Iodoacetone, a product of the reaction, is very powerful and harmful. All solutions containing this should be disposed of immediately after the experiment, and the apparatus was washed with plenty of water.
All used reagents are suitable for UV-visible spectroscopy. Acetone 99.5% and hydrogen chloride solution 1 mol·L−1 are delivered by Sigma-Aldrich. Iodine solution 0.5 mol·L−1 is provided by Merck.
In this study, samples of I2 solutions were put in plates. This one was implanted in a carton-covered box with a small aperture. Camera was placed in front of the aperture to photograph the plate. Image acquisition was performed by a smartphone (Samsung Galaxy A31: android version 11, 48 megapixels back camera), used with flash.
The chosen regions of interest (ROI) were squares of 400 pixels centred on the circles of each plate wells where they were duplicated. The distribution of RGB values of every pixel was contained in histograms by applying the macro shared in the supporting information.
3. Results and Discussion
3.1. Method Validation
Reliable analytical data are a prerequisite for a correct interpretation of findings in the evaluation of scientific studies, as well as in daily routine work, analytical methods have to be validated [17]. According to the EURACHEM Guide recommendations, the required validation steps are random character, specificity, accuracy, and linearity [18]. In the case of our application, the determination of the limits of detection and quantification is also needed since the application aims to monitor the process of degradation until the total completion of the reagent. It is also important to express the results with their uncertainty. Therefore, we accomplished the process of validation by uncertainty determination of our method response.
The first parameter to evaluate in the validation process is the normal character or the random character of a series of responses to ensure the absence of bias in the results. Shapiro and Wilk [18, 19] proposed a statistic test verifying the hypothesis of normality for a random sample. Specificity traduces qualitatively the extent to which substances interfere with the determination of a substance according to a given procedure [20]. It is also an essential parameter to be verified in signal detection. It allows ensuring a negative response in the absence of measured species. Precision represents the closeness of agreement between independent test results using identical experimental procedure under stipulated conditions. It also proves the closeness between measured results and the true value of a standard sample [20]. Within a given range, the analytical responses may vary linearly with the concentration of the measured species. Linearity evaluation allows the determination of method sensitivity and method limits of detection and quantification.
Random character of the obtained measurements has to be checked and verified, it allows the confirmation of their independence and their normal distribution. Therefore, we consider 3 solutions of iodine (2.5 × 10⁻⁴ mol·L−1) prepared separately from the commercial one. The dilutions and the measurements by our method were repeated for four days. Table 1 regroups the responses collected for 4 days.
| Day | Absorbance Aij | ||||||
|---|---|---|---|---|---|---|---|
| 1 | 0.255 | 0.230 | 0.238 | ||||
| 2 | 0.255 | 0.219 | 0.252 | ||||
| 3 | 0.244 | 0.241 | 0.250 | ||||
| 4 | 0.246 | 0.251 | 0.239 | ||||
| Median | R | Risk α | (p ∗ n)/2 | Rα/2 | R1 − (α/2) | ||
| 0.245 | 8 | 5% | 6 | 4 | 10 | ||
| Decision | |||||||
| If R < Rα/2 | Monotone derive | ||||||
| If R > R1 − (α/2) | Fast oscillation | ||||||
| If Rα/2 < R < R1 − (α/2) | Random distribution | ||||||
| Conclusion | |||||||
| The distribution is random | |||||||
To evaluate the normal character of the collected data, we use the Shapiro–Wilk test resumed in Table 1 [18]. It consists of calculating the median of responses (0.245). The number of sequences R = 8 is found by determining the number of values lower or higher than median. By referring to the values of Rα/2 and R1 − (α/2) at the risk level α = 5% given by the table, we can see that the calculated value of R is ranged between Rα/2 and R1 − (α/2). Thus, we conclude that the distribution of the measurements is normal [21, 22].
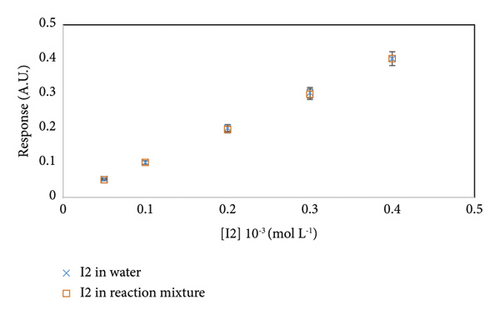
We developed our method to study the kinetic of a reaction where I2 is a reactant. Therefore, to ensure the absence of interference between the dosed species and the matrix, we evaluate the specificity of the method. We dose I2 in a mixture composed of acetone, HCl in aqueous medium, and ethyl acetate and I2 in water. The different solutions served to fill the wells of the same plate. Figure 2 illustrates the responses of the two series.

It shows that the two series have the same concentrations with a relative difference inferior to 5%. Specificity test prove absence of interferences by the adjunction of the kinetic blocking mixture. Our method is consequently specific and does not present a risk of interference with matrices [23].
To evaluate homogeneity of variance analyses, the Cochran test permits verification of the precision method [24]. Absorbance of iodine solution (2.5 × 10⁻⁴ mol·L−1) is measured 3 times in the same plate and during 4 different days. Table 2 regroups all responses [16, 18].
| Day (i) | Aij | ||||
| 1 | 0.255 | 0.230 | 0.238 | 0.163 | =0.619 |
| 2 | 0.255 | 0.252 | 0.219 | 0.399 | =0.399 |
| 3 | 0.250 | 0.241 | 0.244 | 0.020 | |
| 4 | 0.246 | 0.251 | 0.239 | 0.036 | 0.645 |
| CCri (α = 1%) = 0.864 | CCri (α = 5%) = 0.768 | ||||
| Decision | |||||
| If CCal < CCri (α = 1%) | Group does not contain suspected measurements | ||||
| If CCal < CCri (α = 5%) | Group does not contain rejectable measurements | ||||
| Conclusion | |||||
| All the values are not suspected | |||||
- Sj = standard deviation of data series J.
We can perceive that the calculated constant CCal is less than the critical constant value at both risks of 5% and 1%. Therefore, using the Cochran test, we confirm that the variances are homogenous and there are no suspected measure [16, 18, 24]. Our method provides reliable responses with good precision.
To correlate the concentration of I2 solutions with responses of our method, we use the Fisher test. This test allows the evaluation of relation linearity for iodine solutions in the range of concentrations: 0.5 × 10⁻⁴; 1.0 × 10⁻⁴; 2.0 × 10⁻⁴; 3.0 × 10⁻⁴; 4.0 × 10⁻⁴ mol·L−1 [25, 26]. Table 3 regroups all results.
| Concentrations (mol·L−1) | A1 | A2 | A3 | ||
| 0.00005 | 0.051 | 0.049 | 0.059 | Slope a1 = 1000 | |
| 0.00010 | 0.095 | 0.102 | 0.107 | ||
| 0.00020 | 0.201 | 0.191 | 0.211 | Intercept a0 = 0.002 | |
| 0.00030 | 0.302 | 0.310 | 0.298 | ||
| 0.00040 | 0.406 | 0.399 | 0.401 | Correlation coef. r2 = 0.9999 | |
| FTab = 3.7 | 0.03 | ||||
| Decision | |||||
| If FCal < FTab | The model is linear | ||||
| If FCal > FTab | The model is not linear | ||||
| Conclusion | |||||
| Calibration model is linear | |||||
Expression (3) gives XLD = 1·10−5 mol·L−1 and expression (4) gives XLQ = 4·10−5 mol·L−1.
Application of equation (7) to the results found in Table 3 indicates the U = 0.1 10−4 mol·L−1.
This method provides a numerical result on continuous scale from the measurement of a signal directly related to the amount of analyte. Table 4 recapitulates the steps of the validation of this method.
| Characteristic | Test | Description of the test |
|---|---|---|
| Random character | Shapiro–Wilk test conform | For the risk α = 5%, R, and 12 repetitions, the number of sequences R = 8 is between higher and lower values. |
| Specificity | Specific method | Response of solutions prepared in water and in reaction mixture are equal. |
| Precision | Cochran test conform | There is no aberrant responses in the 12 measurements; the fraction of higher variance to the sum of variances is less than Cochran critical vale at the risk α = 5% and α = 5%. |
| Linearity | Fisher test conform | Fisher test showed that the fraction of calculated residuals and experimental ones is inferior to the tabulated Fisher value for 5 levels repeated 3 times. |
| Calibration function | A = 1000 C + 0.002 | Least square regression is involved to determinate the slop and the intercept of the calibration curve. |
| Correlation coefficient | 0.9999 | This value represents the fraction of the variation in one variable that may be explained by the other variable. |
| Limit of detection | 1 10−5 mol·L−1 | Statistical test of comparison of the response at the value 0 becomes significant. The limit of detection is determined with a risk of 0.05%. |
| Limit of quantification | 4 10−5 mol·L−1 | Statistical test of comparison of the response at the value 0 becomes significant. The limit of quantification is determined with a risk of 0.05%. |
| Uncertainty | ±0.1 10−4 mol·L−1 | Because of the difference between the real value and the measured one, a degree of uncertainty will pertain to measurement. Uncertainty is the absolute range in which measured value can be accepted. |
3.2. Monitoring of Acetone Iodination by Smartphone
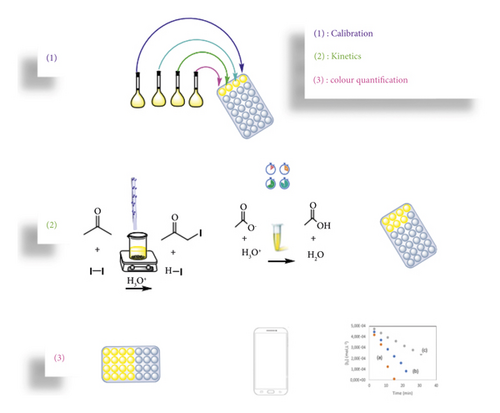
Di-iode is a yellow brownish species in aqueous solution [28]. Since it has marked colour, it can be easily adapted to smartphone spectroscopy quantification as described in the supporting information, and Figure 3 describes this procedure.

Therefore, the reaction rate is of the first order toward [H+] and [CH3COCH3] and of order 0 toward I2 [29–31].
At an ambient lab temperature of 298 K, we prepared 3 series of experiments carried out by mixing I2 solution with acetone in acidified aqueous medium according to the composition detailed in Table 5.
| Experiment | V (HCl 1 M) (mL) | V (C3H6O) (mL) | V (I2 0.05 M) (mL) |
|---|---|---|---|
| 1 | 2.5 | 1.0 | 1.0 |
| 2 | 2.5 | 0.5 | 1.0 |
| 3 | 1.0 | 0.5 | 1.0 |
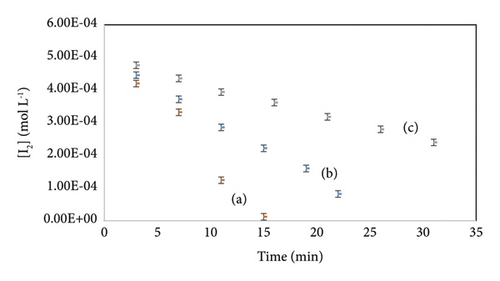
Figure 4 describes the evolution of I2 concentration in three different initial conditions as a function of time. All variations are linear with a correlation coefficient up to 0.97, which confirms the order pseudo-zero-order to I2. The equation of I2 variation versus time for each experiment is regrouped in Table 6.

| Equation | Correlation coefficient | |
|---|---|---|
| Exp (1) | Y = −4.10−5X + 0.0005 | 0.9764 |
| Exp (2) | Y = −2.10−5X + 0.0005 | 0.9961 |
| Exp (3) | Y = −8.10−6X + 0.0005 | 0.9967 |
From the initial rate, we calculate the partial orders a = 1, b = 1, and the rate constant k = 0.0035 L2·mol−2·s−1. These results conform to those found before I2 was quantified with UV-visible spectroscopy [29].
From these results, we demonstrate that using smartphone spectroscopy is reliable for the determination of I2 concentration.
4. Conclusions
- (i)
We tested the random character of the method responses by the Shapiro–Wilk test.
- (ii)
We proved the specificity of the method. No difference was observed between the response of the method when I2 is dissolved in water or in reaction mixture.
- (iii)
We verified that there is no suspected neither aberrant responses by the Cochran test.
- (iv)
We applied the Fisher test and we found that the method is linear. The equation of the calibration curve allowed us the determination of the limits of detection and quantification of the method.
- (v)
We calculated the uncertainty of the method.
The validated method of I2 quantification is applied to the kinetic study of acetone iodation. This method can be more developed and used for other chemical reactions in laboratory. Our developed method serves the equity of studying kinetics with physical methods for the neediest institutions in sophisticated materials. Moreover, it ensures a considerable reduction of chemical quantities compared to the classical UV-visible spectrophotometer needing a minimum amount of solution to fulfil the cell. However, the operation of photographing and transferring image to laptop to be treated by image J is still an awful operation in the method. To improve its accessibility and inclusiveness, it will be interesting to develop a smartphone application that treats images directly on the smartphone and not on laptop.
Abbreviations
-
- A:
-
- Absorbance
-
- I:
-
- Colour intensity of I2 solution
-
- I0:
-
- Colour intensity of water
-
- C:
-
- Concentration of I2 solution
-
- r2:
-
- Correlation coefficient
-
- Aij:
-
- Absorbance of a I2 solution number i during the day j
-
- R:
-
- Number of sequences in the Shapiro–Wilk test
-
- Sj:
-
- Standard deviation of data series j
-
- Smax:
-
- Maximum standard deviation of data series
-
- CCal:
-
- Cochran-calculated constant
-
- CCri:
-
- Cochran critical constant
-
- a1:
-
- Slope of linear curve
-
- a0:
-
- Intercept of linear curve
-
- FCal:
-
- Fisher test calculated value
-
- F Tab:
-
- Fisher test reference value
-
- XLq:
-
- Limit of quantification
-
- XLd:
-
- Limit of detection
-
- U:
-
- Uncertainty
-
- ri:
-
- Rate of the reaction
-
- a:
-
- Partial order toward C3H6O
-
- b:
-
- Partial order toward H+
-
- k:
-
- Constant rate.
Additional Points
Highlights. Validation means fit for purpose. Smartphone spectroscopy for quantification. Statistical test for analytical method validation.
Conflicts of Interest
The authors declare that there are no conflicts of interest regarding the publication of this paper.
Authors’ Contributions
Sahar Raissi is responsible for conceptualization, methodology, software, formal analysis, investigation, resources, and writing original paper. Fatma Fakhfakh is responsible for validation and reviewing.
Open Research
Data Availability
The authors confirm that the data supporting the findings of this study are available within the article′s Supplementary Materials. It contains a description of the details of the kinetic experience and the image J macro code and can be directly used.


