A Chaos-Based Image Encryption Scheme Is Proposed Using Multiple Chaotic Maps
Abstract
Everybody wants to maintain solitariness to some extent or entirely in his dealings with other people during different modes of communication. To retain privacy, researchers materialized distinct image encryption algorithms using chaotic maps. Due to their extraordinary features, most researchers employed multidimensional chaotic maps to barricade clandestine information or digital images from potential invaders. Still, multidimensional chaotic maps have many impediments conferred in the literature review. In this paper, we developed a cryptosystem utilizing multiple chaotic maps to mitigate the shortcoming of multidimensional chaotic maps. A distinctive approach is adopted to sire a key stream using a combination of chaotic maps and create a sequence of random integers linked with the pixels of the plain image to shatter the association between neighboring pixels of a plain image. Finally, diffusion is accomplished using the previously diffused pixels at a decimal level. Security and statistical analysis demonstrate that the presented encryption algorithm is robust against well-known attacks. An ample key space indicates that it is best suited for secure communication.
1. Introduction
The importance of image encryption is increased to transmit confidential data (images, videos, audios, and agreements) via the internet because digital images are frequently used to communicate and share sensitive information, whether in the military, banking, or personal moments. Many image encryption techniques [1] have been constructed based on a variety of chaotic [2, 3] to protect the plain images from prying eyes or unlawful access. Traditional security encryption schemes like AES [4], DES [5], and IDEA [6] are inadequate to maintain acceptable standards for the safety of digital images because of the strong association among neighboring pixels, enormous storage capacities, and significant redundancy.
Chaotic systems are deemed to be appropriate for image encryption schemes due to their features like ergodicity, pseudorandomness, ambiguity, high sensitivity to initial conditions, and controlled parameters. Most researchers designed cryptosystems [7, 8] either by modifying existing chaotic systems [9, 10] or developing new chaotic systems [11, 12], keeping in mind the usefulness of chaotic systems due to their characteristics, as mentioned earlier. The authors of [13] proposed a 2D-LSM chaotic system and ascertained that it is more chaotic than some lately developed two-dimensional chaotic maps using a bifurcation diagram, LE, phase plane trajectory, and sample entropy. Furthermore, it materializes a color image encryption algorithm (CIEA) using orthogonal Latin square and 2D-LSM. Hua et al. [14] conferred a new 2D-PPCS (two-dimensional parametric polynomial chaotic system) to mitigate the flaws of existing chaotic systems, and theoretical analysis exhibits the chaotic behavior of the 2D PPCS. The study of [15] modifies the chaotic behavior of a 1-dimensional chaotic map, further analyzed the chaotic behavior through phase diagram and Lyapunov exponent spectrum, and constructs a novel image encryption scheme. There are two types of chaotic systems: (i) one or 2− dimensional chaotic maps and (ii) multidimensional chaotic maps. Most recent image encryption techniques are based on multidimensional chaotic maps [16, 17], which are more sensitive than 1-dimensional chaotic maps. It contains many initial values and controlled parameters that help enlarge the length of key space to resist brute force attacks. In [18], Malik et al. developed a cryptosystem for a color image using two multidimensional chaotic maps and used the idea of histogram equalization to equalize histogram of chaotic sequences of Lorenz system. Hua et al. [19] suggested an image encryption scheme using S-box, yielded using a complete Latin square. Experimental consequences divulge that the presented cryptosystem can defy all well-known security and statistical seizures from potential invaders. The authors of [20] designed an image encryption scheme utilizing parallel compressing sensing with adaptive thresholding sparsification. In [21], to get the random sequences of a 5-dimensional hyperchaotic map, first generate the initial values that depend on pixels of a plain image. A unique key is generated after rearranging the random sequences and constructed an image encryption algorithm. Multidimensional chaotic maps take more time during the execution process due to their intricate structure and method to find the solutions of a multidimensional chaotic map. Alternatively, one or 2− dimensional chaotic maps are simple in structure and execute efficiently in the available MATLAB versions, not taking more time during the computational process. Therefore, we use a combination of chaotic maps rather than the multidimensional chaotic system in this paper. The logistic map, piecewise linear chaotic map, tent map, and Henon map are used to propose an encryption algorithm. Two unique keys are generated using the aforementioned chaotic maps to diffuse the pixels of the plain image at the decimal level. To break the connection among nearby pixels in a plain image, generate a random sequence of integers using any chaotic map, relate it with the diffused pixels, and further use it to scramble the diffused pixels. Finally, the presented encryption algorithm is evaluated on various images, including Lena, Baboon, Pepper, Cameraman, and House. The experimental results demonstrate the effectiveness of our presented image encryption algorithm.
The remaining sections of the paper are organized as follows. The basic features of distinct chaotic maps are described in Section 2. Each step of the proposed encryption method is discussed in detail in Section 3. Various security and statistical tests are performed in Section 4 to assess the performance of the constructed cryptosystem. Conclusions are discussed in Section 5.
2. Chaotic Map
In this section, we will discuss some chaotic maps which are further utilized in an image encryption scheme.
2.1. Logistic Map
2.2. Piecewise Linear Chaotic Map
2.3. Tent Map
2.4. Hénon Map
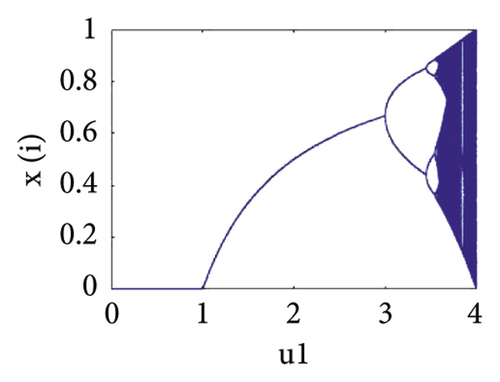
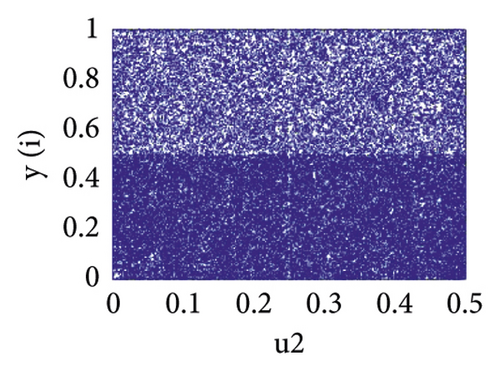
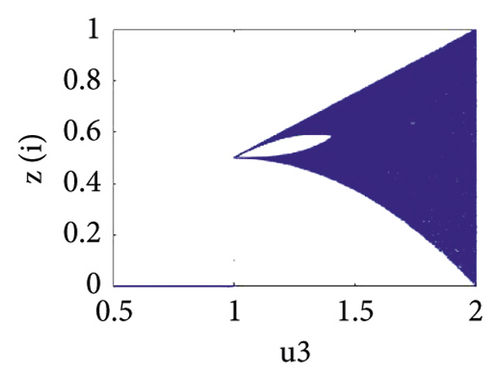
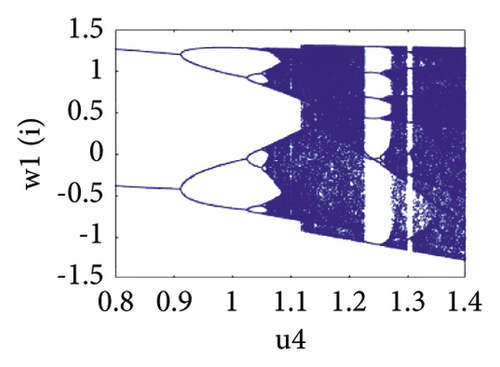
The Hénon map depends on two control parameters u4 and u5, and highly sensitive to initial conditions which belongs (0, 1). The chaotic behavior of the Hénon map can be seen in bifurcation diagram against the parameter u4 ∈ [0.8,1.4] in Figure 1(d).
3. Proposed Image Encryption Scheme
-
Step 1. Transformation
-
Let I be a grayscale image of size M × N, where M and N indicate rows and columns, respectively. Now, we transform image I into a 1− dimensional array P1 of size L = M × N.
-
Step 2. Key Stream Generation
- (i)
Let x0, y0, z0, w10, w20, u1, u2, u3, u4, and u5 be the initial conditions and control parameters that are used to iterate the equations from (1) to (5).
- (ii)
After iteration the pseudorandom generated sequences , , , , and .
- (iii)
To remove the transient effect, discard the first n0 iterations from each sequence , {yL}, {zL}, , and {xL} and obtained new sequences x1, x2, x3, x4, and x5, respectively, of length L.
- (iv)
Choose the one sequence from the sequences x1, x2, x3, x4, and x5 and after selecting the sequence, store them in A , in ascending order.
- (v)
Now generate sequence T of random integers by storing the position of each member of A in the selected sequence.
- (vi)
Divide the sequence T into four subsequences T1, T2, T3, and T4, the length of each subsequence is L/4;
() - (vii)
Now, select the state of variables from the remaining four sequence named as Y1, Y2, Y3, and Y4 and get the subsequences S1, S2, S3, and S4, respectively of length L/4 using the expression described as follows:
() -
where n means number of encryption rounds and for each n, i = 1,2,3,4 and j = 0,1,2,3. if (n + j) > 4 then (n + j) = (n + j) mod 4.
- (viii)
The subsequences S1, S2, S3, and S4 are used to form a sequence of length L.
- (ix)
We have 4! ways to form a sequence of length L by using the subsequences S1, S2, S3, and S4.
- (x)
Now obtained two sequences B1 and B2 of length L using two different arrangements of S1, S2, S3, and S4.
-
B1 = arrangement of sequences {S2, S1, S3, S4}.
-
B2 = arrangement of sequences {S3, S2, S4, S1}.
- (xi)
Compute the key streams D1 and D2 using the mathematical formula described as follows:
() -
where i = 1 to L.
-
Step 3. Decimal Diffusion Level 1
-
The following analytical equation is used to diffuse the pixels of P1 using D1 and previously diffused pixels;
() -
where d1 is a seed value used to diffuse the first pixel of P1.
-
Step 4. Block Scrambling Process
- (i)
First, divide I1 into blocks, and the size of each block is M1 × N1; then, the number of blocks is h, where h = M × N/M1 × N1.
- (ii)
Now, obtain a subsequence Q1 of length h from the sequence, which is selected from the sequences w1,y, z, w2x and generate the sequence Q2 of random integers using the same procedure on Q1, described in Step 2 (iv, v).
- (iii)
Q2 is used to scramble the blocks of I1 for n1 times where n1 indicates the number of scrambling rounds; after block scrambling of I1, transform the I1 into a 1-dimensional array I2.
-
Step 5. Decimal Diffusion Level 2
-
The pixels of I2 is diffused using the sum of previously diffused pixels and D2, with mathematical expression described as follows:
() -
where d2 is the seed value used to diffuse the first pixel of I2.
-
Step 6. Pixels Scrambling Process
- (i)
Let T be a random integers sequence of length L, described in Step 2. (v).
- (ii)
T is used to scramble the pixels of I3 for n2 times where n2 indicates the number of pixels scrambling rounds.
-
Step 7. Cipher Image
-
Transform the I3 into matrix C of size M × N. Figure 2 illustrates the encryption process.
-
Decryption is performed in the opposite direction as encryption.
4. Performance Evaluation
The performance of a presented cryptosystem is tested utilizing statistical and security analysis on distinct images such as Lena, Baboon, Pepper, Cameraman, and House. The parameters of the secret key are x0 = 0.23, y0 = 0.25, z0 = 0.25, w10 = 0.2, w20 = 0.01, u1 = 3.8956, u2 = 0.25678900, u3 = 1.5, u4 = 1.4, u5 = 0.3, d1 = 234, d2 = 234, n0 = 700, n = 1, n1 = 1, and n2 = 1, and all experimental results are computed in MATLAB 2018b on a compatible computer with Windows 10, 8.00 GB RAM, and an Intel(R) Core(TM) i5-6300U CPU @ 2.5 GHz. Figure 3 demonstrates the encryption effect of our presented cryptosystem, and all experimental data are documented in tables, demonstrating that our cryptosystem’s performance is outstanding against any security and statistical threats.


4.1. Key Space Analysis
The key space analysis helps us to decide whether or not our cryptosystem can withstand brute force attacks. The length of a key space is crucial to withstand a brute force assault because a prospective intruder would try every possible combination of key space to crack the cryptosystem. It is believed that if a cryptosystem’s key space is larger than 2100, it is robust. Let x0, y0, z0, w10, w20, u1, u2, u3, u4, and u5 be the secret key parameters, and each has a computational accuracy of 10−15, and d1, d2, and d3 are the positive integers used at diffusion level, and n0 is the number of discarding iterations where 100 ≤ n0 ≤ 1000. Consequently, the length of the key size 9 × 10159 which is higher than 2100, demonstrating that our presented encryption technique is resistant to brute force attacks. Table 1 shows the key space comparison to some existing encryption cryptosystems.
4.2. Histogram Analysis
Histogram analysis is the simplest and pictorial way to see the frequency distribution in plain and encrypted images. If the frequency distribution is uniform, then it is considered that the proposed encryption scheme is suitable for the secure transmission of data through the internet in daily use applications. In 8− bit grayscale image, the range of pixels value is 0 to 255. Histogram of plain and encrypted images (Lena, Baboon, Pepper, Cameraman, and House) can be seen in column (b, d) of Figure 3, and column (b) shows that the frequency distribution of pixels is not uniform. Still, on the other side, column (d) shows that the frequency distribution of pixels is uniform. The uniform distribution of pixels demonstrates that our proposed image encryption scheme can resist any statistical attack. A potential invader does not get any reliable information from the histogram of encrypted images.
4.3. Entropy
| Images | Size | Entropy | Local entropy | Chi-square score |
|---|---|---|---|---|
| Lena | 256 × 256 | 7.9969 | 7.9091 | 286.4766 |
| Baboon | 256 × 256 | 7.9976 | 7.9065 | 219.5625 |
| Pepper | 256 × 256 | 7.9976 | 7.9066 | 214.7813 |
| Cameraman | 256 × 256 | 7.9968 | 7.9069 | 291.6484 |
| House | 256 × 256 | 7.9972 | 7.9076 | 253.4357 |
The benchmark of local Shannon entropy is 7.90. It is evident from the Table 2 that our proposed encryption scheme can produce adequate randomness in an encrypted image that a potential invader cannot get any reliable information about the plain image.
4.4. Chi-Square Analysis
4.5. Majority Logic Criteria (Texture Analysis of the Image)
To evaluate the presented encryption scheme’s efficiency on digital images, the MLC [31, 32] tool is utilized, which is a collection of five statistical tests such as correlation, contrast, entropy, energy, and homogeneity.
4.5.1. Contrast
4.5.2. Correlation
| Images | P/E | Contrast | Correlation | Energy | Homogeneity |
|---|---|---|---|---|---|
| Lena | Plain | 0.5047 | 0.8918 | 0.1094 | 0.8525 |
| Encrypted | 10.4180 | 0.0036 | 0.0156 | 0.3893 | |
| Baboon | Plain | 0.4318 | 0.8495 | 0.1120 | 0.8193 |
| Encrypted | 10.4939 | −0.0004 | 0.0156 | 0.3906 | |
| Pepper | Plain | 0.4868 | 0.9614 | 0.1061 | 0.8802 |
| Encrypted | 10.4459 | 0.0036 | 0.0156 | 0.3915 | |
| Cameraman | Plain | 0.5872 | 0.9227 | 0.1805 | 0.8953 |
| Encrypted | 10.4980 | 0.0002 | 0.0156 | 0.3893 | |
| House | Plain | 0.1863 | 0.9497 | 0.2029 | 0.9251 |
| Encrypted | 10.5117 | −0.0004 | 0.0156 | 0.3887 | |
| Average | Plain | 0.4394 | 0.9150 | 0.1422 | 0.8745 |
| Encrypted | 10.4735 | 0.0013 | 0.0156 | 0.3899 | |
| Images | Direction | Correlation | |
|---|---|---|---|
| Plain image | Encrypted image | ||
| Lena | Horizontal | 0.9907 | 0.0222 |
| Vertical | 0.9380 | 0.0354 | |
| Diagonal | 0.9377 | 0.0006 | |
| Baboon | Horizontal | 0.8341 | 0.0346 |
| Vertical | 0.8989 | 0.0205 | |
| Diagonal | 0.8270 | −0.0049 | |
| Pepper | Horizontal | 0.9830 | 0.0017 |
| Vertical | 0.9667 | 0.0222 | |
| Diagonal | 0.9511 | 0.0076 | |
| Cameraman | Horizontal | 0.8842 | 0.0149 |
| Vertical | 0.9201 | 0.0162 | |
| Diagonal | 0.8425 | −0.0168 | |
| House | Horizontal | 0.9218 | −0.0312 |
| Vertical | 0.9959 | −0.0031 | |
| Diagonal | 0.9134 | −0.0294 | |


4.5.3. Energy
4.5.4. Homogeneity
The experimental MLC score of plain and encrypted images is listed in Table 3. MLC scores indicate that the encryption technique is excellent for digital images for secure transmission through the internet.
4.6. MSE/MAD/PSNR/SSIM Analysis
| Images | MAD | MSE | SSIM | PSNR |
|---|---|---|---|---|
| Lena | 73.0485 | 7782 | −0.0012 | 9.2198 |
| Baboon | 73.2823 | 7833 | −0.0015 | 9.1916 |
| Pepper | 73.1300 | 7780 | 0.0013 | 9.2210 |
| Cameraman | 73.1966 | 7796 | 0.000828 | 9.2118 |
| House | 73.0063 | 7792 | −0.0015 | 9.2145 |
| Average | 73.1327 | 7797 | 0.0011 | 9.2117 |
4.7. Data Loss Attack Analysis
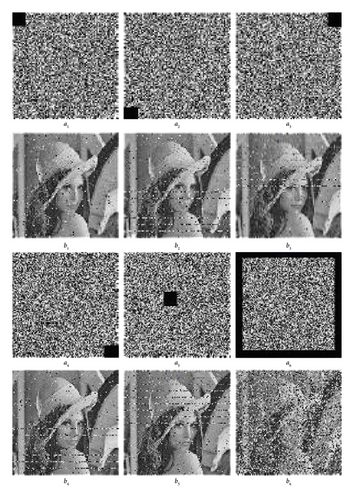
A data loss attack means a potential invader artificially dethrones the pixels of a particular area of an encrypted image or loses some portion of the image during transmission through the internet. A cryptosystem is immaculate if it convalesces the critical information from the encrypted image, which loses the data. It is clear from Figure 5 that our proposed cryptosystem can retrieve helpful information from the encrypted images which lose data during communication. In Figure 5, a1 to a5 the figures which lose a block of data size 32 × 32 to demonstrate the data loss attack and a6 lose data from all sides, and b1 to b6 represent the figures after performing the decryption process on the figures which lose data respectively.
4.8. Noise Attack Analysis
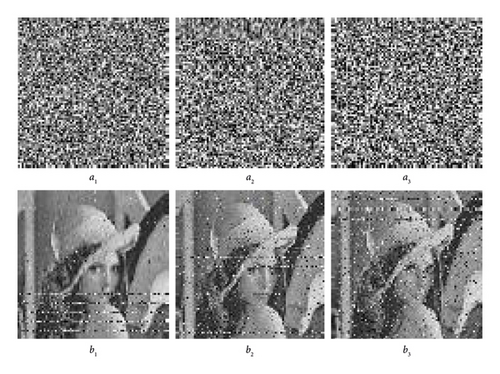
Normally, images possess information, but during the transmission, the image is polluted with some noise. The appearance of noise will annihilate the original information from the image. The pepper and salt noise effect on our encryption algorithm is examined in this paper on Lena’s image, and different salt and pepper noise ratios represent the attack intensity. In Figure 6, we use the pepper and salt noise ratios 0.01, 0.03, 0.05 on the figure a1, a2, and a3, respectively. The decryption process are employed on the a1, a2, and a3 and as a result get figures b1, b2, and b3, respectively. Figure 6 demonstrates that our proposed system is flawless for dealing with polluted images and retrieving important information as much as possible.
4.9. Differential Attacks
| Test/size of images | 256 × 256 | 512 × 512 | 1024 × 1024 |
|---|---|---|---|
| NPCR | 99.5954 | 99.5893 | 99.5954 |
| UACI | [33.2824, 33.6447] | [33.3730, 33.5541] | [33.4183, 33.5088] |
4.10. Plaintext Sensitivity Analysis
A cryptosystem is plaintext sensitive if a slight change in randomly selected pixel of plain image will produce a different encrypted image; that encrypted image does not provide any important clue about plain image. Method to test the plaintext sensitivity, let P1 and P2 be two plain images; all the pixels of P1 and P2 are the same except one randomly selected pixel. The original key is used to encrypt the plain images P1 and P2, get two encrypted images E1 and E2, respectively. NPCR and UACI between two encrypted images E1 and E2, are computed using equations (21) and (22). A cryptosystem is sensitive to plaintext if the value of NPCR > 99% and UACI is greater or closer to 33%. The procedure, as mentioned earlier of plaintext sensitivity employed on the image (Lena, Baboon, Pepper, Cameraman, and House) and compute the NPCR and UACI score, is listed in Table 7. The plaintext sensitivity score of different images demonstrates that our cryptosystem can resist any differential attack.
| Images | Size | NPCR(%) | UACI(%) | Randomly selected pixel |
|---|---|---|---|---|
| Lena | 256 × 256 | 99.6460 | 33.4271 | P(1,1) |
| Baboon | 256 × 256 | 99.6426 | 33.4309 | P(256,256) |
| Pepper | 256 × 256 | 99.6475 | 33.4078 | P(167,233) |
| Cameraman | 256 × 256 | 99.6521 | 33.4538 | P(217,17) |
| House | 256 × 256 | 99.6353 | 33.3731 | P(128,128) |
4.11. Key Sensitivity Analysis
The cryptosystem is regarded as extremely key sensitive; if the encrypted image acquired after a subtle change in any of the secret key parameters provided in Table 8 is distinctive from the encrypted image generated without any change in secret key parameters. To test the key sensitivity, first, encrypt plain image P using the original secret key parameters listed in Table 8, then encrypt the same plain image using a minor modification of 10−15 in any secret key parameter, yielding two encrypted images E1 and E2. NPCR and UACI are computed between to encrypted images E1 and E2 using the equations (21) and (22). We performed a key sensitivity analysis on the Lena image by making minor changes to each secret key parameter one at a time. The resulting NPCR and UACI scores are shown in Table 8, indicating that our proposed cryptosystem is extremely key sensitive and resistant to differential attacks.
| Parameters | Change in parameter | NPCR(%) | UACI(%) |
|---|---|---|---|
| x0 | x0 + 10−15 | 99.6048 | 33.4169 |
| y0 | y0 + 10−15 | 99.6124 | 33.3899 |
| z0 | zo + 10−15 | 99.6613 | 33.3942 |
| w10 | w10 + 10−15 | 99.5941 | 33.3327 |
| w20 | w20 + 10−15 | 99.5911 | 33.5274 |
| u1 | u1 + 10−15 | 99.5834 | 33.2567 |
| u2 | u2 + 10−15 | 99.5728 | 33.3396 |
| u3 | u3 + 10−15 | 99.6155 | 33.6749 |
| u4 | u4 + 10−15 | 99.6094 | 33.6089 |
| u5 | u5 + 10−15 | 99.5911 | 33.5005 |
| n0 | 100 ≤ n0 ≤ 1000 | 99.5956 | 33.3028 |
4.12. Randomness Test for Cipher
Our proposed cryptosystem creates enough randomness in the pixel of encrypted images; a potential invader can never acquire reliable information about the plain image. The Nist test in [34] is used to check the randomness present in the pixels of encrypted images. The Table 9 exhibits the two Nist test results, which confirm that the security of our proposed cryptosystem is excellent to resist any attack.
| Images/tests | Frequency | Runs | Rank |
|---|---|---|---|
| P_value for Lena | 0.8265 | 0.3085 | 0.0852 |
| P_value for Baboon | 0.9761 | 0.4672 | 0.0852 |
| P_value for Pepper | 0.8420 | 0.1909 | 0.0852 |
| P_value for Cameraman | 0.2991 | 0.2048 | 0.0852 |
| P_value for House | 0.6390 | 0.4285 | 0.0852 |
4.13. Speed Analysis
The speed and security of any encryption scheme are the key characteristics in the application of real life. The analysis, as mentioned earlier, exhibits that the security of our proposed encryption scheme is immaculate. We test the speed of our encryption scheme in MATLAB 2018b on a compatible computer with Windows 10, 8.00 GB RAM, and an Intel(R) Core(TM) i5-6300U CPU @ 2.5 GHz. Table 10 shows the speed analysis of our proposed scheme with other encryption schemes developed using multidimensional chaotic maps. The speed analysis confirmed that our encryption scheme is unassailable and efficient. Also, the statistical test results of the baboon image are compared in Table 11 with the existing encryption scheme.
| Images | Size | Proposed | [3] |
|---|---|---|---|
| Lena | 256 × 256 | 3.222 | 3.350 |
| Baboon | 256 × 256 | 3.259 | 3.504 |
| Pepper | 256 × 256 | 3.316 | 3.079 |
| Cameraman | 256 × 256 | 3.319 | 3.371 |
| House | 256 × 256 | 3.284 | 3.624 |
5. Conclusion
The novelty of this paper is to generate a unique key stream and scrambling process (blocks of plain image and pixels of plain images) using different chaotic maps, which is further utilized to propose a cryptosystem for the security of digital images during transmission from a potential invader. The aforementioned cryptosystem is employed on the standard grayscale images to see its effectiveness. The simulations and results of the experimental analysis demonstrate that the presented cryptosystem is exceptional in preserving high security and privacy requirements. We can confidently assert that the presented scheme is ideally suited to multimedia communications and online systems.
Conflicts of Interest
The authors declare that they have no conflicts of interest.
Open Research
Data Availability
The data used to support the study are included in the paper.


