The Effect of Fines and Temperature on the Mode I Fracture Characteristics of the Frozen Sand
Abstract
In this research, the three-point bending tests were conducted using frozen sand specimen of 0, 5, 10, and 15% fine contents with specified notch under −5, −10, and −15°C condition to analyse the effects of fine contents and temperature on the mode I fracture characteristics of the frozen sand. Three-point bending tests were performed using the standard test method of other materials such as metal and concrete. In order to investigate the effect of fine and temperature on the fracture characteristics of the frozen sand, the stress intensity factor and fracture energy were calculated using three-point bending test results. Based on the test results, fine contents and temperature can affect the brittle and ductile responses of the frozen sand. Furthermore, the fracture toughness of frozen sand increase with the fine contents’ increase and the temperature decrease. Fracture energy required for the crack initiation can be dominated by the fracture behaviour and brittle and ductile response.
1. Introduction
Permafrost area has a variety of economic values such as energy and biological resources, and it has not yet been developed due to the poor environmental conditions. The interest on the development of permafrost area has increased rapidly in the past several decades globally, and many research studies related to the permafrost area, especially the mechanical behaviour of the frozen soil, have been performed continually since the early 1960s [1–3]. In the 21st century, the research studies to investigate the mechanical behaviour of frozen soil have been performed in Korea [4, 5], and the research studies to develop infrastructure and resource transmission network in cold region were mainly performed [6, 7]. These research studies show that the fine contents, temperature, and unfrozen water contents are the major influencing factors affecting the mechanical behaviour of frozen soil. Chae et al. [8] performed the unconfined compression tests using the frozen sand with different fine contents and temperature to investigate the mechanical response of the frozen sand. Based on the test results, as the fine contents and temperature increase, the strength and stiffness of frozen sand decrease. Furthermore, Chae et al. [4] performed the uniaxial creep tests using the frozen sand with different temperature and the resistance to the creep behaviour also decreases with the temperature decrease. Frozen soil has different composition form the unfrozen one, consisting of soil particle, air, unfrozen water, and ice. In order to develop the permafrost area, it is important to understand the mechanical behaviour of frozen soil. Since the mechanical characteristics of the frozen soil differ from those of the unfrozen one, the application of the general geotechnical engineering theory based as it is can cause variety of engineering problems. Especially, in permafrost area, some cracks may exist on the frozen ground which is called ice wedge, and it can cause unexpected failure of the ground and slope.
However, the research to investigate the fracture characteristics of the frozen soil has rarely been performed and few research studies have been performed under limited conditions. Fracture characteristics of frozen soil are influenced by various factors such as ice contents, geometry of the crack, loading rate, and temperature. Some research studies have been performed to investigate the effect of these factors on the fracture behaviour of frozen soil. Liu and Liu [9] investigate the fracture characteristics of frozen soil due to the needs for the comprehensions of the frozen soil damage in compression process. The unconfined compression fracture tests were performed using Shenyang-specific silty clay at various temperatures under the different loading rate conditions. The effect of geometry of the pre-existing crack conditions was also investigated by controlling a tilted angle of the crack. Based on this previous research, the fracture toughness, KIc, shows linear increases with the tilted crack angle increases. Furthermore, KIc increased exponentially with the temperature decreases and loading rate increase. Konard and Cummings [10] determined KIc values of frozen sand by applying the standard test method for fracture toughness of metallic material. The tests were performed with different temperature, volumetric ice contents, and grain size. Based on the test results, fracture toughness of frozen soil increases with the volumetric ice contents’ increases and temperature decrease. In addition, as the average grain size of the frozen soil decreases, the fracture toughness of frozen soil logarithmically decreases. Yamamoto and Springman [11] performed three-point bending test using frozen soil specimen to investigate the effects of strain rate, volumetric ice contents, and temperature on the stress-strain behaviour and ductile or brittle response. The observed brittle and ductile crack formation depend on the vertical deformation rate and temperature. Based on the load-displacement curves, the ductile behaviour was observed at higher temperature and under lower strain rate. The ductility of frozen soil was also enhanced with the volumetric ice content decreases. Furthermore, the effect of temperature on the fracture behaviour of frozen soil was more distinct in the lower volumetric ice contents.
Even though the mechanical behaviour of the soil can be affected by the existence of fines, previous research on the fracture characteristic of the frozen soil mainly focused on one type of soil such as silts, clay, or pure sand [9, 12, 13]. Generally, mechanical property such as shear strength and Young’s modulus of the unfrozen sand can be affected by the fine contents, and many research studies have been already performed to investigate the effect of fine contents on the mechanical behaviour of the unfrozen sand [14–17]. In the frozen sand, fine contents can also affect the mechanical behaviour of frozen sand, and it can be a criterion to evaluate the performance of the frozen sand. However, the effects of fines on the fracture behaviour of frozen soil have never been investigated before to the authors’ knowledge.
Therefore, in this research, the three-point bending tests were performed on frozen uniform sand with 0, 5, 10, and 15% fine contents at −5, −10, and −15°C to investigate the effects of the fine and temperature on the mode I fracture behaviour of the frozen sand. The mode I fracture is when the principal load is applied normal to the crack plane and tends to the crack progress opposite and perpendicular to each other. In this research, fine contents are defined as the fractional ratio of kaolinite to the Jumoonjin sand in weight. In Unified Soil Classification System, fine was defined as a case of the particles less than no. 200 sieve (0.075 mm) in size and the kaolinite used in this research was found to meet this standard (Table 1). The tests were performed by controlling displacement and crack mouth opening displacement (CMOD) was measured using a strain gauge which was attached to the notch of the frozen specimen. Based on the test results, fracture toughness was calculated using the linear elastic fracture mechanics theory and the fracture energy was calculated using load-CMOD curves.
| Jumoonjin sand | Kaolinite | |
|---|---|---|
| Specific gravity (Gs) | 2.62 | 2.49 |
| Max. dry unit weight (kN/m3) | 16.7 | - |
| Min. dry unit weight (kN/m3) | 13.3 | - |
| Coefficient of uniformity, Cu | 1.52 | - |
| Coefficient of curvature, Cg | 0.96 | - |
| Liquid limit, LL | - | 44.88 |
| Plastic limit, PL | - | 32.75 |
| Plasticity index, PI | - | 16.13 |
| % Finer by #200 (%) | 0.06 | 99.86 |
| USCS | SP | ML |
2. Research Significance
Based on the previous research, many parameters such as temperature, volumetric ice contents, loading rate, and soil particle can affect the fracture characteristics of frozen soil [9–11, 13]. However, these research studies mainly focused on one type of soil such as silts, clay, or pure sand. Many research studies have verified that fine contents affect the mechanical behaviour of frozen sand [14–17], and fracture characteristics can also change due to the fine contents.
This research investigates the mode I fracture characteristic of frozen sand varies with the fine contents and temperature performing three-point bending tests using rectangular specimen with one initial crack. In the case of the test method to investigate the fracture characteristics, various test methods have been applied according to the research purpose and the characteristic of the material. Three-point bending test is commonly used to investigate the mode I fracture characteristics of material such as concrete [18, 19]. Based on the test results, stress intensity factor and fracture energy were calculated to investigate effects of fines and temperature on the fracture characteristics of frozen sand. These two parameters are simple and have the advantage of analyzing fracture characteristics of frozen sand without special software or equipment even though the precise is lower than advanced technique such as DIC.
This research can be used as a basic data for designing and maintaining ground structures in permafrost area, and it can be also used as a criterion to evaluate the performance of the frozen sand. Furthermore, the methodology of this research such as experimental program and data analysis can be used as reference for further research.
3. Theoretical Background
In this research, the linear elastic fracture mechanic is used as a basic theoretical concept. The basic concept of the linear elastic fracture mechanics (LEFM) theory is that the material is linear elastic except for a local region near the crack tip. Generally, in the case of the external load applied in the material body, the stress distribution near the crack tip is very intensive, and some inelasticity must take place on it. However, if the size of the inelastic region is very small relative to the linear elastic body, the disturbance caused by the inelastic region would be very small. In other words, the application of the LEFM theory is to disregard the plasticity of the crack tip of the material. Therefore, LEFM theory can be used for the explanation of the characteristics on any material such as concrete and asphalt even though precise calculation may not be made. In order to evaluate the fracture resistance of the material, various parameters have been used in fracture mechanics, and stress intensity factor is one of the most commonly used parameter in LEFM.
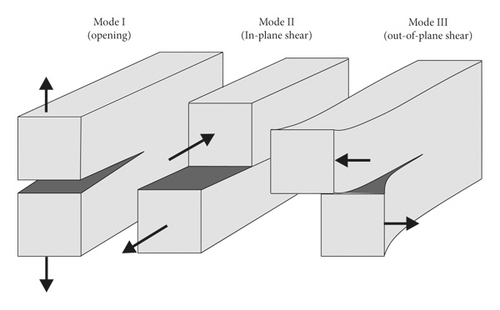
Figure 1 presents the typical types of the loading mode that can advance a crack. If the principal load is applied normal to the crack plane, it is called mode I loading and the crack moves opposite and perpendicular to each other. Mode II loading is the in-plane shear loading, and one crack face tends to slide to the other. Mode III indicates the out-of-plane shear loading showing lateral tearing. Generally, the mode of loading is shown together in the subscript when expressing the stress intensity factor (KI, KII, or KIII). If the stress or strain of a material reaches the critical value, fracture must be taken with a critical value of the stress intensity factor, which is called fracture toughness. The fracture mechanics has three key parameters which are flaw size, applied stress, and fracture toughness and quantifies the critical combinations of these three parameters. The flaw size and applied stress indicate the driving force for fracture. Fracture toughness is a material property to indicate the ability to resist fracture and one of the most crucial properties for many engineering processes related to the cracks or fracture. The requirement for crack stability is expressed by K < Kc. Kc is a material property which is independent on the geometry and size of the material body.
In fracture mechanics, in order to evaluate the resistance of the fracture, various parameters were used depending on the material property and the purpose of the research. In this research, in order to investigate the effect of fine contents and temperature on the fracture behaviour of frozen sand, fracture energy was used with the stress intensity factor. Fracture energy can be calculated by the area at the bottom of the load-CMOD curve as presented in Figure 2 and equation (4):where Gf is the fracture energy, W is the work required for the fracture that can be calculated by the area at the bottom of the load-CMOD curve, D is height of the specimen, a is length of the crack, B is width of the specimen, and Alig is calculated by equation (4). Detailed information of the fracture energy calculation can be checked in RILEM technical committee 50-FMC [22]. Fracture energy is easier to calculate than other parameters and can be applied regardless of the loading condition and material property.

4. Experimental Study
In this research, three-point bending tests were performed using Single-Edge Notched Beam specimen to investigate the fracture behaviour of frozen sand with 0, 5, 10, and 15% fine contents at −5, −10, and −15°C. Since the standard method has not been established for three-point bending test of the frozen soil yet, a testing program for three-point bending test of frozen soil herein was set up on the basis of the previous research [11, 13] and the standard methods for other materials such as metal and concrete [23, 24].
4.1. Materials Properties
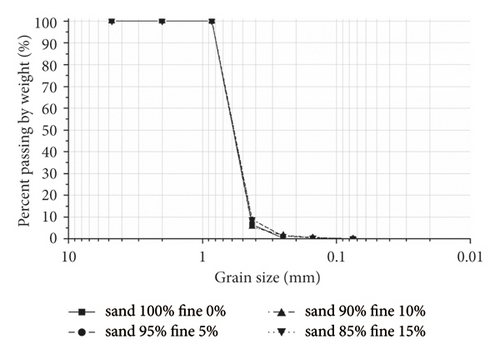
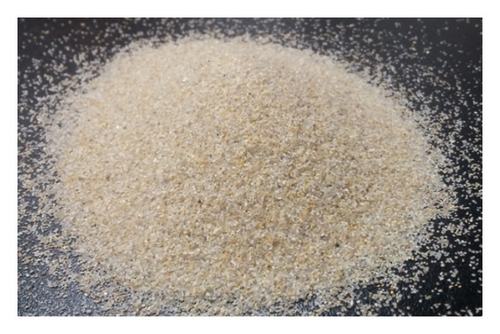
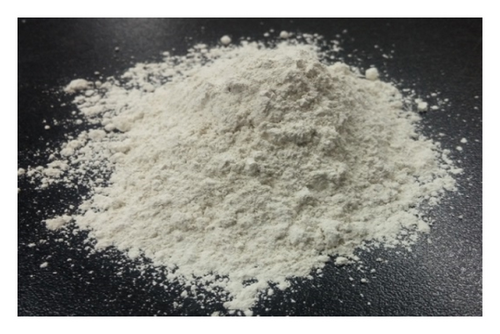
Jumoonjin uniform sand and kaolinite were used in the three-point bending tests, and the index properties of sand and kaolinite such as maximum and minimum dry unit weight, Atterberg limits, and specific gravity are presented in Table 1. The kaolinite and Jumoonjin uniform sand are classified into silt with low plasticity (ML) and poorly graded sand (SP), respectively, following the Unified Soil Classification System. Since these soils have homogeneous physical properties and uniform particle size, they are suitable for laboratory testing to investigate mechanical characteristics of frozen soil. Figure 3 shows particle size distribution of the tested soil, and Figure 4 shows the picture of the tested soil.
4.2. Specimen Preparation
The procedure of the specimen preparation is as follows. At first, distilled water was used to the oven-dried Jumoonjin sand with the specified contents of kaolinite to saturate the specimen fully. However, it is very difficult to make the fully saturated specimen with specified density. Therefore, in this research, the test specimen was made by controlling the water contents and fixing the specimen density to make a homogeneous test specimen. The water contents of the prepared sample is about 21% by weight and degree of saturation of the test specimen is about 85%. Next, the sample was prepared in the specially made split mold and compacted by rammer to reach the relative density about 66%. Although the relative density of the prepared test specimens varies somewhat depending on the fine contents, it represents dense specimen with a range of 60 to 70%. Table 2 shows the summary of the water contents and dry density of the specimen used in this test. Water contents and dry unit weight were almost the same with the±3% errors.
| Temperature (°C) | Fine contents (%) | Water contents by weight (%) | Dry unit weight (kN/m3) |
|---|---|---|---|
| −5 | 0 | 19.71 | 15.16 |
| 5 | 20.55 | 15.41 | |
| 10 | 19.66 | 15.73 | |
| 15 | 20.15 | 15.61 | |
| −10 | 0 | 20.54 | 15.13 |
| 5 | 20.10 | 15.58 | |
| 10 | 20.19 | 15.57 | |
| 15 | 21.09 | 15.71 | |
| −15 | 0 | 20.13 | 15.22 |
| 5 | 20.79 | 15.38 | |
| 10 | 20.22 | 15.73 | |
| 15 | 20.72 | 15.73 | |
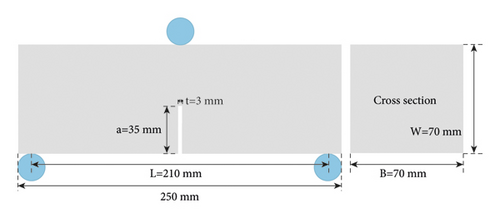
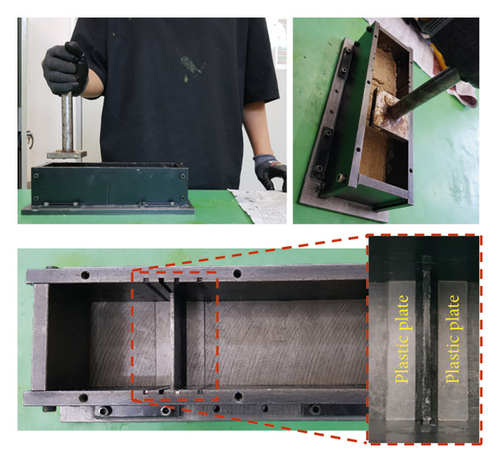
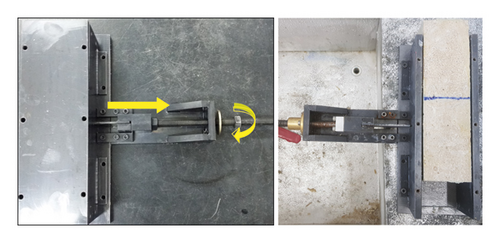
Figure 6 shows specimen preparation for the three-point bending test. The freezing mold was made using heat-treated steel having 5 mm of thickness to prevent volumetric expansion in the freezing process, and ice lens and particle segregation were not observed on the test specimen, as presented in Figure 7. Before freezing the test specimen, a metal plate with 35 mm length and 3 mm width was installed in the bottom center of the specimen to make the notched specimen homogeneously. Two thin plastic plates were also placed on the bottom of the specimen adjacent to the notch to prevent strain gauge errors due to loss of soil particles (Figure 6). After the specimen was frozen in the freezing chamber for 24 hours, time to maintain the constant unfrozen water contents, the metal plate was extruded with the uniform rate using the double nut bolt (Figure 7). The freezing chamber is designed to operate with the error range of±1°C and can be controlled by temperature as low as −20°C. It is well known that the mechanical behaviour of frozen soil greatly depends on the unfrozen water contents [26]. Patterson and Smith [27] showed that the freezing duration more than 11 hours can stabilize the unfrozen water contents for most of frozen soils; the specimens were frozen for 24 hours to maintain unfrozen water contents constant.
4.3. Test Procedure
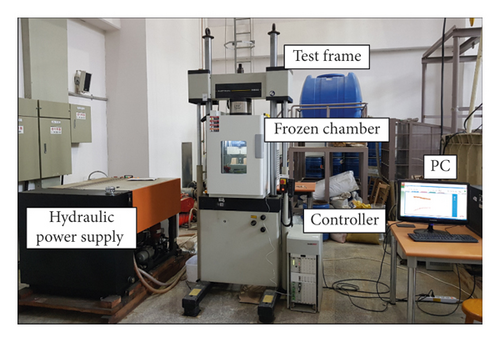
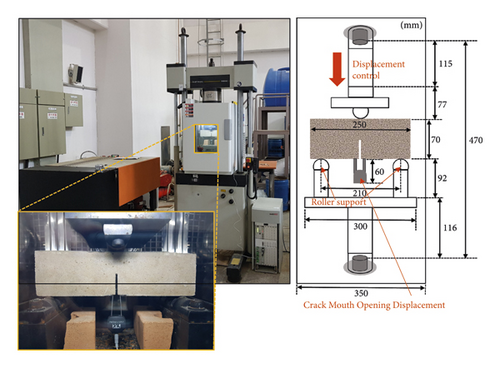
All the fracture tests were performed in the freezing chamber, which can be kept the temperature constant with±1°C errors. Figure 8 presents the testing equipment, and Figure 9 presents schematic diagram of three-point bending test of frozen sand specimen. The tests were performed with an Instron FastTrack 8800 Materials Test Control System, and the test results such as load point displacement and vertical load versus crack mouth opening displacement (CMOD) were monitored automatically with a data acquisition system. A load cell with 100 kN capacity was installed at the top of the frame to measure the applied load, and the accuracy was±0.3%. The extracted specimen was placed on the rolling support plate, which can minimize the binding effect of test specimens; then, a strain gauge which has a capacity and accuracy of 4 mm and±0.1%, respectively, was attached to the lower part of the specimen for measurement of the CMOD. The tests were performed by the controlling displacement rate with 0.1 mm/min until the CMOD reached 4 mm or load was completely lost. The test specimen can be observed through the glazed window installed in the freezing chamber during the test procedure. After testing was complete, testing information such as geometry of the crack, water contents, and dry unit weight were checked using the entire test specimen.
5. Test Results and Discussion
In this research, the three-point bending tests were performed using single-edged notched frozen specimen with 0, 5, 10 and 15% fine contents at −5, −10 and −15°C to investigate the effects of fines and temperature on the fracture behaviour of frozen sand. Based on the load-CMOD curves, fracture toughness and fracture energy was calculated, and the effects of fines and temperature are analysed via load-CMOD curves, fracture toughness and fracture energy.
5.1. Verification of the Test Results
In order to substantiate the validity of the test results, some verifications such as specimen uniformity, validity of KIc, and specimen size determination should be conducted [23]. In this section, the validity of the specimen uniformity was discussed and validity of the specimen size determination will be discussed in next section using KIc value and yield stress of frozen sand specimen.
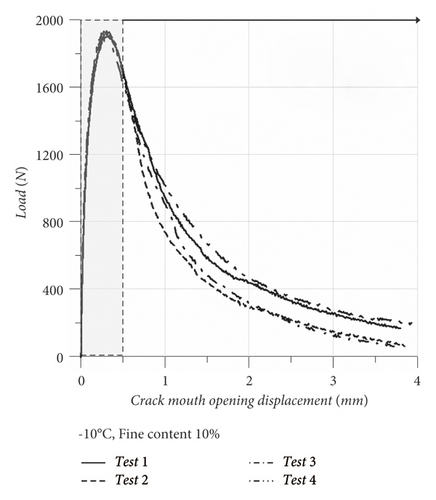
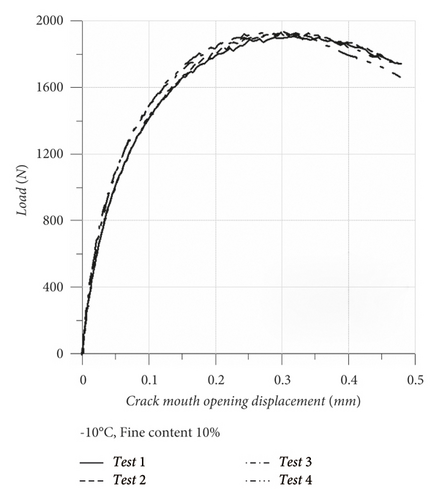
The three-point bending test results of the remolded frozen specimen could be erratic due to the inhomogeneity of the frozen specimen. In order to verify the uniformity of the specimens, four tests were performed under the same temperature and sample condition. Figure 10(a) shows whole four load-CMOD curves, and Figure 10(b) shows load-CMOD curves presented up to 0.5 mm CMOD of frozen sand with 10% fine contents at −10°C. All four test results show almost similar responses from the initial to peak load even though the residual load show some variations. The peak load ranges±1% of the average values. The characteristics of frozen specimen in three-point bending test are more variable after the peak since the crack goes along the surface of the soil particles and ice which is randomly formed as polycrystalline type and a random crystal orientation [28]. However, the early stage of the load-CMOD curve, especially peak load, is more important than the residual stage in determining the fracture toughness of frozen sand. Therefore, all four load-CMOD curves show almost identical responses indicating that the specimens are uniformly prepared and the test results are suitable enough to represent the effect of temperature and fine contents. All other tested specimens show similar range of variations.
5.2. Fracture Behaviour of Frozen Sand
Figures 11(a)–11(c) show the load-CMOD curves of the frozen sand with 0, 5, 10, and 15% of fine contents at −5, −10, and −15°C, respectively. Based on the load-CMOD curves, the peak load increases with the fine contents’ increases until 10% of fine contents, regardless of tested temperature (0% < 5% < 10%). However, contrary to the previously referred trend, the peak load of the frozen sand specimen with 15% fine contents was found to be less than 10% fine contents at −5 and −10°C (10% > 15%). In addition, the peak load of the frozen sand specimen increases with the temperature decreases at a given fine contents, as presented in Figure 12. This can be explained by unfrozen water and ice strength. The specific surface area of the soil particles can affect the amount of unfrozen water in frozen soil at a given temperature [29] and the strength of the ice increase with temperature decreases [30]. As the fine contents increase, the soil-ice interaction such as friction resistance and ice bonding can be reduced by the increased unfrozen water in the frozen soil. Since the decrease in the resistance due to the unfrozen water in the frozen soil is greater than the increase due to the fine contents increasing surface area and friction, it can reduce the peak load of frozen sand with 15% fine contents. However, unlike the test results performed at −5 and −10°C, the peak load of frozen sand specimen with 15% fine contents at −15°C was greater than 10% fine contents. Anderson and Morgenstern [31] presented strength and unfrozen water contents of pure frozen sand converge around −10°C. In other words, in case the temperature of the frozen soil is lower than −10°C, the effect of unfrozen water on the mechanical characteristics of the frozen soil can be neglected. Therefore, enhancement of ice strength due to the temperature decrease can solely affect the increment of the strength from −10 to −15°C, and it affects the tendency of the test results at −15°C. However, the tendency of the unfrozen water contents of the sand with fines can be different from the pure frozen sand. Furthermore, the compressive behaviour of the frozen sand also can be different from the tensile behaviour of the frozen sand. This should be investigated with the further research such as tensile test, measurement of unfrozen water contents, and new analysis method.
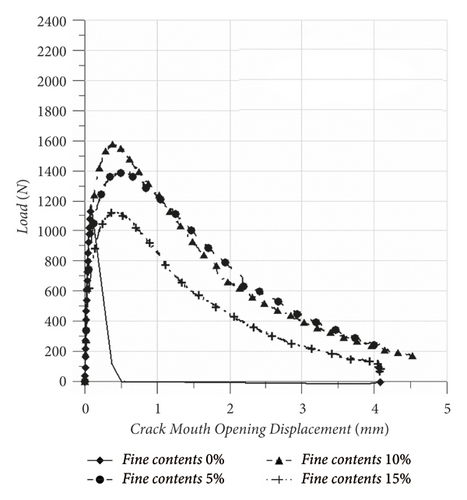
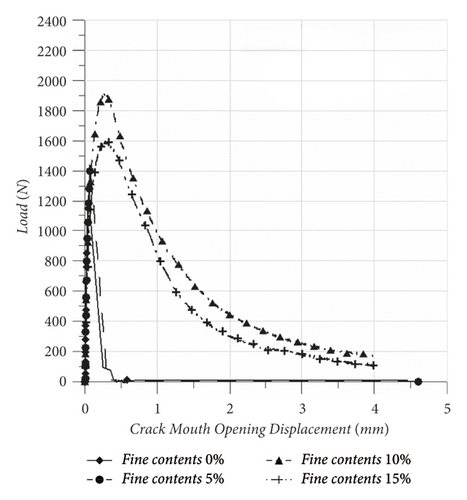
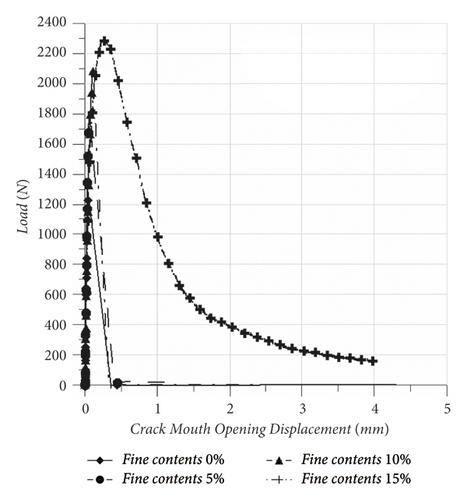
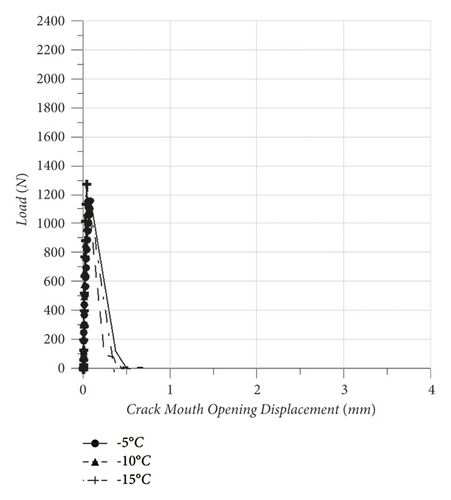
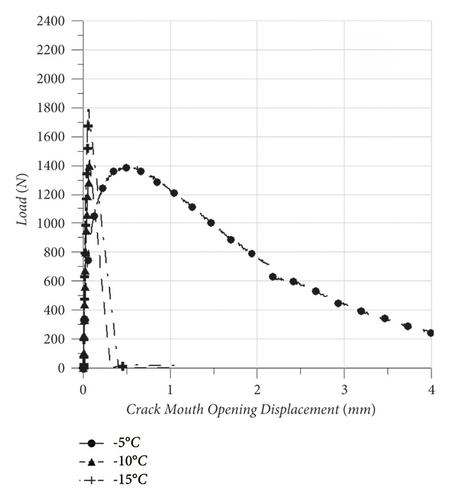
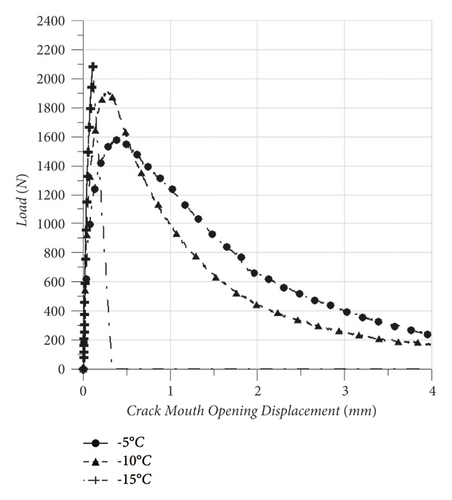
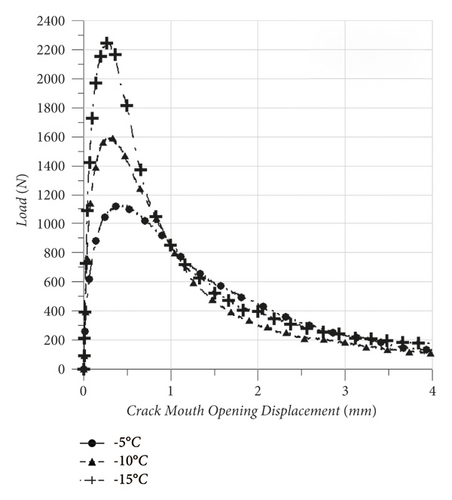
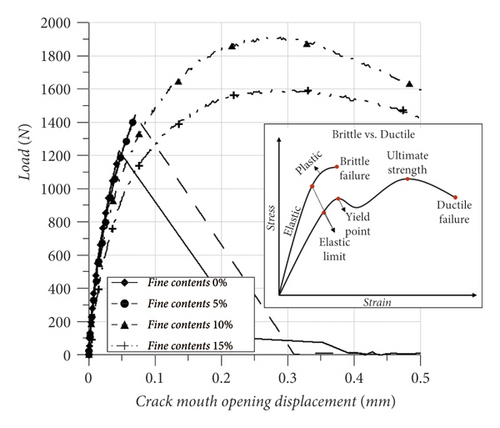
Based on the comparisons of the test results, the fine contents and temperature complexly affect the brittle and ductile response of the frozen sand specimen. Figure 13 shows the enlarged load-CMOD curves at −10°C and definition of the brittle and ductile responses to confirm the brittle and ductile responses of the frozen specimen. Ductile response specimen with 10 and 15% fine contents shows peak load approximately at 0.3 mm CMOD and then gradually reduced to the residual load with the CMOD increases. However, in case of the brittle response specimen with 0 and 5% fine contents, the load was completely lost before the CMOD reaches 0.1 mm which is near the elastic limit.
Overall, as the fine contents and temperature increase, the load-CMOD curves shows more ductile response in which crack grows to the top of the specimen with a significant plastic deformation generated near the crack tip. This can be seen in Figure 14(b) which is a picture of the tested specimens with ductile response after the end of the tests. On the contrary, as the fine contents and temperature decrease, the load-CMOD curves show brittle response. In the brittle fracture response, plastic deformation or ductility was not observed in the specimen before the fracture occurs and suddenly, very rapid cracking of the material can be seen. In the case of brittle response, two phenomena were observed in all the test specimens: there was no deformation on the frozen specimen or the specimen was completely bifurcated. Figure 14(a) shows brittle response of the frozen specimen, and the plastic deformation was not observed near the crack tip even though some microcracks can be observed.
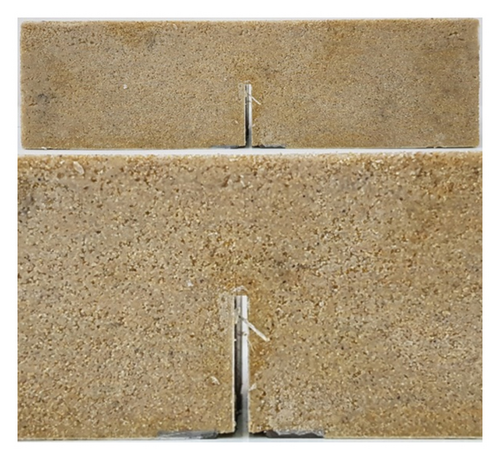
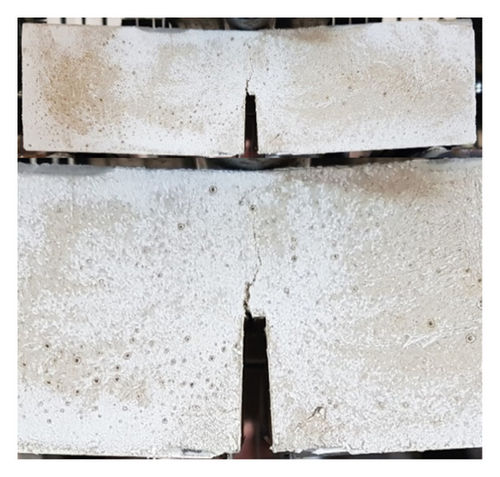
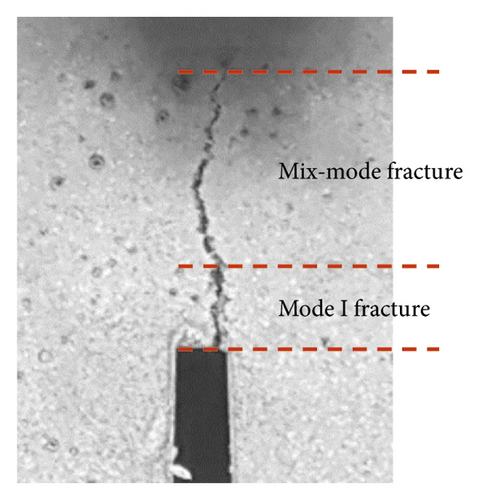
Figure 15 shows separated mode of fracture in accordance with geometry of the crack. Mode I fracture was observed in the early stage of the crack progress, but mixed-mode fracture can be observed with the crack progresses to the top of the specimen. This can be explained by the soil particle and ice grain that make up the frozen soil. As the crack progresses along the surface of the soil particles and ice grains which are randomly formed, it can affect the stress distribution in the plastic area in which crack is proceeded. Furthermore, in fact, it is very difficult to separate mode I and mixed-mode fracture accurately using geometry of the crack only. Therefore, further research is needed to investigate the mixed-mode fracture characteristics of the frozen soil.
5.3. Fracture Toughness of Frozen Sand
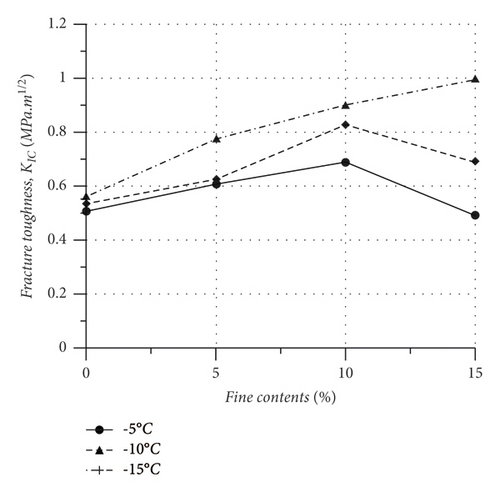
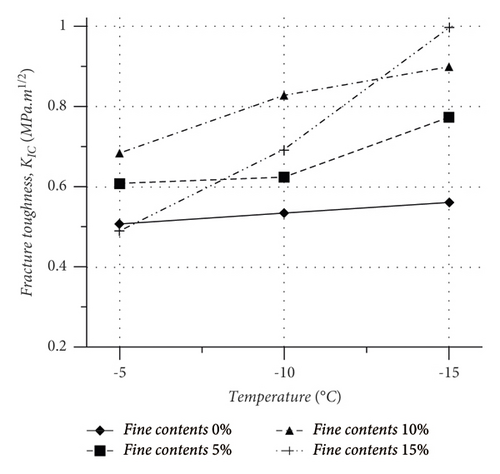
The fracture toughness values of frozen specimen are summarized in Table 3 and presented in Figures 16(a) and 16(b) with regard to the tested temperature and fine contents, respectively. The fracture toughness, KIc, was calculated using the mode I stress intensity factor equation, equation (2). As the fine contents increases, the fracture toughness of frozen sand specimen increases except the frozen sand with 15% fine contents at −5 and −10°C, showing the same tendency with peak load. This can be also explained by unfrozen water contents and ice strength characteristics of the frozen soil depending on the fine contents and temperature. Based on the limited test results presented herein, at all fine contents under the same displacement rate, the fracture toughness values are almost linearly increased with the temperature decreases. Li and Yang [13] performed the three-point bending test to investigate the effects of temperature on the mode I fracture toughness of frozen silty sand from Lanzhou, China. Tests were performed at various temperature (−2, −5, −7, −10, and −15°C) using frozen specimen with 22.3% water contents under loading rate 200 N/s. Based on the test results presented in the previous research, fracture toughness, KIc, varied between 0.275 and 0.685 MPa m1/2 and almost linearly increases with the temperature decreases showing the same tendency of the result presented in this research. Therefore, the temperature affects the fracture toughness of frozen sand and almost linearly increases with the temperature decreases within a certain temperature range, and if more test results are used to derive a relation, the approximate value of mode I fracture toughness can be obtained in a range of temperature and fine contents.
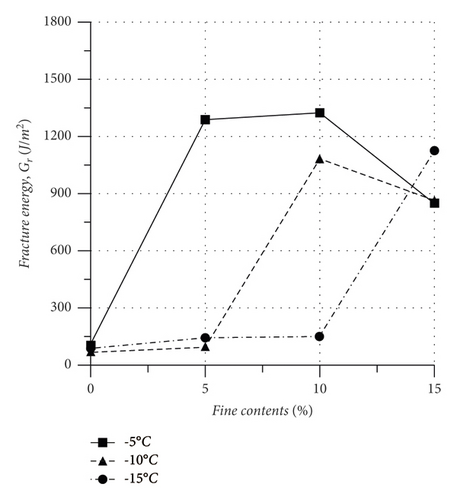
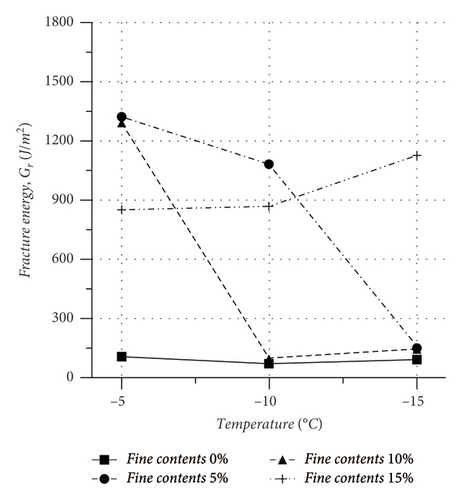
| Temp. (°C) | Fine contents (%) | Max. load, Pmax (kN) | Fracture toughness, KIc (MPa⋅m1/2) | Fracture energy, Gf (J/m2) | Brittle or ductile |
|---|---|---|---|---|---|
| −5 | 0 | 1.176 | 0.507 | 105.06 | Brittle |
| 5 | 1.408 | 0.607 | 1290.57 | Ductile | |
| 10 | 1.589 | 0.685 | 1324.37 | Ductile | |
| 15 | 1.140 | 0.492 | 852.24 | Ductile | |
| −10 | 0 | 1.240 | 0.535 | 71.212 | Brittle |
| 5 | 1.448 | 0.625 | 96.430 | Brittle | |
| 10 | 1.919 | 0.828 | 1081.84 | Ductile | |
| 15 | 1.601 | 0.691 | 866.00 | Ductile | |
| −15 | 0 | 1.304 | 0.562 | 89.38 | Brittle |
| 5 | 1.794 | 0.774 | 144.22 | Brittle | |
| 10 | 2.084 | 0.899 | 151.00 | Brittle | |
| 15 | 2.310 | 0.996 | 1125.88 | Ductile | |
5.4. Fracture Energy of Frozen Sand
In this research, fracture energy was calculated to investigate the effect of fine and temperature on the fracture characteristics of the frozen soil. As mentioned previously, fracture energy can be calculated by the area at the bottom of the load-CMOD curve. In this research, fracture energy was calculated up to the maximum point on the load-CMOD curve. This method can be identified by the concept of the crack initiation, though the overall crack progress cannot be known. In order to calculate the fracture energy accurately, engineering software, MATLAB R2019a, was used in this research. The fracture energy values of the tested specimen are summarized in Table 3 and presented in Figures 17(a) and 17(b) with regard to the tested temperature and fine contents, respectively. Based on the test results, the fracture energy increases dramatically in the section that the fracture behaviour changes from brittle to ductile behaviour. In the same fracture behaviour, fracture energy decreases with the fine contents’ increase, and the effect of the temperature on the fracture energy is not significant under the limited testing condition. This can be explained by the unfrozen water in the frozen soil, increasing with the fine contents’ increase. Therefore, the fracture energy required for the crack initiation can be dominated by the brittle-ductile behaviour of the frozen sand and decrease with the fine contents increase due to the unfrozen water.
6. Conclusions
- (1)
The fine contents and temperature affect the brittle and ductile responses of the frozen sand. As the fine contents and temperature increase, the load-CMOD curves shows more ductile responses. Crack propagation can be influenced by the particle size distribution and orientation of the components.
- (2)
For a given fine contents, the maximum load and mode I fracture toughness increase with the fine contents’ increases under all the tested temperature except 15% fine contents. This can be influenced by the unfrozen water and ice strength characteristics varied with the fine contents and temperature.
- (3)
For a given temperature, the peak load and mode I fracture toughness almost linearly increases with the temperature decreases under all the tested fine contents.
- (4)
The fracture energy required for the crack initiation can be dominated by the brittle-ductile behaviour of the frozen sand and decreases with the fine contents’ increase due to the unfrozen water.
In this research, only one stress condition was applied, but the stress condition of the crack in the frozen ground due to external loads can be very complex and result in a combination of various loading conditions, which is called mixed-mode loading. Therefore, further research studies for investigation of mixed-mode fracture characteristics should be performed by controlling a notch position or loading position to investigate the effect of fracture characteristics on the long-term behaviour of frozen sand. Furthermore, measurement of the unfrozen water should be performed together using a measuring device such as TDR (time domain reflectometer) to investigate the effect of unfrozen water on the fracture characteristics of the frozen sand.
Conflicts of Interest
The authors declare that there are no conflicts of interest regarding the publication of this paper.
Acknowledgments
The research was funded by the National Research Foundation of Korea (NRF-2020R1F1A1072617 and NRF-2018R1A6A1A07025819).
Open Research
Data Availability
All the data used in this research are provided within the article and numeric data can be obtained from the corresponding author upon request.


