An Improved Force Characteristic Curve Fitting Algorithm of Urban Rail Vehicles
Abstract
In this paper, an improved force characteristic curve fitting memetic algorithm of urban rail vehicles is proposed for establishing precise train operation models. In order to improve the memetic algorithm global convergence, three strategies are adopted. In the improved memetic algorithm framework, an improved moth-flame optimization is used in global search; an improved simulated annealing is applied in local search; a new learning mechanism incorporated into reverse learning is adopted. Experimental simulation results under real-time data monitoring system show that the improved memetic algorithm proposed in this paper can increase the optimization performance effectively so more perfect force characteristic curve fitting effort can be obtained, and the calculated average force error and max running distance error can be reduced effectively. Moreover, the above relative results indicate that the train energy consumption model using the improved force characteristic curve fitting algorithm can obtain more precise energy consumption. Obviously, the improved force characteristic curve fitting algorithm can effectively improve the curve fitting precision.
1. Introduction
The accuracy of force characteristic curve fitting has a great influence on the force characteristic analysis, the train operation models establishment, and the train operation process simulation result [1].
The train operation models are extremely important for the train operation process, in the safety, comfort, and economy of the urban rail transit operation. Various improved methods and algorithms have been proposed in recent works about the train key parameters identification and calculation and the train operation model establishment. In the field of modern urban rail transit, operation quality and cost are two key factors, which are closely related to the accuracy of the vehicle operation models. A method for calculating traction characteristics of traction motor is proposed [2]. The inrush current identification system is established, the inrush current identification algorithm is realized, and it is applied to the digital signal processing of the traction transformer [3]. A new method to identify the train key design variables against the running performance indicators based on the sensitivity analysis is proposed, which is in turn based itself on simulation-oriented surrogate models [4]. A new system for moving train loads and parameter identification is proposed. In this system, time history displacements of measurement stations on the bridge are simultaneously measured by using a displacement image monitoring system when the model train moves across the bridge [5]. A new numerical method for moving train parameters identification is proposed. This method is adopted to simulate the experimental system and to investigate the effect of the system on the identification of the moving train parameters [6]. Aiming at estimating the vehicle suspension parameters, the estimation of the parameter values is performed by minimizing a misfit function describing the distance between the measured and the simulated vehicle response, and an optimization algorithm is applied in order to find the best parameter estimation [7]. It is obvious that studies about train parameters calculation and train operation model establishment can be found in the existing literatures. However, the research on force characteristic curve fitting for urban rail vehicles is absent.
Because there are many uncertain factors and complex relationships in rail transit vehicles, it is easy to fall into local convergence only using traditional optimization algorithms (genetic algorithm, particle swarm optimization algorithm, fruit fly algorithm, etc.). Aiming at the problem that the traditional automatic optimization algorithm is easy to fall into local convergence, many literatures have proposed various improved traditional optimization algorithms. A new hybrid annual power load-forecasting model based on the least-square support vector machine (LSSVM) and moth-flame optimization (MFO) algorithm was proposed in [8]. A moth-flame optimization (MFO) technique was investigated for obtaining an accurate simulation of the nonuniform electric field represented by needle-to-plane gap configuration in [9]. A multiobjective decomposition-based moth-flame optimization (MOMFO/D) algorithm was proposed in [10] that decomposes the objectives into multiple single objectives which are optimized simultaneously. The ability of two nature-inspired algorithms namely the whale optimization algorithm (WOA) and moth-flame optimization (MFO) was examined in [11] to determine the optimal multilevel thresholding for image segmentation. An improved quantum evolutionary algorithm (QEA) based on the niche coevolution strategy and enhanced particle swarm optimization (PSO), namely IPOQEA, was designed [12]. A novel learning scheme for the kernel extreme learning machine (KELM) based on the chaotic moth-flame optimization (CMFO) strategy was proposed in [13]. A hybrid moth-flame optimization algorithm (HMFO) was proposed in [14], and the convergence ability of the HMFO algorithm was analyzed on the basis of test functions. To improve the diversity of flames and the searching ability of moths, an improved moth-flame optimization (IMFO) algorithm was proposed in [15]. A novel memetic algorithm (MA) based on the integer-coded genetic algorithm and local search was proposed in [16]. A hybrid learning algorithm combining genetic algorithm (GA) with gradient descent (GD), called HGAGD, was proposed in [17]. A novel memetic algorithm was proposed in [18], which is explorative particle swarm optimization (ePSO), combined with mesh adaptive direct search, and it was applied to the design of a permanent magnet synchronous machine (PMSM). A memetic algorithm was proposed in [19] for solving the traveling salesman problem, which is based on the combination of an evolutionary algorithm and local search (2-opt). The above research can improve the optimization performance of traditional optimization algorithms. However, force characteristic curve fitting optimization of urban rail vehicles based on improved memetic algorithm has not been considered.
In order to improve the force characteristic curve fitting accuracy of the urban rail vehicle force characteristics, so as to establish reasonably accurate train operation models, based on the urban rail vehicle running force characteristic curve optimization model and the actual collected operational data, an improved memetic algorithm is proposed for force characteristic curve fitting in this paper. In order to verify the effectiveness of the proposed algorithm, this paper uses real-time data monitoring device to collect the actual data (real-time instantaneous velocity and force) of the Lanzhou Line No.1 subway vehicle. Several different optimization algorithms are used in the test platform for comparative testing. The results show that the proposed memetic algorithm has excellent optimization performance.
- (1)
The improvement of the memetic algorithm: to solve the problem of falling into local convergence easily of traditional algorithms, this paper proposes a novel improved memetic algorithm with powerful optimization ability. The reconstructed optimal frame can effectively improve the optimization capability, an improved moth-flame optimization is incorporated into the global search; an improved simulated annealing is applied in the local search; and an improved learning mechanism incorporated into reverse learning is adopted for increasing evolution efficiency. The experimental simulation results show that compared with the traditional algorithms, the improved memetic algorithm can effectively improve the optimization performance
- (2)
The improvement of force characteristic curve fitting and train operation model establishment: aiming at the problems that the force characteristic curve fitting and train operation model establishing are not precise enough; this paper proposes to use improved force characteristic curve fitting algorithm for obtaining more appropriate force characteristic curve. The experimental simulation results show that compared with the traditional force characteristic curve fitting algorithms, the precision for force characteristic curve fitting and train operation model establishment could be improved to a certain extent
The paper is organized as follows. Section 2 introduces the mathematical model for force characteristic curve fitting. Section 3 illustrates the improved memetic algorithm. Section 4 provides the experimental simulation results to illustrate the proposed method. Section 5 concludes this article.
2. Mathematical Model of Force Characteristic Curve Fitting
2.1. Force Characteristic of Urban Rail Vehicles
2.2. Optimization Models for Force Characteristic Curve Fitting
The above optimization model can be solved by the conventional systematic identification methods such as the le4ast square method, but the solution accuracy is not ideal. For the optimization model which is not easy to be solved by conventional systematic identification methods, it is easy to obtain more satisfying optimization results by using intelligent algorithms such as the genetic algorithm (GA), particle swarm optimization (PSO), and ant colony optimization (ACO). Still, these intelligent optimization algorithms have poor global searchability in the last stage of iteration, which makes the improvement of the optimization solution accuracy lower than expected [20].
3. Improved Memetic Algorithm for Force Characteristic Curve Fitting
3.1. Synopsis of Memetic Algorithm
The memetic algorithm that evolved from the simulation of memetic evolution is proposed by Pablo Moscato in 1989. It is a hybrid optimization algorithm based on global search and local heuristic search. The memetic algorithm is an algorithmic framework similar to GA [21].
3.2. Segmented Fitting Function of Force Characteristic Curve
This fitting method is easy to obtain a force characteristic fitting curve close to the actual curve. Meanwhile, there are no exponential function, logarithmic function, and other complex functions.
3.3. Improved MFO for Global Search
The moth-flame optimization (MFO) is a new group intelligent optimization algorithm proposed by Mirjalili in 2015. It is a bionic intelligent optimization algorithm used to simulate the motion behavior of moths flying on a near-flame spiral curve [22]. Although MFO has perfect optimized performance, since the MFO always makes all moths rotate around the flame, this single optimization model tends to fall into local convergence easily. So, an improved MFO algorithm is proposed in this paper, which is a hybrid optimization algorithm incorporated into the particle swarm optimization. The calculation steps of the specific hybrid algorithm are as follows:
Step 2: obtain the individual extremum of each moth and the global extremum of the current moth population
where f_nmax represents the maximum number of flames, T represents the maximum number of iterations, round(X) represents the rounded value of the number X, and l represents the index of the current iteration
Step 7: if the index of the current iteration l is equal to the maximum number of iterations T, the iteration is over; otherwise, Steps 2–7 are executed repeatedly.
3.4. Improved SA for Local Search
Simulated annealing (SA) was first applied to the field of combinatorial optimization by Kirk-Patrick et al. The principle of the simulated annealing algorithm is based on the cooling process of the metal. During this cooling simulation process, new solutions are continuously generated and accepted according to the Metrolips standard, and a number of some better optimal solutions can be obtained. SA is a greedy algorithm with strong local searchability that is often used in the local search [23]. In order to increase the speed for generating new solutions, this paper gives the following improved strategy using the univariate equation of the n-degree. The steps of improved simulated annealing for local searching are as follows:
Step 1: initialize initial temperature T0, termination temperature Tend, and cooling coefficient α. Make the current temperature Tc = T0 and the current iteration index isa = 1
Step 2: the current optimal moth individual obtained by IMFO is selected as the initial solution X0
Step 3: partial parameters in the decision variables and of Xisa−1 remained, and the other parameters that are not retained in the decision variables are replaced by a slightly different value. This newly generated solution is called the pending solution (recorded as Xp)
Step 4: according to the above segmented fitting function, ((9)) used the univariate equation of the n-degree, substituting multiple sets of actual speed and force values into the left and right sides of the equation. If it can be guaranteed to accept the difference (less than the threshold given), execute from Step 5; otherwise, execute from Step 6.
Step 6: make Tisa = Tisa−1, Tc = Tc × α, and isa = isa + 1. If the current temperature Tc < Tend, the iteration is over; otherwise, Steps 2–6 are executed repeatedly.
3.5. Improvement of the Learning Mechanism for Memetic Algorithm
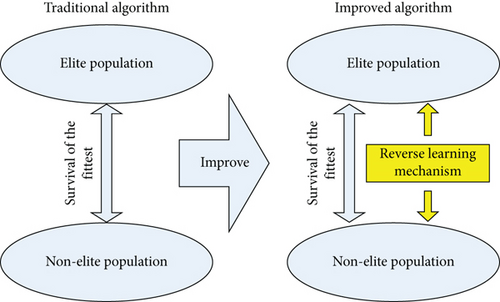
The memetic algorithm is an optimization algorithm based on the “competition mechanism” and memetic evolution. In the long-term evolution process, the elite group has accumulated its own advantages, and a certain degree of domination is formed. At the end of the iteration, due to the limitations of the evolutionary environment and initial population, it is difficult to evolve continually. The reason is that it is difficult for nonelite individuals to enter the elite group, and it is difficult for the elite groups to evolve further. This limitation makes the memetic algorithm easy to fall into local convergence. In order to improve the optimization performance, a new learning mechanism incorporated into reverse learning is proposed for the memetic algorithm in this paper, and the improved memetic algorithm is denoted as IMFO. The specific schematic diagram and flow chart are shown in Figures 1 and 2.

4. The Experimental Simulation
4.1. Real-Time Data Monitoring Device
The real-time data monitoring device is an indispensable crucial component of ATO control systems, which is composed of speed sensors, torque meter, displacement pickup, slide and slip detection installation, and speed analyzer. The schematic diagram of the real-time data monitoring device is shown in Figure 3.
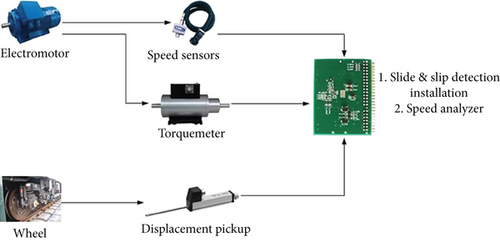
In Figure 3, the speed sensors, torquemeter, and displacement pickup are data acquisition devices for collecting real-time motor speed, motor torque, and physical displacement; wheels and motors are monitored objects; slide and slip detection installation is the computing equipment for calculating the severity degree of train idling and taxiing; speed analyzer is the core equipment used to obtain the precision instantaneous velocity based on analyzing and processing the acquired real-time data.
To obtain real-time velocity accurately, a new type of networked intelligent digital torque sensor (model No. JN338) is adopted. The specific physical diagram of networked intelligent digital torque sensor is shown in Figure 4.
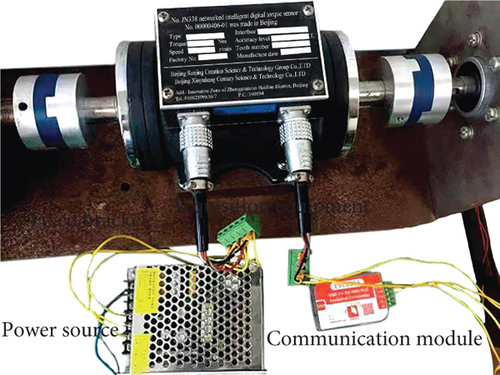
In Figure 4, the acquisition equipment is a torque sensor of model No. JN338, which contains the actual functions of the two main components (speed sensors and torquemeter) in Figure 4; the fixed bracket is made of iron and has two functions of fixing and preventing jitter; the power source supplies electricity to torque sensor of model No. JN338; the communication module transmits the real-time value of motor speed and torque using the 485 communication protocol.
4.2. Force Characteristic Curve Fitting Experiment Simulation
The urban rail vehicle velocity monitoring device is used for collecting relative data sets that fit the experiment simulation required in AW3 load of the Lanzhou rail transit line number 1, including the force characteristic curves and its tracking control running distance curves on the straight track. The specific characteristics curves are shown in Figures 5 and 6.
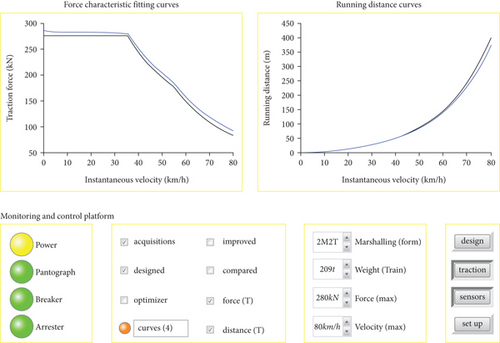
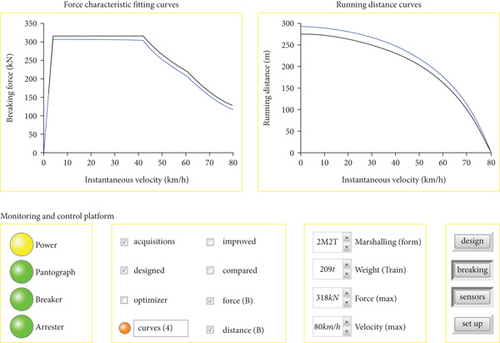
As can be seen from Figures 5 and 6, the urban rail vehicle velocity monitoring device is in a normal working state, and some significant parameters are displayed at the “Monitoring and Control Platform”; 8 curves about force characteristics and its tracking control running distance on the straight track are displayed at the display area. Among the above data sets, the traction force characteristic curves have changed from static to maximum velocity, and the braking force characteristics are the opposite. Since the actual force characteristic curves are different from their expected design, the running distance results also have corresponding differences. The actual force characteristic curves are collected by dozens of times of actual sampled and complex postprocessing (massive data analysis and error data filtering), to avoid the imprecision caused by random sampling. Some facts can be seen in Figures 5 and 6. The actual traction capacity of the above train is slightly higher than the initial design standard, because it is hoped that the traction performance of the train has a certain margin in special circumstances (e.g., in rainy weather; ATO is easy to tend to slip.). The traction motors with slightly stronger traction ability for ensuring that the train has sufficient traction in any conditions were manufactured by traction motor manufacturer. Due to long running time, the actual braking capacity of the above train is slightly lower than the initial design criteria. The abrasiveness of the wheel rim is slightly more serious and affects the braking performance.
The least-square method (LSM) [24], genetic algorithm (GA) [25], traditional memetic algorithm (MA) [26], and improved memetic algorithm proposed in this paper (IMA) are used to obtain the force characteristic fitting curves and related results based on above collected actual data sets. The global search algorithm of the traditional memetic genetic algorithm is a genetic algorithm, and the simulated annealing algorithm is used in the local search. The essential parameters of SA are set as follows: the initial temperature is 400°C, the cooling coefficient is 0.8, and the termination temperature is °C; the essential parameters of GA are set as follows: the number of individuals is 20, the cross-over probability is 85%, the mutation probability is 4%, and the maximum number of iterations is 300; the essential parameters of reverse learning are set as follows: the reverse learning rate is 20%; the essential parameters of MFO are set as follows: moth number is 20, the number of flames is 10, the constant of logarithmic spiral morphology is 1, and the maximum number of iterations is 300; the essential parameters of PSO are set as follows: the inertia weight coefficient is 0.9, and the learning factors are 0.1.
The fitting experiment simulation is based on the real-time data monitoring device. The DSP programming environment is adopted, and the core chip of the system is “TMS320F28335,” the monitoring software revision is “VS2015,” the monitoring computer processor is “Core i7-7700K @ 4.2 GHZ,” and the core chip programming software revision is “CCS5.5.” The specific corresponding simulation results of the force characteristic curve fitting are as follows. The specific characteristics curves fitted by various algorithms are shown in Figures 7 and 8.
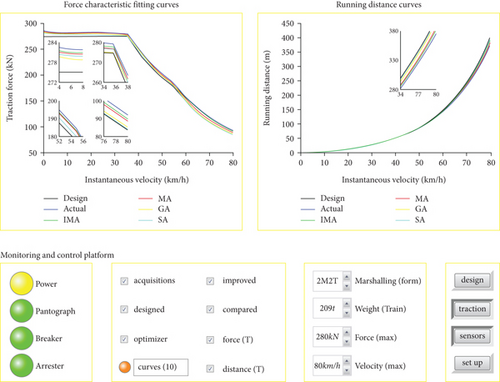
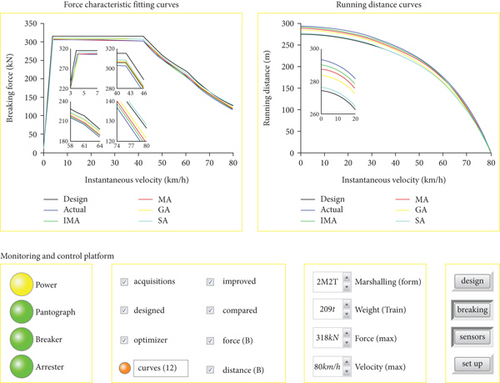
As can be seen from Figures 7 and 8, both the urban rail vehicle velocity monitoring device and the force characteristic curve fitting (FCF) optimizer are in a normal working state concurrently. IMA and the other three comparison algorithms are used in fitting experiment simulation, and the 24 curves about force characteristic and its tracking control running distance on the straight track fitted by various algorithms are displayed at the display area. As can be seen from the curves fitted in Figures 7 and 8, the fitting curves obtained by IMA are closer to the actual than other fitting optimization algorithms used for comparison. This indicates that the IMA has a more powerful optimization ability in force characteristic curve fitting.
In this paper, the force characteristic fitting curves are segmented by the univariate equation of the 4-degree. The average force error and max running distance error calculated by using various algorithms are shown in Table 1. The univariate equation coefficients of the 4-degree of the traction and braking force characteristic fitting curves are shown in Tables 2 and 3.
| Algorithm | Traction force error (kN) | Traction distance error (m) | Braking force error (kN) | Braking distance error (m) |
|---|---|---|---|---|
| LSM | 3.485 | 38.171 | 3.144 | 16.730 |
| GA | 2.872 | 29.510 | 2.747 | 9.255 |
| MA | 1.970 | 13.176 | 1.507 | 5.493 |
| IMA | 0.928 | 7.857 | 0.856 | 3.235 |
| Algorithm | V1 = {0, VTC} | V2 = {VTC, VTR} | V3 = {VTR, Vmax} |
|---|---|---|---|
| LSM |
|
|
|
| GA |
|
|
|
| MA |
|
|
|
| IMA |
|
|
|
| Algorithm | V2 = {VBS, VBC} | V3 = {VBC, VBR} | V4 = {VTR, Vmax} |
|---|---|---|---|
| LSM |
|
|
|
| GA |
|
|
|
| MA |
|
|
|
| IMA |
|
|
|
As can be seen from Table 1, compared with other algorithms, the switching velocity and its corresponding force and running distance obtained by IMA are closer to the actual situation. The improvement effect of the error between fitting curves and actual curves is more significant by IMA. The average force error and max running distance error are smaller than 1 kN and 10 m, respectively. It can indicate that IMA has better fitting performance than traditional improved algorithms. In Tables 2 and 3, the coefficients of the subsection fitting polynomials obtained by a certain algorithm are given in corresponding cells sequentially. A specific example is explained as follows. The first cell of Table 1 shows the fitting relationship between the traction force and velocity in the constant torque region, and the specific fitting polynomial is Fr(v) = 3.5271 × 10⁻⁵ × v4 − 3.0253 × 10⁻³ × v3 + 0.0817 × v2 − 0.8229 × v + 282.4155.
4.3. Train Energy Consumption Calculation of Experiment Simulation
Compared with the improving fitting effort of force characteristic curve fitting algorithm, improving the precision of the actual calculation effect for the train operation model is more practical. The train energy consumption is a vital performance index for the train operation process. To further verify the effectiveness of the proposed algorithm, the train energy consumption calculation of the experiment simulation is chosen.
The practical train energy consumption calculation of the experiment simulation example which has an inquiry value should be chosen. The station area between Dongfanghong Square and Lanzhou University of Lanzhou Line No.1 subway is chosen as the experiment simulation object. Lanzhou rail transit line number 1 is a significant urban rail transit line extending from Chen Guanying to Donggang Station, which has 20 stations, which started the official operation on June 23, 2019. The running distance of the above station area between two stations is 1.63 km, with a long downhill near Lanzhou University, which has the characteristics of a great stream of people in daily operation, moderate running distance, and a certain extent of complexity.
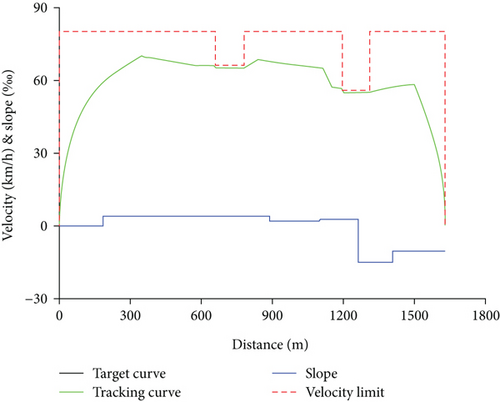
The train operation process scenario in the night period (20:00-23:00) is chosen for the experiment simulation object. The slope and velocity limit of all position points for the running line were known, and the target velocity curve has been optimized by the optimization algorithm of the automatic train operation (ATO) optimizer. The one-time whole running tracking control velocity and force data in nighttime were collected by a real-time data monitoring device. The specific velocity and slope curves for the station area between Dongfanghong Square and Lanzhou University in the night period can be drawn and are shown in Figure 9. The main parameters of the above train operation process scenario for the train energy consumption calculation of the experiment simulation are shown in Table 4.
| Maximum running speed (km/h) | Prospective running time (s) | Maximum allowable parking error (m) | Maximum allowable punctual error (s) |
|---|---|---|---|
| 80 | 110 | ±0.2 | ±0.4 |
The train energy consumption for prospective and practical tracking control are 65331 and 68470 kJ, respectively. The train energy consumption model using LSM [25], GA [26], MA [27], and IMA is used to calculate the train energy consumption for the whole train operation process, respectively. The specific train energy consumption calculation of the experiment simulation result obtained by each algorithm is shown in Table 5.
| Algorithm | Prospective energy consumption (kJ) | Practical energy consumption (kJ) | Prospective error rate | Practical error rate |
|---|---|---|---|---|
| LSM | 65257 | 68338 | 1.135 × 10⁻³ | 1.924 × 10⁻³ |
| GA | 65275 | 68365 | 8.590 × 10⁻⁴ | 1.537 × 10⁻³ |
| MA | 65312 | 68433 | 2.976 × 10⁻⁴ | 5.359 × 10⁻⁴ |
| IMA | 65328 | 68464 | 4.462 × 10⁻⁵ | 8.140 × 10⁻⁵ |
As can be seen from Table 1, compared with other algorithms for contrast, the train energy consumption obtained by the train energy consumption model using IMA is closer to the actual situation; the improvement effect of calculation error for the train energy consumption model is more significant by IMA. The calculation error rates are smaller than 10−4, respectively.
5. Conclusions
Based on the force characteristics of urban rail vehicles and other related conditions, an improved force characteristic curve fitting algorithm is proposed. Aiming at the problem of falling into local convergence easily of traditional algorithms, an improved memetic algorithm with powerful global optimization performance is utilized using three strategies. Firstly, combining moth-flame optimization and particle swarm optimization, it established a hybrid algorithm to facilitate global search. In order to improve the performance of the local search optimization algorithm, an improved simulated annealing is applied in local search. Meanwhile, an improved learning mechanism incorporated into reverse learning is adopted for overcoming the shortcoming of evolution difficulty.
To verify the effectiveness of the proposed improved force characteristic curve fitting algorithm, experimental simulations based on a real-time data monitoring system were carried out. The results indicate that, compared with the algorithms contrasted, the proposed algorithm has better performance and the relative fitting curves are closest to the actual curves. In addition, the train energy consumption model using the proposed algorithm can be further improved to achieve more accurate results. In summary, the proposed algorithm can greatly improve inaccurate defects of calculation results.
Conflicts of Interest
The authors declare that they have no conflicts of interest.
Acknowledgments
This work is supported by the National Nature Science Foundation of China (60574018), National Science Fund cultivation project of the Inner Mongolia University for Nationalities (NMDGP17101), and Inner Mongolia University for Nationalities doctoral research initiation Fund Project (BS416).
Open Research
Data Availability
No data were used to support this study.


