[Retracted] Comprehensive Quantification and Model Optimization of Sports Industry Layout Structure under the Guidance of Location Entropy Intelligent Sensor
Abstract
The field bus control system based on field bus is a multidisciplinary emerging technology with intelligent sensor, automatic control, computer, communication, network, and other technologies as the main content. All have broad application prospects. In this paper, the CAN bus technology in the field bus is combined with the sensor, and the OPC technology is used to realize the acquisition of the underlying data in the application and control system. In this paper, the industry agglomeration model, the leading industry model, the urban gravity model, and its index are calculated, and the agglomeration effect, leading industry, and urban gravity of the sports industry in two provinces and one city in a certain region are judged from the micro level. Location entropy and relative density of technical elements, scale effect function, product income elasticity coefficient, market share, and other economic indicators are compared and described, and the sports leading industry and sports industry growth pole area are deduced, and the corresponding industrial development stage is judged. We analyze the strength of the polarization effect and diffusion effect of the sports industry in the above-mentioned regions. Economic factors, social factors, and traffic road factors are selected to analyze the driving force of the distribution of gymnasiums. According to the results of binary and multivariate correlation analysis, it is found that the gross domestic product is very important to the development of the sports industry and directly determines the regional demand for sports. There are sports industry forms that are clustered in areas with high economic levels; population density is selected as the representative of social factors, and the research results show that population density has a strong correlation with the number of sports industry distributions. The reason is that the development of the sports industry ultimately depends on demand. It is difficult to form a concentrated demand for related sports activities in areas with small population density, so the distribution of the sports industry is also very small; and the transportation factor is the main factor affecting economic development and population flow. Therefore, it also indirectly affects the spatial layout of the sports industry.
1. Introduction
The unbalanced development of the sports industry is not suitable for the current China. After nearly 40 years of reform and opening up, unbalanced regional development has become the core problem hindering further economic and social development. Current economic development emphasizes “common prosperity” and the use of balanced development to solve the problem of weak growth [1]. This requires that sports industry should also develop in a balanced way. On the one hand, the current problem of unbalanced regional development can be solved through the balanced development of the sports industry. In terms of boosting and promoting economic development, this is very important both for regions with relatively good economic development and for regions with relatively backward economic development [2].
The sports industry has a strong correlation and degree of integration. Through industrial correlation and integration, many new types of combined business formats can be generated and grow rapidly, which has a strong radiation and ripple effect on the national economy [3]. The acquisition of the sustainable development power of the sports industry depends on the successful transformation of the potential capacity of the industry from quantity to quality, from implicit to explicit [4]. Correctly and scientifically evaluating the potential of the sports industry will help us to accurately grasp the “stamina” in the context of the rapid development of the sports industry, so as to scientifically promote the development of the regional sports industry. The research on the development potential of the sports industry is a comprehensive measure of the development prospects of the regional sports industry, but the current research at home and abroad is relatively insufficient [5]. This paper discusses the influencing factors of sports industry potential and its mechanism of action, constructs an evaluation index system and conducts quantitative research, improves and enriches the relevant content of sports industry potential research, and makes people’s understanding of sports industry potential more in-depth. By stratifying and comprehensively evaluating the potential of the sports industry, it is beneficial to correctly understand the development status and restrictive factors of the sports industry, provide technical support for formulating a scientific sports industry development strategy, and provide a reference for the sports industry to clarify its development orientation and industry development model [6–8].
This paper introduces the field bus technology and intelligent sensor technology, and studies the CAN bus technology, and analyzes the characteristics of the CAN bus and its hierarchical structure. On the basis of COM/DCOM, the OPC technology is researched, the related OPC specifications and their integration with CAN bus are introduced, and the realization structure of the smart sensor is introduced. This paper will provide a method to determine the layout and structure of the sports industry, and build a model of the layout and structure of the sports industry accordingly. Specifically, based on the statistical data and estimated data of industrial development, we use the Douglas function for comprehensive operation and finally get the sports industry layout and structure model. The population density has a strong correlation with the spatial distribution of the sports industry in a certain area. The reason is that the development of the sports industry ultimately depends on demand. It is difficult to form a concentrated demand for related sports activities in areas with small population density, so the distribution of the sports industry is also rare. Traffic factors, as the main factor affecting economic development and population flow, also indirectly affect the spatial layout of the sports industry. The specific manifestation is that the distribution of the sports industry is in a state of aggregation near the roads with high traffic flow, and the first-class roads and urban areas with high traffic flow are concentrated. The distribution of sports industry is positively correlated, while the correlation between secondary roads and tertiary roads is not significant. Gymnasiums and sporting goods stores in a certain area have serious fault distribution and cannot form equalized services that match the growing demand for sports and fitness, resulting in a large amount of time cost for queuing for appointments. The industrial agglomeration form in the central city has not been effectively classified, and the geographical space symbolic node with landmark function has not been formed. In terms of functional dislocation competition, content horizontal division of labor, and spatial echelon layout, there is still a need for further improvement. Mutual cooperation, vertical division of labor, and networked hierarchical clusters have not yet been formed.
2. Related Work
American academic circles define the sports industry as “a general term for a series of related economic activities centered on sports activities,” which is divided into two aspects: sports products and activities and sports-related economic activities [9]. Specific industry sectors include professional/quasi-professional sports teams, university/secondary intercollegiate sports league organizations, urban/regional leisure organizations, sports and fitness clubs, and individual sports professional athletes/sports injury protectors/instructors/competitive sports owners.
Relevant scholars define the sports industry as “an industry that provides goods, places and services to meet the needs of national sports culture” [10]. In recent years, it has also been defined as an industry that produces and provides sports and sports-related wealth and services, covering the sports-related parts of various industrial fields such as construction, manufacturing, retail, communications, and services, including profit-making activities [11]. The researcher believes that the sports industry is a broad composite industry that is directly related to sports itself, and he summarizes the sports industry as including sports-related facilities, broadcasting rights fees, professional players’ annual salary, and the World Cup Sports tourism-related expenditures such as watching games and overseas ski trips are a myriad of items [12].
Relevant scholars believe that the definition of the concept of sports industry should conform to the rules of industrial economics theory and logic [13]. First, it conforms to the industry definition of “economic activities with the same attribute” and the industry division rules based on the same commodity market; secondly, the production process and technical process of sports, sports services, or labor products are similar, which is consistent with technology; finally, industries that produce or provide sports, sports services, or labor products in the form of live labor meet the criteria for the three industry classifications [14].
Relevant scholars believe that the standard to distinguish the sports industry from the non-sports industry is to see whether the sports products provided by the industry are physical products or services, and the collection of sports enterprises that provide services rather than physical sports products is the sports industry [15]. The sports industry is listed as the tertiary industry both at home and abroad, and the provision of services or labor is the fundamental feature of the tertiary industry.
Relevant scholars have proposed that the sports industry is the sum of the economic activities that can enter the market and obtain economic benefits in the sports business, that is to say, the profitable part of the sports business is the sports industry [16]. The main theoretical basis of this view is the theory of market economics. To determine whether an industry is an industry, first of all, it depends on whether there is input and output, and secondly, the products must enter the market for exchange. Any industry is a real commodity-currency relationship in the market. If there is no market, there will be no sports industry.
Relevant scholars believe that according to the definition of industry in industrial economics, “industry is the sum of similar economic activities or a collection of enterprises that produce products with the same attributes,” only enterprises that produce and provide sports services or labor services belong to the same type of economic activity [17]. The sports industry is an industry that uses sports’ own functions and radiation effects to create value. Sports products include sports material products and sports service products, and their statistical caliber spans multiple industries in the second and third industries, showing strong industrial correlation and multiplier effect [18–20].
Relevant scholars pointed out that the sports industry plays a huge role in promoting economic growth, enhancing the physique of modern people, enriching people’s spiritual life, and improving the city’s popularity and comprehensive competitiveness [21, 22]. The economically developed central city is basically the gathering place of the regional sports center city and the regional sports industry [23–25].
3. Methods
3.1. Implementation Method of Smart Sensor
The realization structure of intelligent sensor mainly includes non-integrated realization and integrated realization. A non-integrated smart sensor is a smart sensor that combines traditional classical sensors (sensors made with non-integrated technology, only has the function of acquiring signals), signal conditioning circuits, and microprocessors with digital bus interfaces. The signal conditioning circuit is used to condition the output signal of the sensor, that is, the output signal of the sensor is amplified and converted into a digital signal and then sent to the microprocessor, and then the microprocessor is connected to the field digital bus through the digital bus interface.
The integrated intelligent sensor system is composed of micromachining technology and large-scale integrated circuit technology, using silicon as the basic material to make sensitive components, signal conditioning circuits, and microprocessor units, and integrating them on a chip.
3.2. Design of Smart Sensor Based on CAN Bus
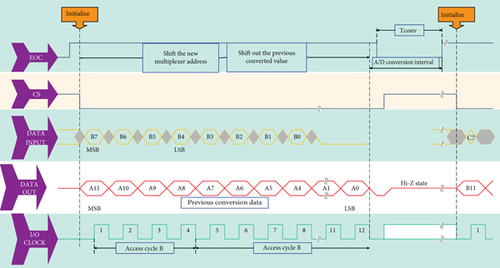
The working sequence of TLC2543 is shown in Figure 1. After power-on, the chip select CS must go from high to low to start a working cycle. At this time, EOC is high, the input data register is set to 0, and the content of the output data register is random. At the beginning, chip select CS is high, I/O CLOCK and DATA INPUT are disabled, DATA OUT is in a high-impedance state, and EOC is high. 12 clock signals are added in sequence from the I/O CLOCK terminal. With the addition of the clock signal, the control word is sent to the TLC2543 bit by bit from the DATA INPUT at the rising edge of the clock signal (the high bit is sent first), and the A/D data converted in one cycle, that is, the data in the output data register is shifted out bit by bit from DATA OUT. After TLC2543 receives the 4th clock signal, the channel number has also been received. At this time, TLC2543 starts to sample the analog quantity of the selected channel and keeps it until the falling edge of the 12th clock. At the falling edge of the 12th clock, EOC becomes low, and the A/D conversion of the sampled analog is started. The conversion time is about 10μS. After the conversion is completed, EOC becomes high, and the converted data is in the output data register. After that, a new duty cycle can be performed. It must be noted that the data in the output register is the result of the last conversion, so special attention should be paid to programming.
The I2C bus can form a multi-master data transfer system, but only the device with CPU can become the master device. The start, end, and valid state of data transfer on the bus are determined by the levels of SDA and SCL. The transmission format is shown in Figure 2. Data bits are represented by high and low levels on the SDA line, and a clock pulse is generated on the SCL line for each transmitted data bit. When SCL is high, SDA has a falling edge to start the I2C bus (start signal S), and when SCL is high, SDA has a rising edge, stop using the I2C bus (stop signal P). There is no limit to the data that can be transferred between the start and stop signals, but each byte must be 8 bits, the MSB is transmitted first, and each byte must be followed by an acknowledge bit (ACK signal ACK).
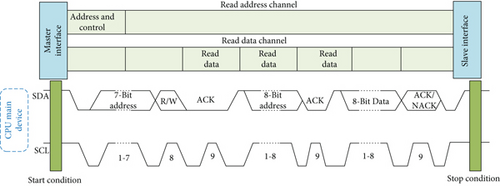
In the master transmission mode, the master device issues a start signal (S) first, followed by a 7-bit slave address (SLA) of the slave device and a direction bit 0 (W) indicating the master device’s sending direction.
The addressed slave device returns an acknowledgement signal (ACK) after receiving the byte, the master device sends byte data to the slave device after receiving the acknowledgement, and the slave device returns an acknowledgement signal every time it receives a byte of data. The master device sends a stop signal after all data are sent.
In the master receiving mode, the master device first sends a start signal and then sends the 7-bit slave address (SLA) of the slave device and the direction bit 1 (R) indicating that the master device receives it. After sending this byte, it continues to output the clock signal SCL.
The master device sends an acknowledge signal (ACK) after each byte received, but does not send an acknowledge signal after the last byte is received. After all data has been received, the master device issues a stop signal (P).
3.3. Processing of Collected Data
After the standard analog signal sampled by LM335Z is converted by TLC2543, it is sent to the microcontroller for the following processing: valid data checking, digital filtering, scale conversion, etc. Among them, the valid data check can avoid the collection of false data due to line failure and check the validity of the input signal.
In this paper, after the temperature signal is collected by the temperature measurement circuit of LM335Z, it is sent to TLC2543 for conversion. TLC2543 is a 12-bit switched capacitor successive approximation serial A/D converter, and the conversion result is binary original code. The range of the conversion result is 0 to 4096. Since the temperature measurement range of LM335Z is -40°C~100°C, it must be restored to the temperature signal of -40°C~100°C in practical application, and the scale must be transformed.
Since when the temperature is 100°C, the output of LM335Z is 3.73 V, the result of A/D conversion is 3056, and when the temperature is -40°C, the output of LM335Z is 2.33 V, and the result of A/D conversion is 1909. The transformations of LM335Z and TLC2543 are linear transformations.
In the data acquisition system, due to the broadcast signal, logic signal, magnetic field, and power supply mutation signal in the surrounding environment, it will be introduced into the original signal through some coupling media such as common mode impedance, parasitic capacitance, and mutual inductance to become noise. The original signal is manifested as common mode interference, high-frequency interference, power frequency interference, random interference, etc. In addition, due to the influence of the internal digital circuit, spikes will also be generated in the original signal. The existence of these interferences makes the curve drawn by the collected discrete data often in an irregular sawtooth shape, so that the data curve cannot reflect the actual changes, resulting in false point.
In this sensor, due to the use of shielded wire for the signal line in terms of hardware, it can effectively avoid some AC interference coupled into the signal by the parasitic capacitance of the signal line. To a certain extent, the influence of random signals is weakened.
At the same time, an A/D converter with a relatively high common mode rejection ratio is used in the circuit, so that the common mode interference can be better suppressed.
Therefore, the main ones in the actual collected signal are power frequency interference, spike interference, and some small random interference. These interferences are mainly removed by software filtering.
3.4. Filtering Methods in Data Acquisition
In the measurement channel, all kinds of random interference will inevitably enter, so that there will be errors in the data sent by the A/D conversion to the microcomputer. This error caused by random interference is called random error, and digital filtering method can be used to suppress the interference component in the effective signal and eliminate the random error. Digital filtering is to perform some kind of processing on the collected data through a certain calculation program, so as to eliminate or weaken the influence of interference noise and improve the reliability and accuracy of the measurement.
Commonly used digital filtering methods are median filtering method, arithmetic mean filtering method, and de-extreme mean filtering method. Considering that the sampling rate of TLC2543 is 66kbit/s, the speed is relatively fast, and the measured signal is a temperature signal, which is a slowly changing measured parameter, so the de-extreme average filtering method is adopted.
Arithmetic mean filtering cannot eliminate obvious impulse interference or gross error, but can only weaken its influence. Due to obvious interference or gross error, the sampled value is far from its actual value; we can easily remove it and do not participate in the average calculation, so that the output value of the average filtering is closer to the real value. The algorithm principle is as follows:
Continuously sample N times, accumulate and sum them, find out the maximum and minimum values, then subtract the maximum and minimum values from the accumulated sum, and average the N-2 sampled values to get the effective sampled value.
In order to make the average filtering convenient, N − 2 often takes 4, 8, and 16, so N often takes 6, 10, and 18. Because the result of reading TLC2543 conversion is the last result, so the first result is discarded, and N =10 is taken in essence. The temperature signal measured by this sensor is a slowly changing parameter, which can be sampled and processed at the same time, without having to open up a large amount of data temporary storage area in RAM.
3.5. Optimization of Agglomeration Effect Model of Sports Industry in a Certain Region
The industrial layout of the five branches of the sports industry in a certain region is sports goods manufacturing, sports event viewing service, sports fitness leisure service, sports tourism leisure service and sports lottery.Based on the above results, the above formula, brought in relevant data, can determine the status of the agglomeration effect of the sports industry in each region.
If the index exceeds 1, it indicates that the overall distribution of the industry is uneven, and the degree of development varies greatly. It is recommended that the government strengthen guidance.
The index is between 0.5 and 1, indicating that the industry as a whole is relatively balanced and has a certain degree of difference. It is recommended that the government should guide it appropriately.
The index is between 0 and 0.5, indicating that the industrial layout is well balanced and the differences in industrial development are small. It is recommended to maintain the current government guidance policy.
3.6. Calculation and Prediction of the “Gravity Model” of a Regional Sports Growth Pole City in a Certain Region
The purpose of this section is to build a city “gravity model” to select growth pole regions or growth pole cities. According to Peru’s growth pole theory and distance decay principle, the main city in a certain area of the research object is regarded as a certain pole in the gravitational field, and its theoretical basis is the law of universal gravitation. It vividly depicts the action mechanism of the force field, and the interaction between social and economic things can also be used to analyze the economic force field and its action mechanism according to the gravitational model.
3.7. Optimization of the Growth Pole Model of the Sports Industry in a Certain Region
4. Results and Analysis
4.1. Autocorrelation Analysis of Location Entropy of Sports Industry in a Certain Region
Through spatial autocorrelation technology, the spatial distribution pattern of sports industry in a certain area is detected. This paper uses Moran’s I index to measure its correlation, which is the most commonly used global correlation index to detect the spatial distribution characteristics of the entire study area.
Count the number of stadiums in the grid at different scales in ArcGIS, and then use Moran’s I under the spatial statistics module to calculate the overall autocorrelation coefficient (the distance calculation method is Euclidean Distance). Moran’s I analysis results of the spatial distribution of gymnasiums in a certain area are shown in Figure 3.
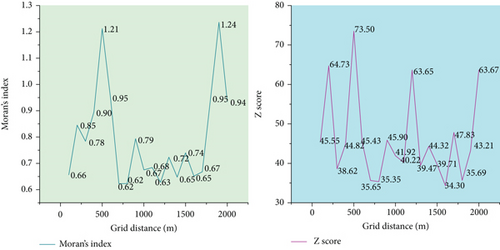
According to the size of the Z value, the judgment of accepting or rejecting the null hypothesis is made at the set significance level. The overall distribution of stadiums has a positive spatial autocorrelation in space, showing a clustered spatial pattern.
Under these four scales, Moran’s I values vary in size, but they all show a significant positive spatial correlation, with the strongest correlation under the 5000-meter grid and the weakest at 1000-meter grid. From this, it can also be concluded that different scale divisions affect the results of autocorrelation analysis. If one partitioning method obtains a larger spatial correlation coefficient, it cannot be determined that another method can also obtain the same result. Different granularity sizes should be selected for calculation in different situations.
Count the number of sporting goods stores in the grid at different scales in ArcGIS and then use Moran’s I under the spatial statistics module to calculate the overall autocorrelation coefficient (the selected spatial relationship criterion is Inverse Distance, and the distance calculation method is Euclidean Distance). The results of Moran’s I analysis of the spatial distribution of sporting goods stores in a certain region are shown in Figure 4.
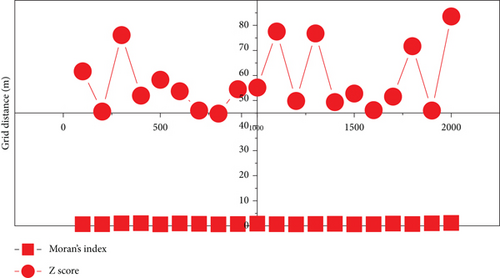
According to the size of the Z value, the judgment of accepting or rejecting the null hypothesis is made at the set significance level. Taking α =0.05, the null hypothesis is rejected when Z < −1.96 or Z > 1.96. It can be found that the Z values are far greater than 1.96, and Moran’s I value is greater than 0 and close to 1, indicating that the overall distribution of sporting goods stores has a positive spatial autocorrelation in space, showing a clustered spatial pattern.
Under these four scales, Moran’s I values vary in size, but they all show a significant positive spatial correlation, with the strongest correlation under the 5000-meter grid and the weakest at 1000-meter grid. From this, it can also be concluded that different scale divisions affect the results of autocorrelation analysis. If the spatial correlation coefficient is larger in one division method, the same results can be obtained if another method cannot be determined. Different granularity sizes should be selected for calculation in different situations.
4.2. Correlation Analysis of the Spatial Layout of the Sports Industry Location Entropy in a Certain Region and Various Factors
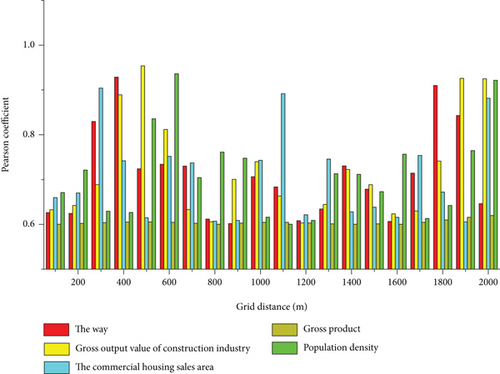
This study selects and analyzes population density, GDP, total industrial output, total construction industry output, first-class roads, second-class roads, third-class roads, and expressways as independent variables, and uses Pearson’s coefficient and Lee’s L coefficient to calculate the distribution of gymnasiums, respectively. The binary correlation between the two attempts to analyze and explain the reasons for the spatial distribution of the sports industry in a certain region represented by the spatial distribution of stadiums and sports stores.
4.2.1. Pearson’s Correlation Analysis
There is also a high correlation with primary and secondary roads, indicating that the wealth stock of basic facilities such as regional transportation affects the demand for sports venues and sporting goods stores in the region.
Among them, there is a high negative correlation between expressways and sports industry distribution. The possible reason is that the densely populated areas of expressways are often located in the suburbs or the countryside, which are not suitable for the construction and development of gymnasiums, and there are no buyers of sporting goods, which is not conducive to the development of sporting goods stores.
In this study, the Pearson correlation coefficient was used to analyze the binary correlation between gym layout and various factors. Pearson’s correlation, also known as product-difference correlation (or product-moment correlation), measures the correlation (linear correlation) between two variables, X and Y, with values between -1 and 1. In the field of natural sciences, this coefficient is widely used to measure the degree of correlation between two variables, and its scientificity and authority have been widely recognized.
On the basis of the zoning distribution of sports venues and sporting goods stores, the results of the Pearson correlation analysis of the spatial distribution of the sports industry and various elements are shown in Figure 5.
4.2.2. Lee’s L Coefficient Correlation Analysis
In this paper, Lee’s L coefficient is selected as the measurement index of the spatial binary correlation analysis between the distribution of gymnasiums and its possible influencing factors. Spatial Correlation Lee coefficient analyzes the correlation between the spatial distribution of gymnasiums and sporting goods stores and population, GDP, industrial output, construction industry output, and roads. The binary spatial correlation analysis (Lee’s coefficient) of the distribution of sports industry in a certain region and various factors is shown in Figure 6.
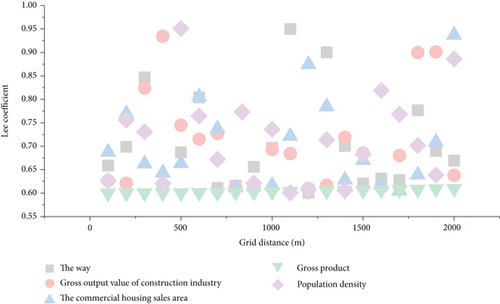
Gross product is an important link in economic factors, which directly determines the financial and material resources of this region, that is, the ability to supply stadiums. With the support of the level of economic development, market demand can eventually lead to the construction and expansion of venues, so there are densely distributed sports venues in areas with higher economic levels.
After the stadiums are dense, it will inevitably drive the demand for sporting goods, which in turn will lead to the agglomeration and development of sporting goods stores. In addition to the gross domestic product, the significant spatial correlation with the number of sports layouts is in descending order of significance: the total output value of the construction industry, roads, population, and total industrial output value, and road conditions are all positive factors that influence stadium construction and the location of sporting goods stores.
4.3. Regression Analysis of Location Entropy of Gymnasium Spatial Layout and Factors Such as Transportation, Land, Population, and GDP
Taking the number of gymnasiums in the district as the independent variable and selecting population density, GDP, total industrial output value, total output value of the construction industry, first-class roads, second-class roads, third-class roads, and expressways as dependent variables, the multiple linear regression model was used to carry out the analysis. The regression of the distribution of gymnasiums in a certain region and various factors based on OLS is shown in Figure 7.
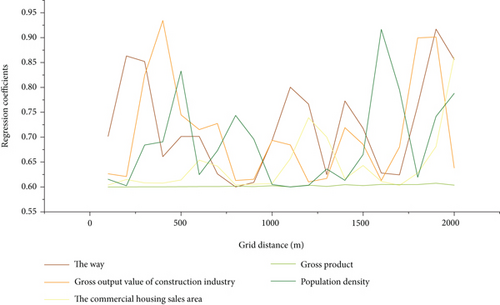
R-squared represents the degree of fit of the model, and R-squared of 0.917188 means that 91.72% of the events distributed by the stadium can be explained by the three variables of population density, industrial output value, and highway. In the analysis of regression coefficients, the regression coefficients of population density and total industrial output value are all positive values, while the regression coefficients of third-class highways are negative values. From a statistical point of view, the greater the population density, the greater the industrial output value, and the sparser the tertiary roads will lead to a higher distribution probability of gymnasiums in the area.
By comparing the absolute values of the regression coefficients of these variables, the relative effect of each variable on the distribution of the gym can be obtained. It can be obtained that the influence of traffic factors on the distribution of gymnasiums is greater than that of social and economic factors. Highways are general arterial highways connecting cities and towns at and above the county level. In these areas, people’s living standards are relatively backward, which makes the development of the sports event service industry relatively slow. In areas with relatively developed economy and high population density, the sports event service industry can develop relatively well.
4.4. Regression Analysis of Location Entropy of Sports Store Spatial Layout and Traffic, Land, Population, GDP, and Other Factors
Taking the number of sports stores in the district as independent variables and selecting population density, GDP, total output value of construction industry, and roads as dependent variables, the multiple linear regression model is used to carry out regression analysis and simulation of the layout of sports stores and various elements, and carry out analysis. The regression analysis of the distribution of sporting goods stores in a certain region and various factors based on OLS is shown in Figure 8.
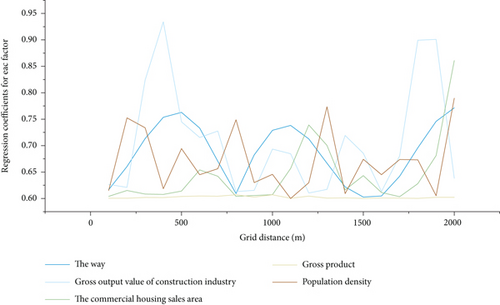
R-squared indicates how well the model fits, and an R-squared of 0.912188 indicates that 91.2% of the events distributed by sporting goods stores can be explained by the three variables of population density, industrial output value, and highway.
In the analysis of regression coefficients, the regression coefficients of population density and total industrial output value are all positive values, while the regression coefficients of expressways are negative values.
From a statistical point of view, the greater the population density, the greater the industrial output value, and the sparser the highway will lead to a higher distribution probability of sporting goods stores in the area.
By comparing the regression coefficients of these variables, the relative effect of each variable on the distribution of the gym can be obtained. It can be obtained that the influence of traffic factors on the distribution of sporting goods stores is greater than that of socioeconomic factors. In areas with relatively developed economy and relatively high population density, the sporting goods service industry can develop relatively well.
5. Conclusion
The overall solution adopts a non-integrated implementation structure of smart sensors. Its hardware circuit consists of microcontroller, SJA1000 controller produced by Philips, 24-bit A/D converter TLC2543, CAN transceiver 82C250, temperature measurement circuit, and anti-interference circuit. The intelligent sensor takes the single chip microcomputer as the core, adopts the high-precision analog-to-digital converter to perform analog-to-digital conversion on the measured temperature signal, and processes the obtained data. Both the polarization effect and the radiation effect of the sporting goods manufacturing industry have a certain intensity, and the polarization effect depends more on the foundation and first-mover advantage of the original manufacturing industry. The quality of the sporting goods itself does not have a decisive impact. The polarization effect is stronger than the radiation effect; the sports event viewing service industry has a strong polarization effect and shows a gradual downward trend according to the grade of the event. The radiation effect and polarization effect of the industry can appear at the same time, and the radiation effect also varies with the event. Season and rest periods are ups and downs. The polarization and radiation effects of the sports, fitness, and leisure service industry are not obvious. They are attractive to people and funds in a relatively short range and have a distance breaking point for industrial energy movement. The research believes that the external space problems of the sports industry in a certain area mainly include five aspects: scarcity and unreasonable utilization of land resources, disordered urban space expansion, unreasonable industrial space structure, unclear urban functional structure, and gradual deterioration of urban ecological space. Avoiding the above problems in the layout of the sports industry will have a negative impact on the industrial spatial structure, and to a certain extent, use the related characteristics of the industry to improve these problems. The layout of the sports industry in a certain area has obvious traffic orientation and population density orientation and has a strong economic dependence. In the layout of the sports industry, it is necessary to focus on the influence of these three factors and combine with the natural environment of the region to create a scientific layout system according to local conditions. The main problems in the spatial layout of the sports industry in a certain area are the imbalance of spatial distribution density, the serious phenomenon of functional isomorphism, and the soft environment of the industrial spatial layout to be improved. These problems restrict the development of the sports industry and cause the idle waste of sports resources. Sporting goods stores are mostly distributed in major business circles and around colleges and universities. Although the bulk distribution of the community has a certain number of clusters, it does not form a regular network distribution.
Conflicts of Interest
The author declares that there are no known competing financial interests or personal relationships that could have appeared to influence the work reported in this paper.
Acknowledgments
This work was supported by the School of Physical Education, Jiangxi University of Finance and Economics.
Open Research
Data Availability
The data used to support the findings of this study are available from the corresponding author upon request.


