Analysis of Vertical Distribution of Ozone in Winter and Its Transport from Stratosphere to Troposphere in the Pearl River Delta Region of China
Abstract
The vertical distribution of winter ozone in the Pearl River Delta in 2021 was analyzed using electrochemical concentration cell (ECC) ozonesonde and compared with the ozone Light detection and ranging (LiDAR) data. The transport of stratospheric ozone to the troposphere was also explored. The results show that (1) the maximum value of the stratospheric ozone layer was about 25 km. The stratospheric ozone profile is mainly unimodal, and the stratospheric ozone content was much higher than that of the troposphere. In the troposphere, the ozone content near the ground (0-2 km) was slightly higher than that between 5 and 15 km. The ozone profile in the upper and middle troposphere showed a peak structure, which was mainly divided into single peak (22%) and multipeak (77%) profiles. (2) In the middle and lower troposphere, the vertical profile of ozone detected by LiDAR is significantly different from that detected by sounding system. The difference between the two ranged from 10 ppb to 60 ppb at the same height. Ozone sounding can supplement the blind area of the near-ground layer by LiDAR ozone detection and can calibrate the inversion results of LiDAR. (3) On January 5, 2022, stratospheric ozone was transported to the troposphere. The stratospheric intrusion occurred due the high wind speed of the subtropical jet centre over Qingyuan and due to strong subsidence movement. When the stratospheric air mass moved to the troposphere, and subsidence airflow encountered, the ozone concentration near the ground was rapidly increased in a short time. It was identified as an “exceptional event.”
1. Introduction
Ozone has become the primary pollutant affecting air quality in the Pearl River Delta in recent years. It is the main component of the photochemical reaction in the boundary layer. The changes in atmospheric ozone are controlled by power, radiation, and chemical processes. These processes are not independent of each other, and the combined effect of all the processes may lead to vertical atmospheric structural changes affecting climate and ecological environment. Ozone not only determines the existence of the stratosphere but also modulates the solar radiation reaching the ground and the radiation budget of the geogas system. Tropospheric ozone has a strong radiative force and greenhouse climate effect. Excessive near-surface ozone content will endanger human health and animal and plant growth. The relationship between the vertical change of ozone content and atmospheric structure is an important topic in the scientific community [1–4].
A large number of studies in the Pearl River Delta are focused on ozone operational observations near the surface; however, little is known about the vertical distribution of ozone. The atmosphere is a three-dimensional continuous movement; as a consequence, the near-surface ozone concentration change is related to the atmospheric photochemical reaction processes. Furthermore, the ozone concentration change at the near surface is affected by the interaction between the near-surface boundary and the free troposphere atmosphere. In addition, long-distance transport, including photochemical generation of ozone precursors, can affect near-surface ozone concentration. Long-range horizontal transport of ozone or vertical vehicle of weather scale also plays a vital role in the revenue and expenditure of tropospheric and near-surface ozone concentrations. Therefore, conditions should be created to carry out vertical ozone concentration observations and to maximize the possibility of operational comments in the vertical direction of one station (best multiple stations) of ozone to understand the normalization characteristics of the vertical ozone distribution.
The main techniques that are used to observe the vertical distribution of ozone are electrochemical concentration cell (ECC) ozonesonde, ozone LiDAR, aircraft observations, and satellite monitoring inversion. Among them, ozone sounding has more advantages than the other techniques. The resolution and detection accuracy of ozone vertical profile inversion are very low by satellite monitoring technique. This was due to the high concentration of stratospheric ozone and the difficulty of satellite remote sensing to accurately obtain the tropospheric (boundary layer, near the surface) ozone vertical distribution characteristics in a short time. Aircraft-based ozone vertical detection is also difficult due to airspace constraints and high costs. The ozone LiDAR is blind near the ground (0-300) and hence unable to obtain the vertical distribution profile of ozone. In addition, there is a large ozone error of radar inversion. The difference between inversion algorithms and technical levels of different manufacturers also affects the inversion results of the radar. In contrast, advanced technology termed “ECC ozonesonde” has become the best observation method that enables the detection of the vertical distribution of ozone from the ground to the stratosphere (about 35 km). The operational observation of ozone vertical distribution by ozone radiosonde has been used in several other countries for over 50 years. The ozone sounding observation at Pearl River Delta was late, compared to that carried out in Beijing-Tianjin-Hebei, Yangtze River Delta, and other regions in China, but the ozone pollution situation is much more severe. In the Pearl River Delta region, only Hong Kong Observatory conducts regular weekly ozone sounding observations.
It has been reported that stratospheric exchange increases ozone concentration in the lower troposphere and even near the ground, which leads to excessive ozone in troposphere [5, 6]. Therefore, it is necessary to consider the above influencing factor when formulating ozone pollution prevention and control measures. Otherwise, this event will lead to an overestimation of the severity of ozone pollution, underestimate the effectiveness of ozone pollution prevention and control, and increase the burden on enterprises and relevant government departments. The research on ozone in the vertical direction based on ozone sounding is the most accurate method to understand the exchange between stratospheric ozone and tropospheric ozone.
From December 2021 to February 2022, ozone vertical distribution detection was carried out once a week in the Pearl River Delta (Qingyuan sounding station) under the overall deployment of the Comprehensive Observation Division of the China Meteorological Administration. The results are of great significance for studying the change mechanism of the ozone layer in the Pearl River Delta.
2. Overview of High-Altitude Detection Test
2.1. Details of Ozone Sounding Site and Ozone Sounding Experimental Procedure
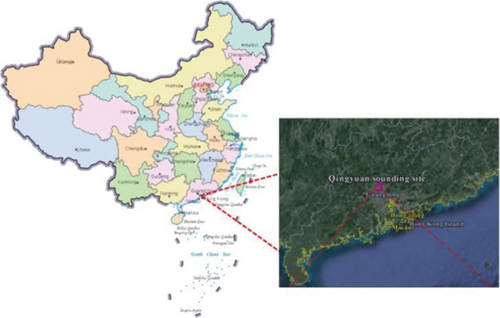
The ozone sounding observation in the Pearl River Delta was carried out at Qingyuan National Meteorological Station (23.692°N, 113.016°E, Figure 1). The station has maintained conventional ground meteorological and sounding observations. During the test period from December 2021 to February 2022, a total of 13 atmospheric ozone high-altitude sounding balloons were placed once a week. The application time was selected at about 14 : 00 h Beijing time. The parameters determined were atmospheric ozone partial pressure (concentration), wind, temperature, air pressure, and humidity. The data were recorded every second and transmitted to the receiver on the ground. Throughout the period, only nine valid data were obtained as the ozonesonde observation was affected by receiver outage and signal interferences (the data were taken on December 1, December 8, December 22, December 29, 2021, January 5, January 12, January 26, February 9, and February 16, 2022).
2.2. Ozone High-Altitude Detection System
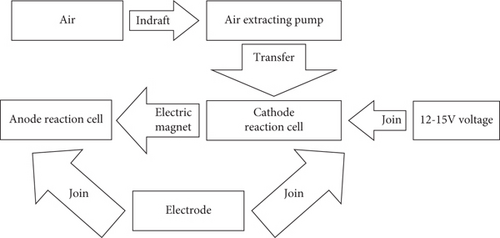
Consequently, the amount of ozone reacted with iodine in the solution at a unit time is proportional to the generated current. Therefore, the ozone content in the atmosphere can be determined by measuring the electric current flowing through the solution.
3. Data
The ozone vertical distribution data used in this paper include ozone sounding test data and ozone LiDAR data. Ozone hourly mass concentration data were obtained from four national environmental monitoring points at Qingyuan City, and FNL (Final Operational Global Analysis, FNL) reanalysis data were obtained from National Centers for Environmental Prediction (NCEP). The spatial resolution of the FNL reanalysis data was 1° × 1°, and the time resolution was 6 hours. The data on each day contained four groups which were obtained at 0 : 00, 6 : 00, 12 : 00, and 18 : 00 time UTC. The data include basic meteorological information such as wind speed, wind direction, temperature, and pressure of 26 standard isobaric surfaces. In this study, the observation time of ozone sounding was around 06 : 00 UTC, and the FNL data obtained from December 2021 to February 2022 were used for the correlation analysis of weather conditions.
4. Results and Discussion
4.1. Analysis of ECC Observation Results
Figure 3 shows the vertical distribution profile of ozone partial pressure, temperature, and relative humidity during the test period from December 2021 to February 2022 (the observation results were collected on 1 December, 8 December, 22 December, 29 December 2021, 5 January, 12 January, 26 January, 9 February, and 16 February 2022).
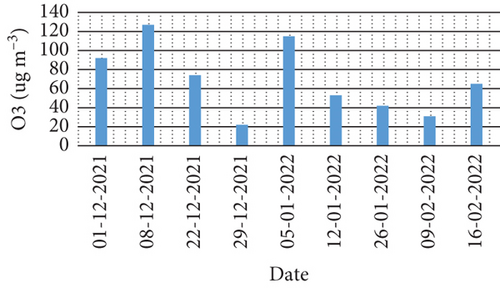
In general, the sounding balloon bursts naturally at about 35 km altitude; therefore, only vertical ozone characteristics from the ground to 35 km were analyzed. The trend of ozone partial pressure change was the same up to 16 km of the top of the troposphere; however, the change was rapidly increased above 16 km of the top of the troposphere. The maximum value of the ozone layer in the stratosphere was about 25 km from the ground (the average maximum value is 14 mPa), and afterward, it decreased. The distribution of ozone partial pressure was mainly unimodal from the troposphere to the stratosphere except for February 6, 2022, which was bimodal.
Figure 4 shows that the ozone content in the troposphere was lower than that in the stratosphere. In the troposphere, the ozone content near the ground was slightly higher, and the low ozone partial pressure was observed between 5 and 15 km. The content of ozone peaked in the lower troposphere (0-2 km), and peak structure was mainly divided into single peak (22%) and multimodal (77%) in the upper troposphere. During the observation period, the surface ozone concentration exceeded 100 μg/m3 for two days (Figure 3), which were 127 μg/m3 and 115 μg/m3 on December 8, 2021, and January 5, 2022, respectively. The ozone profile in the middle and low troposphere on 8 December 2021 showed a multipeak pattern, whereas on 5 January 2022, it showed a single-peak pattern (Figure 3).
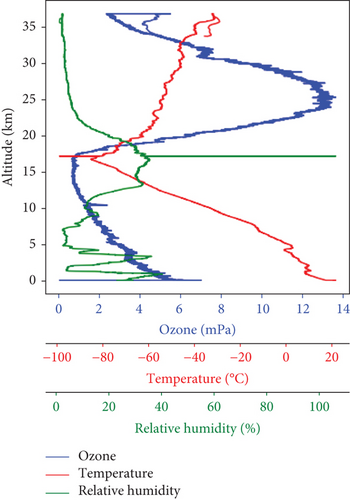
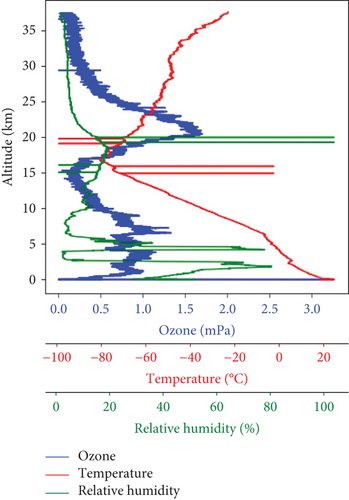
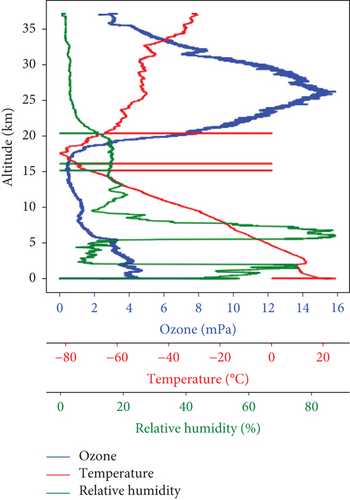
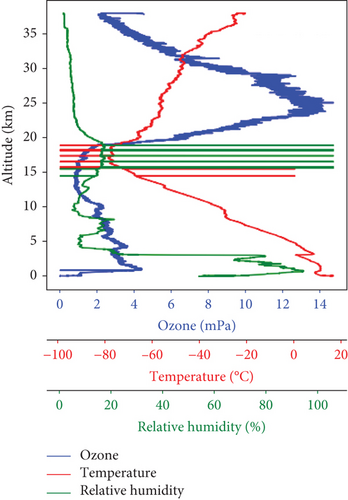
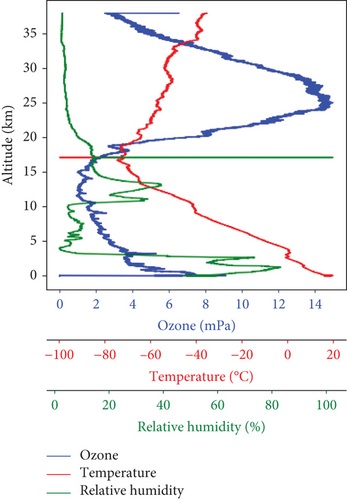
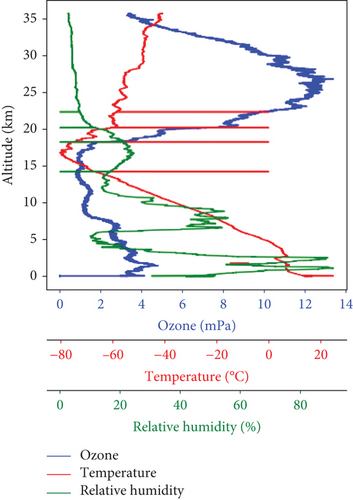
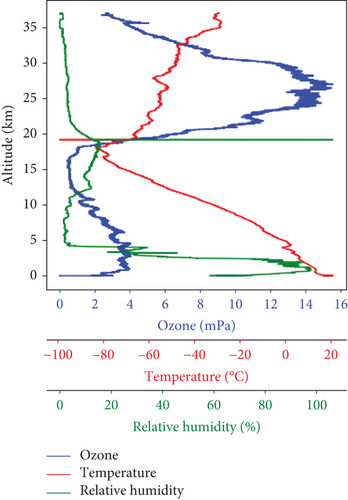
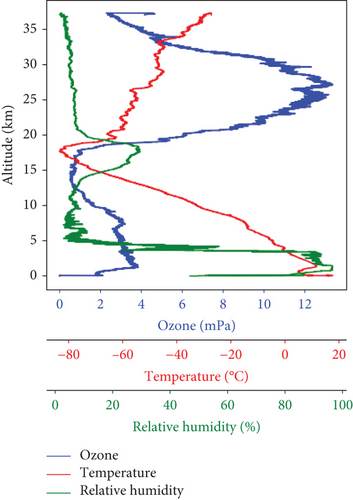
In the vertical direction, the correlation coefficient between ozone partial pressure and temperature was −43.2%, and that between ozone partial pressure and relative humidity was −52.5%. The temperature in the troposphere decreased with the increase in height, and the average temperature decline rate was 1.3°C/km. The average temperature at the top of the troposphere was −80°C. Ozone absorbs solar radiation thereby heating the atmosphere; consequently, when ozone content increased from top to bottom of the troposphere, the temperature in the troposphere also gradually increased. As water vapor was mainly concentrated below 10 km, and the relative humidity was stable at the low level of the stratosphere.
4.2. Comparison of Ozonesonde Observation and Ozone LiDAR Data
LiDAR uses a differential absorption method to retrieve ozone concentration. The principle is to use the measured gas’s absorption characteristics to measure the gas’s attention.
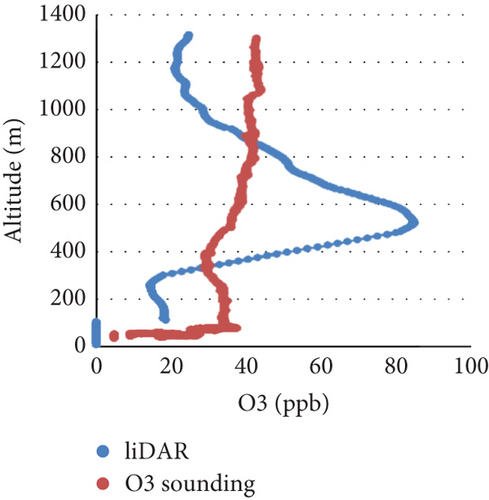
During the ozone sounding observation, a comparison test was performed using the ground ozone LiDAR. Light detection and ranging (LiDAR) technique was carried out to test the detection and inversion performance of the ozone and to “fill in the blind” at the near-ground (0-200 m) for LiDAR ozone radar detection. Owing to the off-line laser radar equipment and the effective data of laser radar, the LiDAR observations were carried out only on 29 December 2021, 5 January, 26 January, and 26 February 2022. Figure 5 shows the comparison between the ozone profile retrieved by LiDAR and the sounding experiment. The ozone measurements determined from LiDAR radar were attenuated at altitudes above 1000 m. There was a significant attenuation at a height of above 3000 m on January 5, 2022. As a result of attenuation at a height above 3000 m or even lower (above 1000 m) by the LiDAR technique, it was unable to detect the vertical distribution of ozone in altitudes above 1000 m. According to Figure 5, the vertical profile of ozone detected by LiDAR was significantly different from that detected by the sounding system. The vertical profile of ozone on 29th December 2021 determined from LiDAR was a single-peak type, and the ozone concentration was 59.9 ppb at 517.5 m (Figure 5(a) and Table 1). On the same day, the vertical profile of ozone determined by the sounding system was a double-peak type, and the ozone concentration was 48.9 ppb at 1108.1 m (Figure 5(a) and Table 1). The difference between the two at the same height ranged between 10 ppb and 50 ppb. The ozone profile structure determined on 5th January 2022 by both LiDAR and the sounding system techniques showed a fluctuating multipeak structure, and the changing trends of the two systems were relatively consistent. The ozone concentration determined from the LiDAR technique was 105.3 ppb at 532.5 m (Figure 5(b) and Table 1). It was 90.4 ppb for the sounding system technique at the height of 83.1 m (Figure 5(b) and Table 1). The difference of the concentrations between the two techniques at the same height ranged between 20 ppb and 40 ppb. The ozone profile structure on 26th January 2022 determined from the LiDAR technique was unimodal (Figure 5(c)). The ozone concentration in the near-surface layer (below 500 m) increased with height, and the ozone concentration from 500 m to 1000 m decreased with the height. The ozone concentration below 300 m in the near-surface layer increased with height, and the ozone concentration from 300 m to 500 m decreased slightly with height. The ozone concentration from 500 m to 1000 m increased with height (which was opposite to the LiDAR ozone profile). The ozone concentration determined from the LiDAR technique on 26th January 2022 was 83.2 ppb at 570 m (Figure 5(c) and Table 1). The ozone concentration determined from the sounding system was 56 ppb for the same day at 725 m (Figure 5(c) and Table 1). The difference ranged between 20 ppb and 40 ppb at the same height. The ozone profile structure on 16th February 2022 determined from the LiDAR technique showed a unimodal pattern with a single peak while it was a bimodal pattern when determined using the sounding system (Figure 5(d)). The ozone concentration on the 16th of February 2022 determined from the LiDAR technique was 94.4 ppb at 517 m (Figure 5(d) and Table 1). The sounding system ozone peak concentration was 79.6 ppb at 83.2 m (Figure 5(d) and Table 1). The difference between the two systems at the same height was ranged between 10 ppb and 60 ppb.
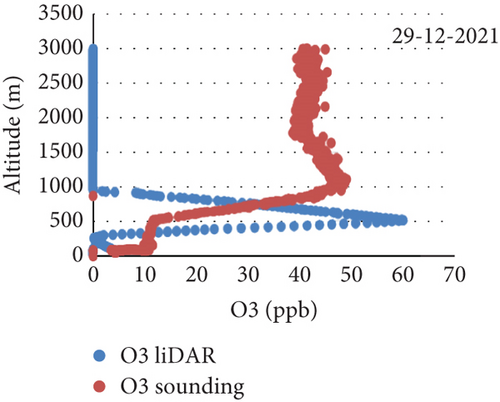
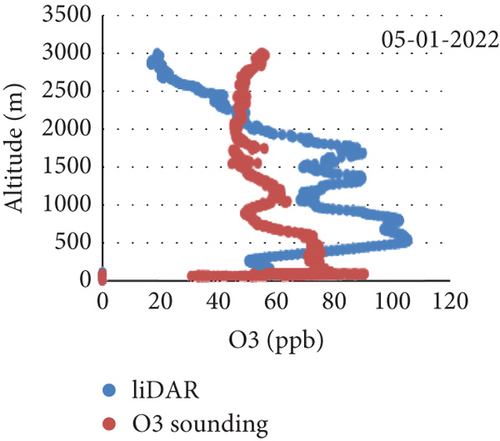
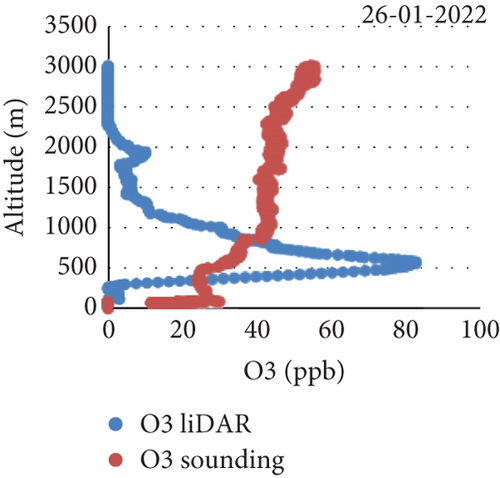
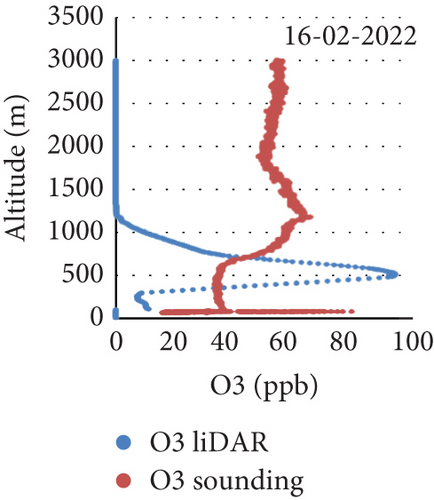
| Time | Sounding peak ozone | LiDAR peak ozone | ||
|---|---|---|---|---|
| Height (m) | Concentration (ppb) | Height (m) | Concentration (ppb) | |
| 2021-12-29 | 1108.1 | 48.9 | 517.5 | 59.9 |
| 2022-01-05 | 83.1 | 90.4 | 532.5 | 105.3 |
| 2022-01-26 | 725 | 56 | 570 | 83.2 |
| 2022-02-16 | 83.2 | 79.6 | 517 | 94.4 |
Figure 6 shows the mean ozone profiles of LiDAR and sounding systems during the experiment. Because LiDAR has apparent attenuation at the height above 1400 meters, the difference between the two is mainly compared for heights below 1400 meters. As seen from Figure 6, at the height of 100 meters to 1400 meters, the difference between the vertical profile of ozone detected by LiDAR and that detected by the sounding system is noticeable. At the same height, the difference between the two is between 10 ppb and 60 ppb, and the profile of the radar shows a single peak. The peak value of the ozone profile of LiDAR mainly occurred at about 500 m. The ozone concentration from 200 to 500 m increased with height, and the ozone concentration from 500 m to 1000 m decreased with height. The peak value of the ozone profile of the sounding system mainly occurred near the ground or 1000 m. The blind area under 100 meters was detected by the LiDAR; hence, ozone sounding can be supplemented with the near-surface blind spot for LiDAR ozone detection and calibrated the LiDAR inversion results.
4.3. Stratosphere-Troposphere Exchange
Figure 4 shows that stratospheric ozone content was much higher than tropospheric ozone content. Does stratospheric high ozone content transport to the troposphere? In order to explore this problem, potential vorticity was used to characterize the change of tropospheric top [7].
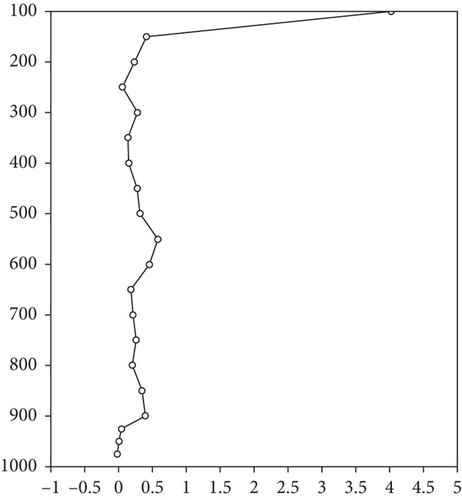
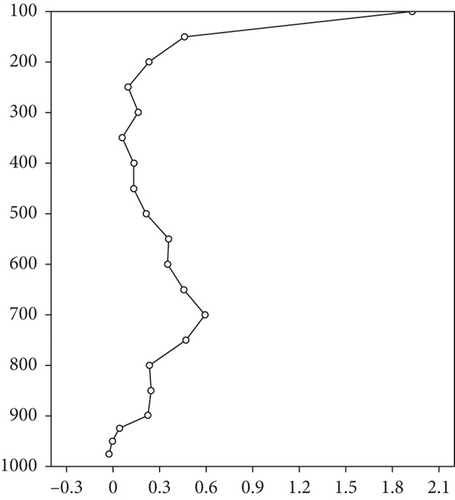
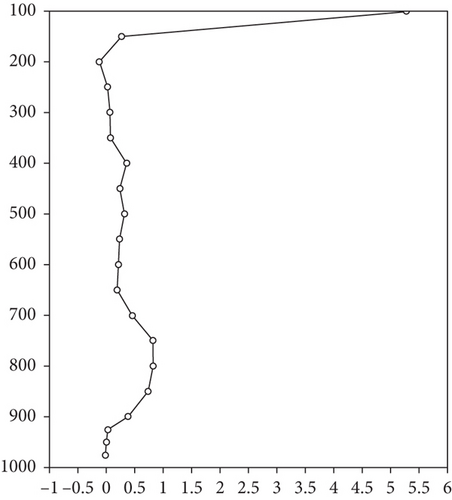
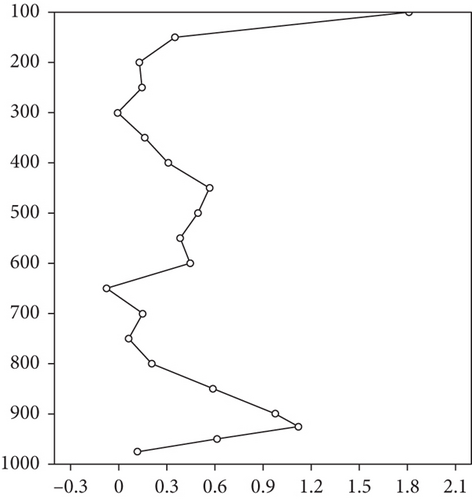
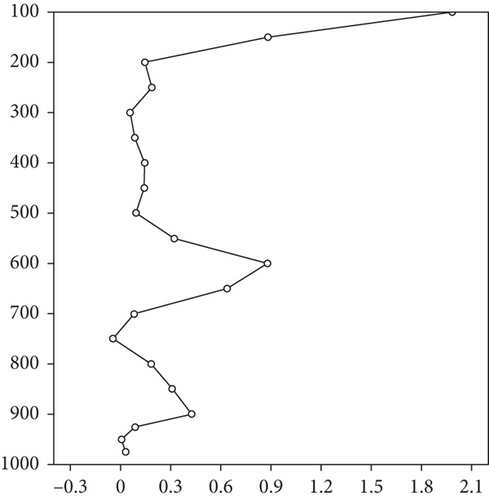
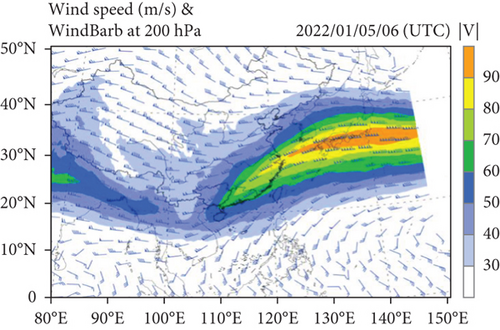
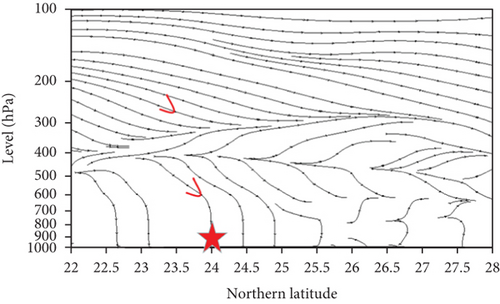
PVU is called a potential vortex unit. World Meteorological Organization (WMO) defined 1.6 PVU as the tropospheric top height. Some studies suggest that the top height of the troposphere is between 1 PVU [9] and 3 PVU [10], and there is no well-defined PVU value to distinguish the stratosphere from the troposphere. In this paper, 1.6 PVU was taken as the tropospheric top height. Figure 7 shows the vertical profile of potential vorticity during the sounding test. During the observation period (nine detection times from December 2021 to February 2022, except 5th January 2022), the potential vorticity 1.6 PVU was mainly located near 100 hPa (Figures 7(a) to 7(i)). However, the potential vorticity, 1.6 PVU, on January 5, 2022, dropped to 400 hPa (Figure 7(e)), indicating that there was a downward transport of stratospheric air mass on this day. Figure 8 shows the distribution map of the wind field at 14 : 00, 200 hPa on January 5, 2022. The central wind speed of the subtropical jet over Qingyuan was too high, exceeding 70 ms-1. The left entrance area of the jet was the convergence area, and there was a strong subsidence movement. Figure 9 shows the profile of the wind field streamlines along 113°E. According to Figure 9, the stratosphere (24°N) over Qingyuan to the top of the troposphere (around 400 hPa) was a strong downdraft. The airflow initially gathered around 400 hPa and then spread to the ground through the downdraft movement, resulting in a rapid rise of near-surface ozone concentration in a short time. The ground ozone concentration exceeded 100 μg/m3 on 5 January 2022, which was the day of high ozone concentration observed during the sounding test (Figure 3).
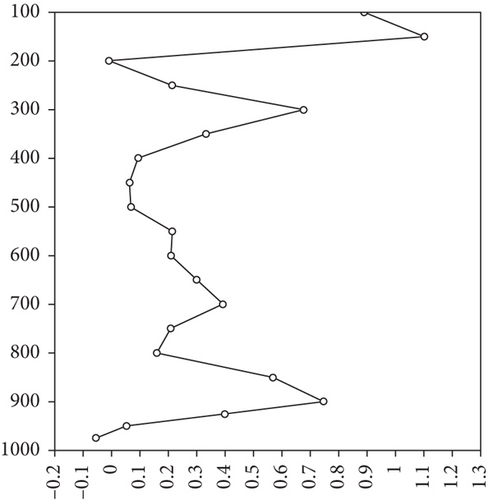
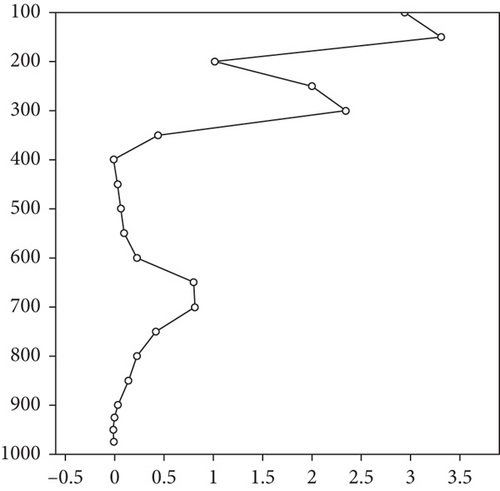
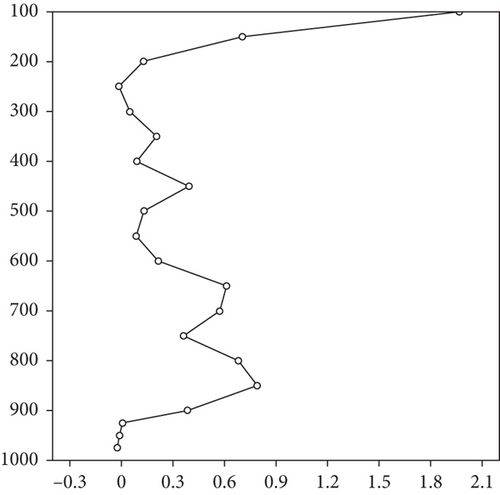
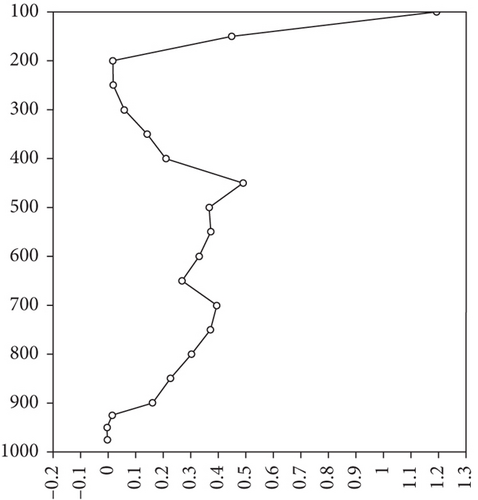
The US Environmental Protection Agency (hereinafter referred to as EPA) defined the Stratospheric Ozone Intrusion Exceptional Events (SOIEE) [11] under “Exceptional Events” in 2007 and revised in 2016: Exceptional Events are triggered by meteorological conditions such as high-altitude frontogenesis and strong convection. The lower stratosphere and the upper troposphere in the midlatitude region are prone to the “folding” of the top of the troposphere [12–14]. This phenomenon makes the ozone rich in the stratospheric atmosphere thereby invading the free troposphere. If there is an obvious sinking airflow, it will further diffuse through the inversion layer to the near-surface, resulting in a rapid rise in ozone concentration near-surface in a short time, which can lead to an excessive ozone concentration in serious cases. “Exceptions” are uncontrollable and preventable. The stratospheric ozone intrusion is mainly affected by atmospheric circulation dynamics and heat, which is different from the near-surface anthropogenic emissions. The “exceptional events” in the United States generally define stratospheric ozone intrusion as a natural event, pointing out that the excess ozone concentration caused by this event is essentially beyond human control and reasonable prevention and does not belong to the category of legal control [15]. It can be treated according to the “exceptional events,” “Clean Air Act,” relevant general rules, and “Guidelines” standards [15]. The stratospheric ozone intrusion into the troposphere on January 5, 2021, can be treated as an “exceptional event.” When formulating ozone pollution prevention and control measures, this factor should be considered to avoid underestimating the effectiveness of ozone pollution prevention and control measures and overestimating the severity of ozone pollution.
5. Conclusion
- (1)
The vertical profile of stratospheric ozone was mainly unimodal, and the ozone content in the stratosphere was much higher than that in the troposphere. In the troposphere, ozone valley peak appeared in the lower troposphere (0-2 km), and the low value area of ozone was between 5 and 15 km. The upper and middle troposphere showed a peak structure, mainly divided into single peak (22%) and multipeak (77%)
- (2)
Due to the obvious ozone attenuation by LiDAR over 3000 m, the vertical distribution of ozone over 3000 m was unable to detect by LiDAR. The vertical profile of ozone in the middle and lower troposphere detected by LiDAR was different from that detected by the sounding system. At the same height, the difference between the two ranged between 10 ppb and 60 ppb. The blind area under 100 meters was detected by LiDAR; hence, ozone sounding can be supplemented with the near-surface blind spot for LiDAR ozone detection and calibrated LiDAR inversion results
- (3)
On January 5, 2022, the potential vorticity 1.6 PVU dropped to about 400 hPa, indicating that there was a downward transport of stratospheric air masses. It can be used as an “exceptional event.” This factor should be considered in the formulation of ozone pollution prevention and control measures. It can be used to avoid the underestimation of the effectiveness of ozone pollution prevention and control and overestimation of the severity of ozone pollution
Conflicts of Interest
The authors do not have conflict of interest.
Acknowledgments
This research was supported by the Science and Technology Research Project of Guangdong Meteorological Bureau (GRMC2021LM04).
Open Research
Data Availability
The data that supports the findings of this study are available within the article.


