Influence of Parallel Joint Spacing and Rock Size on Rock Bulk Modulus
Abstract
The size effect on the bulk modulus of rocks has been reported by previous studies. The accuracy in selecting the parameter for the rock mechanics analysis determines further accuracy of the calculation results. Moreover, given the influence of the size effect and joint spacing, the rock bulk modulus often changes. Thus, it is essential to examine the size effect on the bulk modulus. This study elucidated the influence of rock size and parallel joint spacing on the bulk modulus using the regression analysis and 12 sets of numerical plans. The results demonstrated that the bulk modulus decreased with an increase in rock size, and the curve represents an exponential function. The bulk modulus linearly increased as the parallel joint spacing increased. Furthermore, the characteristic size of the bulk modulus linearly decreased as the parallel joint spacing increased. In contrast, the characteristic bulk modulus linearly increased as the parallel joint spacing increased. The specific forms of these relationships were also elucidated in this study.
1. Introduction
The rock bulk modulus reflects the ability of a rock to resist deformation under external loads, using which one can characterize the mechanical characteristics of rocks. The bulk modulus is a comprehensive response of the rock mineral composition, fluid, pore, and structure under the action of the original internal environment, such as the formation pressure and temperature [1]. These unique characteristics make the bulk modulus an important parameter to study.
The joints in a rock fundamentally affect its bulk modulus. For instance, parallel joints can exist in sedimentary rocks, thereby significantly affecting the bulk modulus [2]. At the same time, the number of parallel joint spacings (PJS) in the rock causes a difference in the bulk modulus. For instance, Zhao et al. [3] have used the finite element method to study the bulk modulus of rock. Moreover, some scholars have studied the effects of different factors on bulk modulus. For instance, Blake and Faulkner [4] have conducted seepage tests on granite to examine the effect of bulk modulus on fracturing permeability. Furthermore, Davarpanah et al. [5] studied the relationship between the modulus ratio and bulk modulus. Liu and Zhang [6] conducted an indoor triaxial creep test and found that the absolute value of the bulk modulus decreases with an increase in creep stress. Scholars have also addressed the calculation methods for bulk modulus. For instance, Shen et al. [7] studied the relationship between the tensile failure strain of rock and the initial fracture density spacing. They ultimately established a calculation method for the rock bulk modulus under tensile conditions. Zhao et al. [8] studied the failure and cracking characteristics of a broken rock mass cut using joints. Li et al. [9] obtained the volumetric fracture and crack propagation law of rocks through a dynamic load test. Overall, research literature extensively examined bulk modulus, but only a few studies have considered the size and PJS, while the relationship between bulk modulus and PJS is poorly understood.
The rock has a side effect, and the change in rock size also affects the rock bulk modulus. For instance, the change in the size of some sedimentary rocks rich in joints fundamentally affects the change in the rock bulk modulus [10]. In this regard, Pang et al. [11] demonstrated that the bulk modulus of coal increases with a decrease in particle size. Jiang [12] reported that the size of the rock particles affects the rock pore structure, thereby triggering changes in the rock bulk modulus. Zhang and Yang [13] quantified the bulk modulus of montmorillonite by measuring changes in the length and density of the sample. Some other scholars have studied the effect of irregular particles on the bulk modulus. For instance, Kerimov et al. [14] have elucidated the effects of irregularly shaped particles and particle size on the porosity, permeability, and bulk modulus of granular porous media. Researchers also examined the effect of size on bulk modulus, but the elements of PJS, as well as the relationship between bulk modulus and size, are both poorly understood.
The mechanical parameters of rocks fundamentally vary with the size of the jointed rock and eventually tend toward a stable value, which is defined as the representative essential volume (REV). Some researchers have previously proposed various methods to evaluate the REV, whereas Hu and Ma [15] used a realistic failure process analysis (RFPA) to study the characteristic size. Ying et al. [16] established a method based on volume rupture strength (P32) and a statistical test method to estimate rock mass REV. Wu et al. [17] studied the effect of size on bulk modulus, while taking into account the effect of the model location, and reported that the REV size was 18 m. Liu et al. [18] elucidated the size effect of the defective rock mass strength through uniaxial and confining pressure tests and obtained a REV size of 5 m × 10 m. Hu et al. [19] obtained the relationship between the characteristic size of the rock elastic modulus and the PJS. Overall, although the bulk modulus has been extensively studied, only a few researchers investigated the relationship between the characteristic size of the bulk modulus (CSBM) and PJS and established a model of the CSBM and PJS.
This study established 12 numerical models to investigate the influence of the PJS and rock size on rock K. Within this research aim, (1) the corresponding stress-strain curves were analyzed, (2) the relationship between K and PJS, as well as the relationship between K and size were both established. Finally, (3) a model of the CSBM and PJS and a model of the rock characteristic bulk modulus (CBM) and PJS were established.
2. Numerical Simulation Plans
This study primarily focuses on two aspects: (1) elucidating the influence of PJS on rock K, with PJS of 10, 20, 30, 40, and 50 mm and (2) elucidating the effect of rock size with PJS on rock K, with the rock sizes of 100, 200, 400, 600, 800, 1,000, and 1,200 mm. Table 1 summarizes the research plans of this study based on [15].
| Numerical simulation | PJS (mm) | Research plans | ||||||
|---|---|---|---|---|---|---|---|---|
| Plan 1 | Plan 2 | Plan 3 | Plan 4 | Plan 5 | Plan 6 | Plan 7 | ||
| l = 100 mm | l = 200 mm | l = 400 mm | l = 600 mm | l = 800 mm | l = 1000 mm | l = 1200 mm | ||
| Plan 8 | s = 10 | 10 × 100 | 10 × 200 | 10 × 400 | 10 × 600 | 10 × 800 | 10 × 1000 | 10 × 1200 |
| Plan 9 | s = 20 | 20 × 100 | 20 × 200 | 20 × 400 | 20 × 600 | 20 × 800 | 20 × 1000 | 20 × 1200 |
| Plan 10 | s = 30 | 30 × 100 | 30 × 200 | 30 × 400 | 30 × 600 | 30 × 800 | 30 × 1000 | 30 × 1200 |
| Plan 11 | s = 40 | 40 × 100 | 40 × 200 | 40 × 400 | 40 × 600 | 40 × 800 | 40 × 1000 | 40 × 1200 |
| Plan 12 | s = 50 | 50 × 100 | 50 × 200 | 50 × 400 | 50 × 600 | 50 × 800 | 50 × 1000 | 50 × 1200 |
- s is the parallel joint spacing, and l is the rock size.
This study uses RFPA as the simulation software. The boundary conditions and rock mechanical parameters used in the numerical simulation are summarized in referred to [15].
The roughness coefficient of the joint applied for the numerical simulations was 3, its elastic modulus was 1.5 MPa, its compressive strength was 2 MPa, its Poisson’s ratio was 0.3, and its internal friction angle was 30°.
3. Numerical Results and Analysis
3.1. Stress-Strain Curve Analysis
The research analysis included plotting of the stress-strain curves in the plans 1 to 7 (Figure 1). Furthermore, the stress-strain curves in plans 8 to 12 were plotted as well (Figure 2).
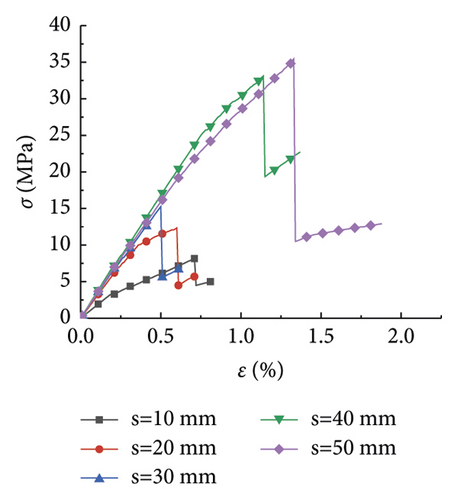
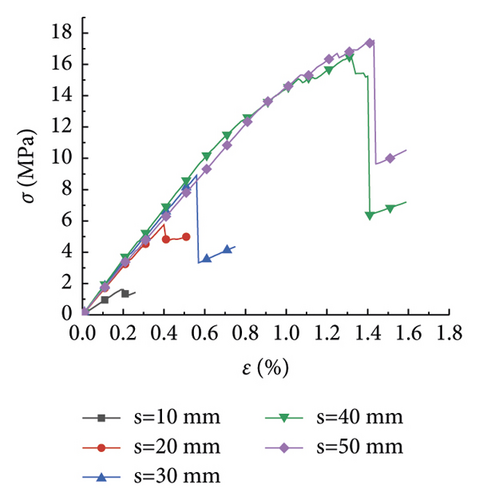
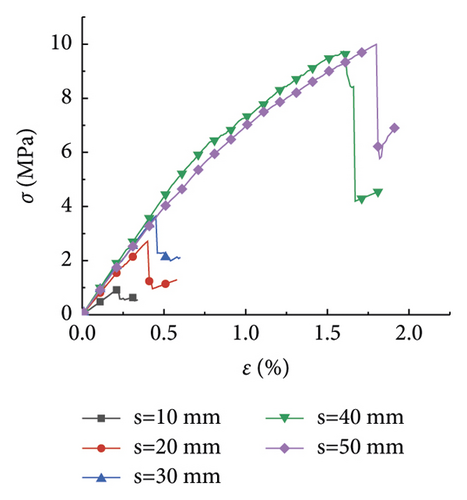
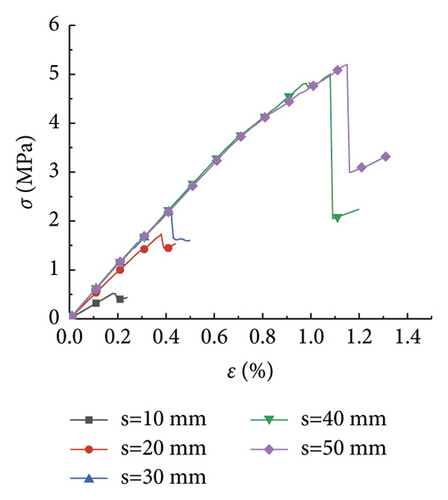
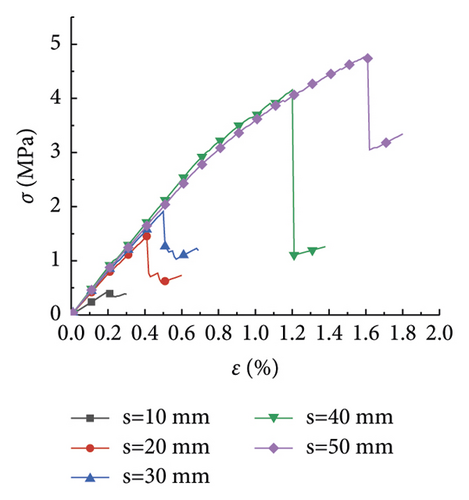
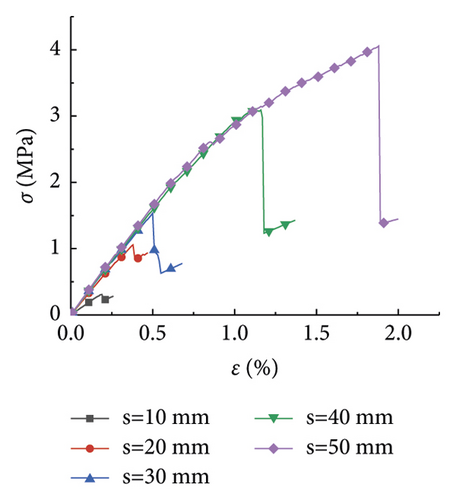
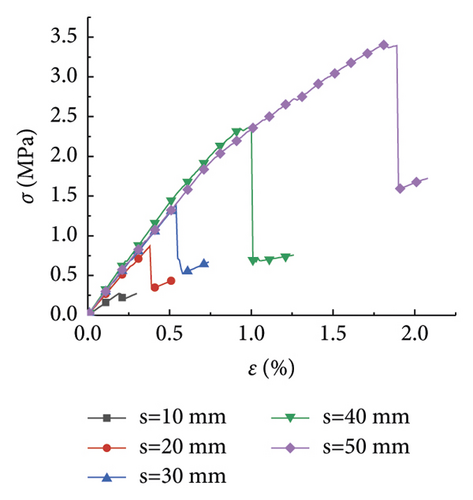
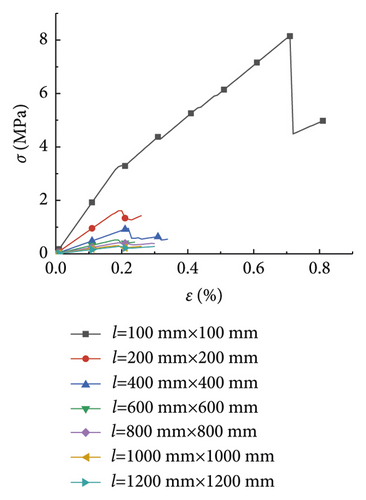
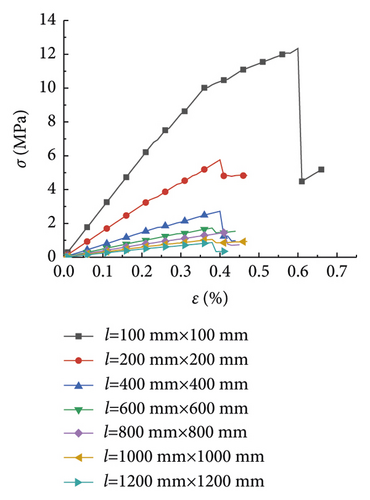
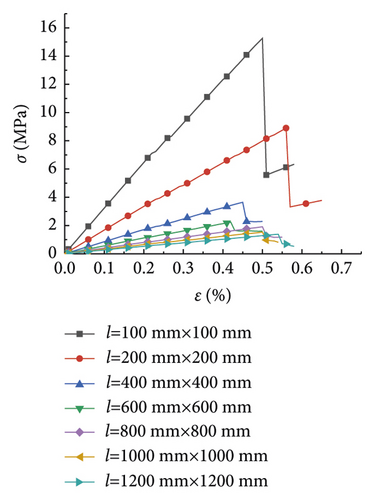
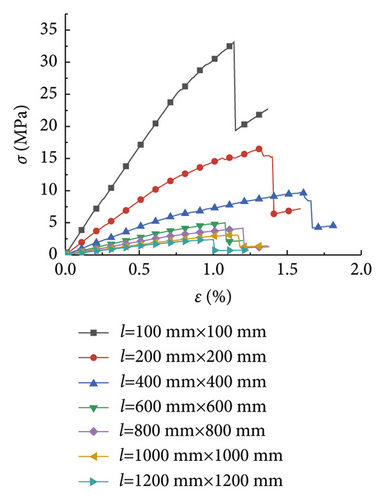
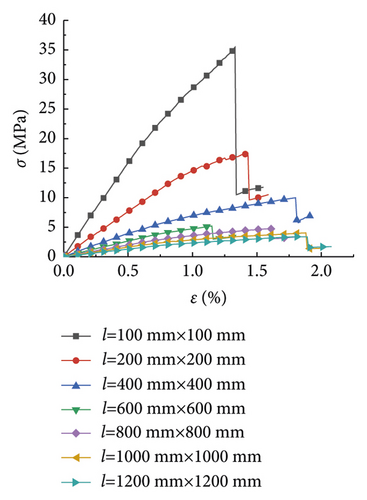
Figure 1 illustrates the effect of the PJS on the compressive strength of rocks with different rock sizes. As seen in Figures 1(a)–1(g), the laws of the stress-strain curves were similar as the rock size increased from 100 to 1,200 mm. The strain of the rock gradually increased with the increase of the stress under the pressure effect. Moreover, it exhibited a linear elastic failure, which was further exacerbated by a plastic failure. Figure 1(a) is shown as an example, where the rock size is 100 mm. As seen, the compressive strength of the rock gradually increased, as the PJS increased from 10 to 50 mm.
Figure 2 displays the effect of the rock size on the compressive strength of the rock at different PJS. As seen from Figures 2(a)–2(e), when the PJS increased from 10 to 50 mm, the laws of rock stress-strain curves were also similar. Like in Figure 2, the rock was also destroyed by the elastic deformation first, which was further exacerbated by plastic deformation. Figure 2(e) is shown as an example with a PJS of 50 mm. As seen, the compressive strength of the rock gradually decreased with the increase of the rock size from 100 mm to 1,200 mm, thereby somewhat manifesting the size effect. Notably, the law of the curve is consistent with the law from [15], thereby indicating that the size effect of the rock was the same when the parameters of the joints changed.
The elastic modulus fundamentally reflects the proportional relationship between the stress and strain of a material during the elastic deformation stage. Figures 1 and 2 shows the obtained values of the elastic modulus and Poisson’s ratio for each working condition, as summarized in Tables 2 and 3.
| Numerical plans | Rock size (mm) | Elastic modulus (GPa) | ||||
|---|---|---|---|---|---|---|
| Plan 8 | Plan 9 | Plan 10 | Plan 11 | Plan 12 | ||
| s = 10 mm | s = 20 mm | s = 30 mm | s = 40 mm | s = 50 mm | ||
| Plan 1 | l = 100 | 1.750 | 2.957 | 3.236 | 3.519 | 3.338 |
| Plan 2 | l = 200 | 0.864 | 1.542 | 1.681 | 1.769 | 1.607 |
| Plan 3 | l = 400 | 0.438 | 0.734 | 0.859 | 0.911 | 0.834 |
| Plan 4 | l = 600 | 0.290 | 0.488 | 0.563 | 0.570 | 0.557 |
| Plan 5 | l = 800 | 0.218 | 0.380 | 0.406 | 0.439 | 0.418 |
| Plan 6 | l = 1000 | 0.172 | 0.298 | 0.327 | 0.333 | 0.344 |
| Plan 7 | l = 1200 | 0.145 | 0.243 | 0.272 | 0.297 | 0.273 |
| Numerical plans | Rock size (mm) | Poisson’s ratio | ||||
|---|---|---|---|---|---|---|
| Plan 8 | Plan 9 | Plan 10 | Plan 11 | Plan 12 | ||
| s = 10 | s = 20 | s = 30 | s = 40 | s = 50 | ||
| Plan 1 | 100 | 0.3000 | 0.2049 | 0.2200 | 0.2369 | 0.2930 |
| Plan 2 | 200 | 0.2326 | 0.1667 | 0.1429 | 0.1654 | 0.2396 |
| Plan 3 | 400 | 0.1523 | 0.2000 | 0.2111 | 0.2754 | 0.2861 |
| Plan 4 | 600 | 0.1754 | 0.1875 | 0.1867 | 0.2118 | 0.2486 |
| Plan 5 | 800 | 0.1875 | 0.1964 | 0.2097 | 0.2177 | 0.2638 |
| Plan 6 | 1000 | 0.1053 | 0.1750 | 0.2340 | 0.2689 | 0.2673 |
| Plan 7 | 1200 | 0.1586 | 0.1667 | 0.1607 | 0.1944 | 0.3013 |
Bulk modulus is a relatively stable material constant. Fundamentally, there is a relationship between bulk modulus K, elastic modulus E, and Poisson’s ratio ν: K = (E/3) × (1 − 2ν). Furthermore, the bulk modulus K of each working condition was solved according to this equation and the values from Tables 2 and 3, as shown in Table 4.
| Numerical plans | Rock size (mm) | Bulk modulus (GPa) | ||||
|---|---|---|---|---|---|---|
| Plan 8 | Plan 9 | Plan 10 | Plan 11 | Plan 12 | ||
| s = 10 | s = 20 | s = 30 | s = 40 | s = 50 | ||
| Plan 1 | 100 | 1.458 | 1.670 | 1.926 | 2.229 | 2.687 |
| Plan 2 | 200 | 0.538 | 0.771 | 0.784 | 0.881 | 1.028 |
| Plan 3 | 400 | 0.210 | 0.408 | 0.495 | 0.676 | 0.650 |
| Plan 4 | 600 | 0.149 | 0.260 | 0.299 | 0.330 | 0.369 |
| Plan 5 | 800 | 0.117 | 0.209 | 0.233 | 0.259 | 0.295 |
| Plan 6 | 1000 | 0.073 | 0.153 | 0.205 | 0.240 | 0.246 |
| Plan 7 | 1200 | 0.071 | 0.122 | 0.134 | 0.162 | 0.229 |
3.2. Influence of PJS on K
Table 3 summarizes the statistical data, which revealed no clear relationship between Poisson’s ratio, rock size, and PJS, and the data obtained are relatively discrete.
The statistical data, shown in Table 4, demonstrate that K gradually increased as the PJS increased. A data point plot of K and PJS for each size was drawn, and the corresponding curve was fitted, as shown in Figure 3.
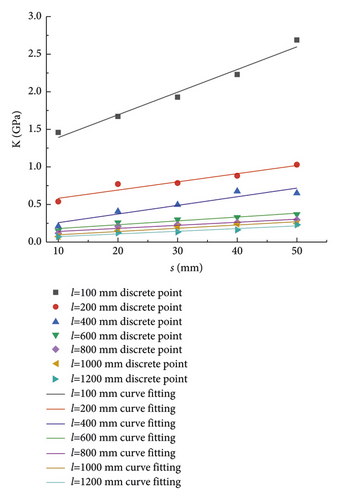
As seen in Figure 3, when the rock size was fixed and unchanged, K was affected by the PJS and increased with the increasing PJS. This pattern of variation remained the same even when the rock size varied. When the PJS was fixed and unchanged, K was affected by the rock size and decreased with an increase in the rock size. This finding indicates that K of the rock with parallel joints exhibited a positive correlation with the PJS and a negative correlation with the rock size. To illustrate this relationship in detail, see the formulae for the regression curves in Table 5.
| Rock size (mm) | Fitting formula | Fitting coefficient (R2) |
|---|---|---|
| 100 | K(s) = 0.027s + 1.089 | 0.976 |
| 200 | K(s) = 0.013s + 0.473 | 0.927 |
| 400 | K(s) = 0.012s + 0.143 | 0.907 |
| 600 | K(s) = 0.005s + 0.128 | 0.917 |
| 800 | K(s) = 0.004s + 0.100 | 0.916 |
| 1000 | K(s) = 0.004s + 0.053 | 0.907 |
| 1200 | K(s) = 0.004s + 0.036 | 0.942 |
The values of the parameters a and b from Table 5 are listed in Table 6 according to (1). The values from Table 6 were used to draw the fitting curves of the rock size and the parameters a and b (see Figure 4).
| Parameter | Values | ||||||
|---|---|---|---|---|---|---|---|
| l = 100 mm | l = 200 mm | l = 400 mm | l = 600 mm | l = 800 mm | l = 1000 mm | l = 1200 mm | |
| A | 0.027 | 0.013 | 0.012 | 0.005 | 0.004 | 0.004 | 0.004 |
| B | 1.089 | 0.473 | 0.143 | 0.128 | 0.100 | 0.053 | 0.036 |
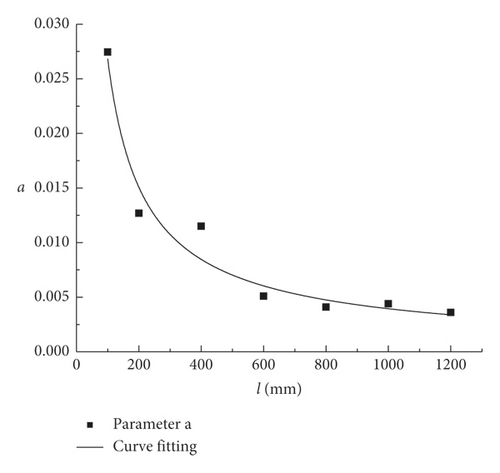
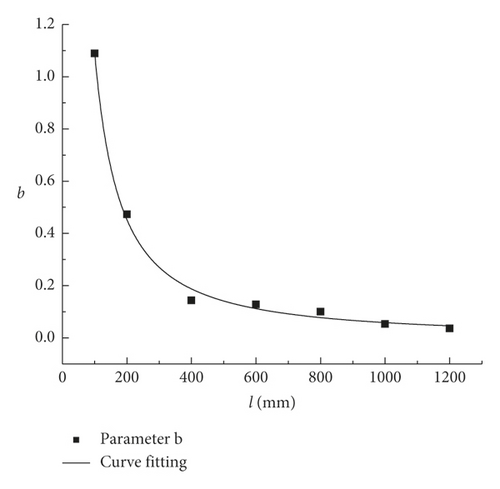
(3) was used to quantify K, thereby providing a special relationship between K and PJS. Overall, it is applicable for solving K on a two-dimensional plane. In particular, for a known rock size, K can be obtained when the PJS was determined.
3.3. Influence of the Size Effect of K
A data point plot of K and the rock size under each PJS was drawn according to the values from Table 4. The corresponding curve was fitted, as shown in Figure 5.
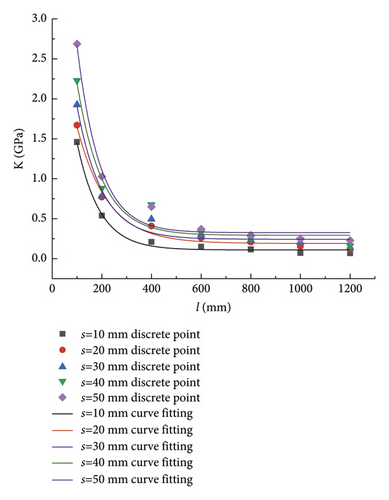
Figure 5 shows that when the PJS was fixed and unchanged, K was affected by the rock size and decreased with the increase in size. This pattern of variation remained the same even if PJS differed. Furthermore, when the rock size was fixed and unchanged, K was affected by rock size and increased accordingly. This phenomenon suggests that, for a rock with parallel joints, its K would have a positive correlation with the PJS, but a negative correlation with the rock size. For details of this relationship, see the formula of the regression curves summarized in Table 7.
| PJS (mm) | Fitting formula | Fitting coefficient (R2) |
|---|---|---|
| 10 | K(l) = 0.110 + 3.254e−0.0093l | 0.995 |
| 20 | K(l) = 0.191 + 3.321e−0.0094l | 0.988 |
| 30 | K(l) = 0.243 + 4.517e−0.0111l | 0.979 |
| 40 | K(l) = 0.293 + 5.132e−0.0126l | 0.963 |
| 50 | K(l) = 0.326 + 6.507e−0.0129l | 0.983 |
The values of the parameters d, f, and g in Table 7 are listed in Table 8 according to (5). Furthermore, the values from Table 8 were used to draw the fitting curves of the rock size (d, f, and g are drawn), as shown in Figure 6.
| Parameters | Values | ||||
|---|---|---|---|---|---|
| s = 10 mm | s = 20 mm | s = 30 mm | s = 40 mm | s = 50 mm | |
| d | 0.1096 | 0.1905 | 0.2431 | 0.2927 | 0.3255 |
| f | 3.2541 | 3.3206 | 4.5174 | 5.1317 | 6.5067 |
| g | 0.0093 | 0.0094 | 0.0111 | 0.0126 | 0.0129 |
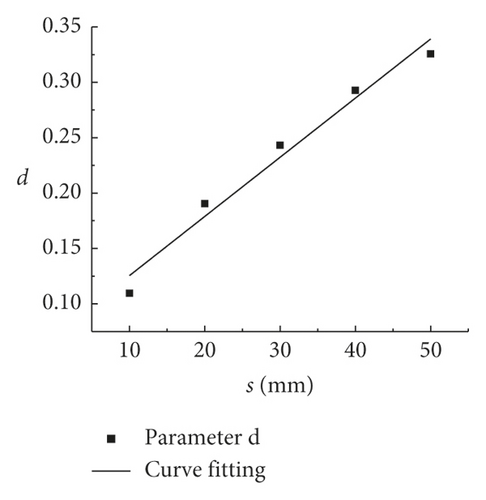
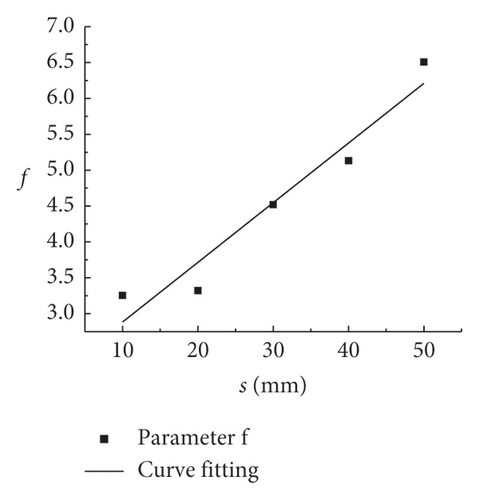
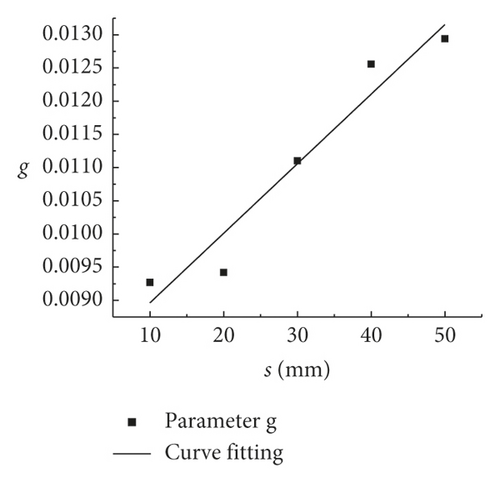
(9) quantifies K, while also providing a special relationship between K and the rock size. Moreover, it can be used for solving K on a two-dimensional plane. Thus, K can be obtained when PJS is known and when the rock size is determined.
3.4. Relationships of CSBM, CBM, and PJS
3.4.1. Derived Formula of CSBM
3.4.2. Relationship of CSBM and PJS
The CSBM was solved, as summarized in Table 9, when the PJS was 10, 20, 30, 40, and 50 mm. The regression curves for the CSBM and PJS are shown in Figure 7.
| PJS (mm) | 10 | 20 | 30 | 40 | 50 |
|---|---|---|---|---|---|
| Characteristic size of bulk modulus (mm) | 690.66 | 683.52 | 622.58 | 570.2 | 574.1 |
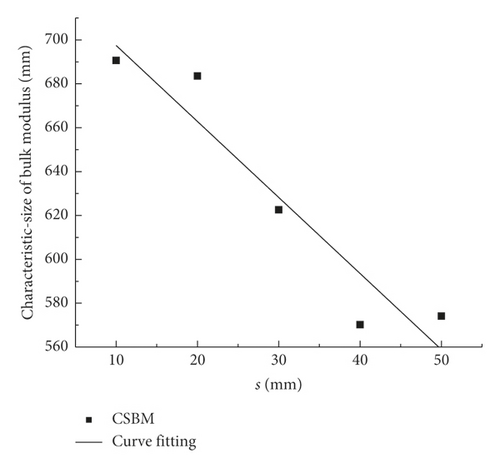
(11) quantifies the CSBM, thereby providing a special relationship between the CSBM and PJS, which can be used for solving the CSBM in a two-dimensional plane. Note that, in field applications, the CSBM can be generally obtained when the PJS is measured.
3.4.3. Relationship of CBM and PJS
The value of CSBM was substituted into (5), and the characteristic bulk modulus (CBM) of rocks with different PJS values is described in Table 10.
| PJS (mm) | 10 | 20 | 30 | 40 | 50 |
|---|---|---|---|---|---|
| Characteristic bulk modulus (GPa) | 0.115 | 0.196 | 0.248 | 0.297 | 0.329 |
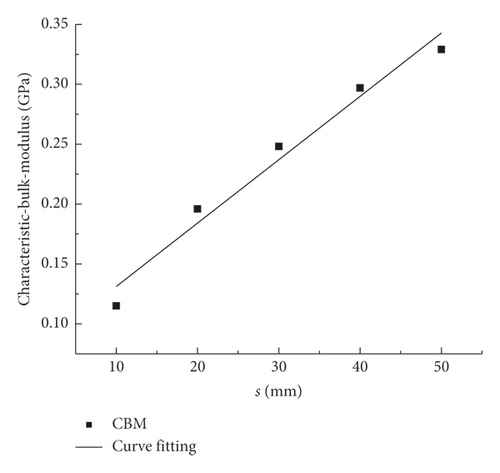
(12) quantifies the CBM and provides a special relationship between the CBM and PJS. It can be used for solving the CBM on a two-dimensional plane. In field applications, the CBM can be obtained when the PJS is measured.
3.5. Verification Analysis
To evaluate the accuracy of our results, we analyzed the applicability of (5). The verification was conducted using the data of elastic moduli for different rock sizes from Figure 3.11 (page 44) in reference [21], as shown in Table 11. From these elastic modulus, the corresponding bulk modulus were calculated and summarized in Table 11. According to Table 11, we obtained a scatter plot and relationship curve of the bulk modulus and rock size (see Figure 9).
| Rock size | 2 m | 4 m | 8 m | 12 m | 16 m |
|---|---|---|---|---|---|
| Elastic modulus (GPa) | 11.38 | 8.06 | 7.66 | 7.39 | 7.29 |
| Bulk modulus (GPa) | 2.0484 | 1.4508 | 1.3788 | 1.3302 | 1.3122 |
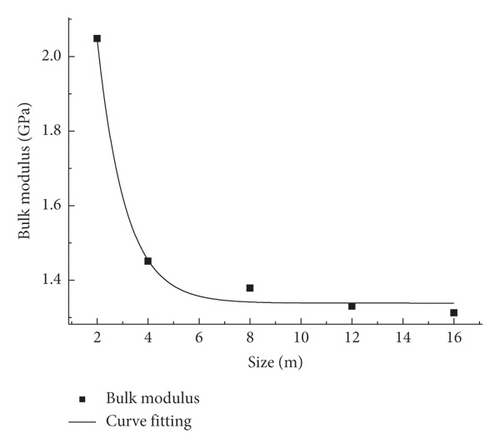
The function type of (13) generally conformed to the mathematical model, introduced in (5). It can be therefore concluded that the numerical simulation and experimental conclusions were consistent. Moreover, the evaluation analysis indicates that the mathematical model, proposed in (5), is applicable for the solution of the bulk modulus with respect to the size.
4. Discussion
The K values of rocks of different sizes varied with the PJS. Importantly, this study established the following four relationships: (1) K and PJS; (2) K and rock size; (3) CSBM and PJS; as well as (4) CBM and PJS. Only a few previous studies considered the size effect of rocks with PJS on K. Moreover, the effect of rock size changes on the K of rocks with PJS, and the effect of the changes in PJS on the size effect of K; both remained understudied.
In this study, the K values of rocks with different sizes were obtained using the data from [21], and (15) was obtained, which confirmed the accuracy of (5). Moreover, it proved that the formula, proposed in the study, stands out with certain universality, thereby also confirming the high accuracy of the research results. However, some differences between the numerical and experimental results were discerned. In addition, the two-dimensional model is limited in simulating three-dimensional samples. Both these challenges can be alleviated in future studies.
Overall, the specific relationships of rock K were obtained in this study. The information about the rock size effect and the PJS is essential as input for the setting of mechanical parameters such as K in rock engineering, which can prevent rock engineering disasters. When the PJS and rock size are available, rock K, CSBM, and CBM can be quickly obtained for a selected engineering site, thereby providing valuable data-driven guidelines for engineering purposes.
5. Conclusions
- (1)
The relationship between K and PJS is linear.
(14) -
We also obtained the special relationship.
(15) -
Moreover, the relationship between K and rock size is exponential:
(16) -
And we obtained the special relationship.
(17) - (2)
CSBM is fundamentally associated with PJS. This study obtained the following relationship:
(18) - (3)
The CBM was found to be related to PJS. This study provided the following relationship:
Conflicts of Interest
The authors declare no conflicts of interest regarding the publication of this paper.
Authors’ Contributions
G Hu contributed to conceptualization, software, and funding acquisition. T Zhao contributed to methodology, data curation, investigation, writing, and original draft preparation. T Wang contributed to data curation and formal analysis. H Zhang was responsible for funding acquisition and formal analysis.
Acknowledgments
This study was supported by the National Natural Science Foundation of China (52004170), Zhejiang Collaborative Innovation Center for Prevention and Control of Mountain Geological Hazards (PCMGH-2017-Y-05), Key Laboratory of Rock Mechanics and Geohazards of Zhejiang Province (ZGRMG-2019-07), and Shaoxing City Public Welfare Technology Application Research Project (2018C30006).
Open Research
Data Availability
The data supporting the findings of this study are available from the corresponding author upon reasonable request.


