Research on Garden Ecosystem Based on Monitoring Sensing Technology
Abstract
Monitoring and evaluating the state variables of garden ecological processes on a long-term scale is one of the hot issues in current garden ecosystem observation research. In view of the problems of poor real-time transmission and storage of observation data in garden ecosystem observation stations, low data sharing, serious data fragmentation, weak construction of big data analysis platform, and lack of real-time prediction and early warning of garden fires, this paper combines remote sensing technology, vorticity correlation technology, and monitoring and sensing technologies such as quadratic survey technology and wireless sensor network, realizes long-term and continuous comprehensive observation of water, soil, air, and growth elements in garden ecosystems, provides the real-time automatic storage and display of carbon budget data, water flux data, flux of energy and meteorological data between garden ecosystems and the atmosphere, storage and display of garden ecosystem service functions, and quantity of value, realizes the monitoring of garden fires and the prediction and early warning of garden fire risks, and can also provide technical support and exploration for the long-term automated observation used for garden ecosystems.
1. Introduction
Long-term and continuous human disturbance seriously threatens the stability and species diversity of garden ecosystems. How to continuously and effectively realize the monitoring of the ecosystem is a key topic and direction worthy of research and has received great attention from experts within the industry in recent years [1, 2].
The experimental stations established for the observation of garden ecosystems continue to emerge, and the combination of remote sensing observation and ground point observation makes the observation scale change from the station scale to the regional scale [3, 4]. Typical comprehensive observations of garden ecosystems include the National Ecological Observation Network (NEOT), the International Long-term Ecological Observation and Research Network (ILTER), and the Global Carbon Flux Network (FLUXNET) [5, 6]. In China, some exploration and analysis have also been made in the monitoring of garden ecosystems, typically in terms of involvement and analysis of monitoring technology and monitoring content [7, 8]. However, there are still problems such as poor real-time transmission and storage of observation data, low data sharing, serious data fragmentation, and weak construction of big data analysis platforms. Wireless sensor network (WSN) technology has the advantages of real-time monitoring and rapid response. Therefore, it has real-time transmission and storage of sensor data and saves it within a certain period of time, which lays the foundation for subsequent data analysis and mining while providing support.
Forest fires seriously affect the forest type, carbon reserve, and biodiversity of the garden ecosystem, leading to the risk of the decline of the function of the garden ecosystem, the transformation of the forest type, and even the disappearance of the garden [9, 10]. In recent years, climate warming and human activities have made the forest fire situation more severe. There are frequent sightseeing tours in the forest farm and frequent sacrificial activities of nearby residents, which brings challenges to garden fire prevention. Therefore, real-time monitoring of garden fires is crucial for maintaining the safety of garden ecosystems. The existing garden ecosystem observation station focuses on the research on the impact of fire on the garden ecosystem, and there are few related reports on the real-time monitoring and forecasting and early warning of garden fires [11, 12]. However, it should be noted that due to the particularity of the composition of gardens, the ecosystem needs to be studied, especially in terms of an ecological environment that can provide a “beautiful landscape” for subsequent sustainable development [13, 14].
For the monitoring of garden ecological environment, it is often necessary to integrate sensor observation and software integration. By focusing on the analysis of garden ecosystem, water flux, energy change, spatiotemporal dynamic change, driving mechanism, etc., this provides corresponding support for the garden ecological environment relying on multiple technologies such as sensor network, telemetry, and flux observation. In view of these deficiencies and requirements, this paper realizes long-term and continuous observation of various related elements of the garden ecosystem (water, energy, soil, and air), etc. relying on monitoring and sensing technology, and realizes the especially early warning judgment and analysis of evolution trend and garden fire of the garden ecosystem through real-time storage and timely processing, to further protect the garden ecosystem and improve the protection efficiency and quality.
2. Monitoring Sensing Technology
For monitoring sensors, it mainly includes specific sensitive components and corresponding circuits. The monitoring sensors can be used to realize the conversion of measurement information into signals according to certain rules, realize the output of specific forms of information, and realize the information transmission, processing, and analysis of data.
For the intelligent monitoring architecture of the sensor network, by integrating the data of various sensing devices such as video and infrared, the characteristics of the relevant targets are obtained from multiple angles and aspects, forming a diverse feature space dimension, which is more conducive to the identification and extraction of targets [15, 16]. The specific fusion is shown in Figure 1. Through the fusion of images, videos, and other data, the characteristics of the target are associated and extracted into a vector file to identify the target characteristics.
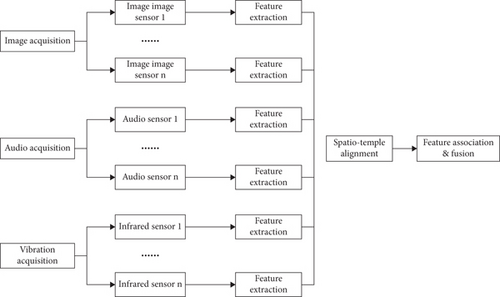
The corresponding data collection, sorting, processing, analysis, and fusion of the data collected are performed by all sensing devices (such as remote sensing and telemetry sensing devices) in the sensor network. As far as the multimedia monitoring network is concerned, streaming media data processing has higher requirements on the accuracy of data collection and data processing capability. Currently, the main body is the data fusion of graphics and images, and other sensor networks involve data for comprehensive time fusion. In particular, the corresponding feature fusion recognition for the target is to perform the corresponding recognition processing based on the combined associated features after classification [17, 18].
The processing and analysis of target images mainly involve video data, audio data, and basic data. Among them, the basic data mainly includes infrared sensing equipment and traditional telemetry data. Usually, the basic data is characterized by a small data flow. Compared with basic data, audio and video data are relatively large and redundant. It needs to be collected, processed, organized, and analyzed with the help of means and hardware devices with strong computing power, so as to realize data compression and feature processing.
- (a)
Original initialization: at this stage, set the corresponding initialization value, and meanwhile, set the initial state of relative positioning as shown in
- (b)
Position evaluation: on the basis of initialization, the historical results of relative positioning are evaluated with an algorithm, to obtain the current position information, and the accuracy of radio frequency positioning is directly used for calculation
- (c)
Determining the threshold value and setting the corresponding threshold value and the length of the history record
- (1)
Express the most recent N times of effective RF positioning results with
- (2)
Translate the relative positioning result and the radio frequency positioning result so that the center of the two is the origin, and the translated coordinate matrix is expressed by
The height of the flux observation tower of the super observatory is 40 m. Meteorological sensors and infrared thermal imagers are distributed on the tower, as shown in Figure 2. The 30 m × 30 m plots around the super observatory are also distributed with vegetation DBH sensors, litter sensors, soil temperature sensors, soil moisture sensors, and soil heat flux sensors.
2.1. GetCapabilities Interface (Table 1)
| Name | Whether mandatory | Client side | Server side |
|---|---|---|---|
| Service | Yes | User specified | Check the user’s request parameters |
| Request | Yes | User specified | Request parameter value |
| Accept versions | No | Automatically added by the system | Check parameters |
| Sections | No | The system provides default values | Respond according to parameter value |
| updateSequence | No | The system provides default values | Respond according to parameter value |
| AcceptFormats | No | The system provides default values | Respond according to parameter value |
GetCapabilities is used to obtain the information of the service itself, and the user will determine the functions provided by the service to the outside world according to the information of the service itself.
The response of the server after receiving the GetCapabilities request is CapabilitiesDocument, and the content contained in CapabilitiesDocument mainly includes ServiceIdentification: SPS service identity.
2.2. DescribeTasking Interface (Table 2)
| Name | Actual meaning | Type | Whether mandatory |
|---|---|---|---|
| Service | Type of service | Character string | Yes |
| Request | Name of the operation | Character string | Yes |
| Version | Version | Character string | Yes |
| SensorID | Device ID of the sensor | Character string | Yes |
DescribeTasking mainly provides task planning for users who sends requests and is a very important operation of the SPS service.
The response of this interface is DescribeTaskingRequestResponse. The structure description is shown in Figure 3.

3. Construction of Field Observation Test Platform
The field observation experiment is composed of ground observation, Landsat TM/OLI sensor, and Terra MODIS sensor observation. The ground observation includes three scales: plot scale, vegetation transect scale, and regional scale. From the perspective of observation targets, the basic experiments are divided into five categories, namely, carbon budget observation, water flux observation, energy flux observation, garden fire risk monitoring, and scale conversion experiments.
3.1. Carbon Budget Observation
- (1)
Observation of Carbon Flux. Eddy correlation systems are considered the best way to measure carbon dioxide fluxes. In order to carry out the research on the vertical distribution of CO2 concentration, the installation heights of the 7-layer closed-circuit CO2/H2O meter are 1 m, 7 m, 11 m, 15 m, 23 m, 31 m, and 38 m, respectively
- (2)
Observation of Vegetation Biomass. Vegetation biomass is divided into belowground biomass and aboveground biomass. The underground biomass of four 15 m × 15 m plots was measured by root-drill sampling, weighing method after dried, and the forest age was observed in four plots of 15 m × 15 m
- (3)
Observation of Soil Carbon Reserve. Vegetation soil samples were collected at sampling depths of 0-10 cm and 10-30 cm, respectively. The laboratory used potassium dichromate volumetric method which is used to measure soil organic matter content to estimate soil carbon storage
3.2. Water Flux Observations
- (1)
Precipitation Observation. The precipitation data of the 30 m × 30 m observation plot was measured by the automatic weather station tipping bucket rain gauge, and the precipitation data of the super observation station was measured by the rain sensor installed at a height of 23 m
- (2)
Observation of Vegetation Evapotranspiration. At the super observatory, one set of open-circuit CO2/H2O meters and seven sets of closed-circuit CO2/H2O meters were used to observe H2O concentration to obtain continuous time series observation data to estimate vegetation evapotranspiration in garden ecosystems
- (3)
Observation of Soil Moisture Content. In order to verify the accuracy of the satellite remote sensing inversion of soil moisture and to study the law of surface heat and moisture transfer, the burial depth of the sensor is set to [5,100]
3.3. Energy Flux Observation
Solar short-wave radiation and atmospheric long-wave radiation are the energy sources of garden ecosystems. In the 30 m × 30 m observation plot, the automatic weather station measures the photosynthetically active radiation. The soil heat flux plates were buried at a depth of 3 cm and 5 cm, to measure the soil heat flux.
3.4. Garden Fire Monitoring
Meteorological factors (wind speed, wind direction, precipitation, air temperature, and relative air humidity), litter volume, and soil moisture are the input parameters of the garden risk forecast model, and the model outputs the garden fire risk level according to real-time data. At the super observatory, wind speed and direction are measured by three-dimensional ultrasonic anemometers and three-layer wind speed sensors (installation heights of 1 m, 7 m, and 11 m); air temperature and relative humidity are measured by three-layer atmospheric temperature and humidity sensors (installation heights of 1 m, 7 m, and 11 m). In the 30 m × 30 m observation plot, wind speed, wind direction, air temperature, and relative air humidity were measured by automatic weather stations.
In the super observatory, the infrared thermal imager installed at a height of 38 m has an effective monitoring radius of 3 km, which realizes all-weather 360° panoramic monitoring of garden infrared thermal images.
3.5. Scale Conversion Test
Developing a scale conversion method between ground observation points and multisource and multiscale remote sensing pixels has always been one of the core issues faced by ecologists [21, 22]. The experiment integrates remote sensing technology, flux observation technology, quadratic survey method, etc., provides vegetation NPP, surface temperature, and soil water content observation data at three scales (sample plot scale, vegetation transect scale, and regional scale), and provides data support for the research on multiscale conversion methods of temperature and soil water content.
4. Simulation Experiment
The carbon budget data, water flux data, energy flux data and meteorological data automatically observed by the field observation and test platform are automatically transmitted to the database server in real time through the wireless sensor network, which provides data support for the construction of the data visualization platform.
4.1. Ecological Wireless Sensor Network
The wireless sensor network is a multihop self-organizing network formed by the ecological observation sensors deployed in the area and communicating with each other through the wireless network communication protocol, which realizes the real-time and automatic acquisition and storage of the measurement data. Landscape-scale observations based on wireless sensor networks fill the scale gap between ground point observations and remote sensing satellites and can provide pixel-scale observations for verification and scale conversion of remote sensing inversion results.
- (1)
The exact location of the sensor nodes is determined by experts and mainly depends on the characteristics of forest type and site conditions. The network technology must be able to support the placement of sensor nodes in arbitrary locations. Furthermore, in order for the collected data to be representative of plant physiology and ecology, the sensor network must be able to cover 1-1.5 km2 and consist of more than 70 sensor devices
- (2)
The network must be able to operate on its own without any mandatory user intervention. They must be able to withstand temperature fluctuations, heal themselves when the environment changes, and be able to operate for years without human intervention
- (3)
Each node must be able to report sensor measurements every 30 min. The network must successfully and securely transmit sensor data to the gateway device, and it must provide users with remote monitoring capabilities, i.e., the ability to remotely assess the health of the network. Ecologists must be able to access the data collected by the sensors within minutes of the measurement
4.2. Collection System Design
The core of the entire garden ecological monitoring and sensing is to realize data collection, that is, to use the data collection module to realize the collection of various elements of the principle ecosystem, and to achieve specific display, storage, processing, and output through the data processing module. The particular acquisition system is shown in Figure 4.
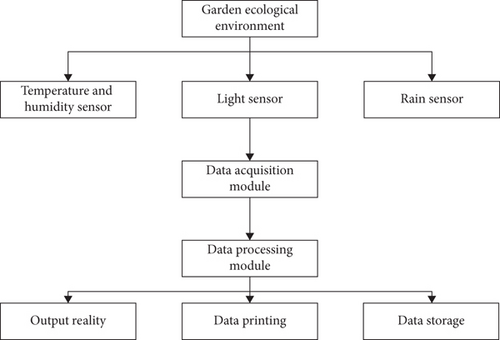
From the data acquisition structure diagram in Figure 4, its main data acquisition part includes two major parts: data acquisition and data processing. The monitoring sensor is an important medium to realize data collection. The main function of the sensor is to use the specific object to be monitored to realize the transformation of the physical parameter signal and realize the output of the signal for data transmission. Therefore, the relative accuracy of data acquisition is largely subject to the inherent performance requirements of the sensor itself. In the specific design process, it may be necessary to analyze the data collection from hardware and software according to the corresponding garden ecological environment requirements.
From the perspective of the specific garden ecosystem, the data information of garden temperature and humidity can be collected through outdoor temperature and humidity sensors, and the corresponding technology can be used to collect data. The main function of the system is to use data collection, data processing, data analysis, and visualization. According to the specific needs and status quo of the garden ecosystem, it is set to 1 min, 5 min, etc. according to the specific time mode. After the data collection button is turned on, by selecting the corresponding interval, the system can automatically collect data, separate the data, save it as a text file, and judge whether the system is running normally through these data [23, 24].
4.3. Design of Remote Monitoring System
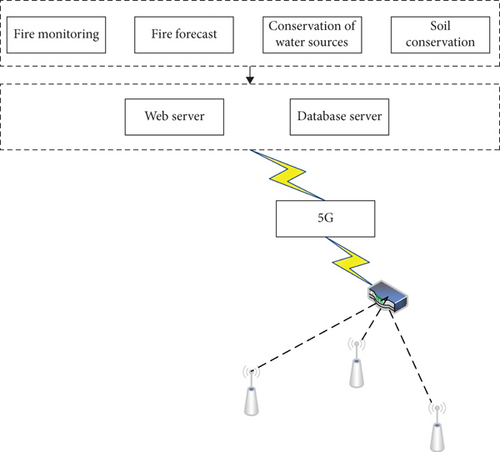
Relying on the analysis of the garden ecosystem based on monitoring and sensing, its monitoring mainly realizes the monitoring and analysis of the temperature, illumination, humidity, and rainfall within the garden and transmits the collected data to the actual client through 5G communication, so that the staff can use the Internet browser to browse and analyze the data information. The specific structural design of the remote monitoring system is shown in Figure 5.

The whole system of monitoring and sensing mainly includes four modules: monitoring sensor, data acquisition and analysis, system server, and remote client side. Among them, the role of the system server is to provide services. In a specific garden ecosystem, the main role of the server side is to provide services for corresponding parameters and analyze specific sensor technologies.
The remote client side provides users with local basic programs and services and realizes the connection between the client side and the server based on the garden ecological server to ensure the normal operation of the program.
SmartMesh IP is a low-power wireless network product based on the IEEE802.15.4e TSCH standard developed by the Dust Networks Product Group of Linear Technology, which meets the above user requirements. SmartMesh IP consists of a single network manager (for monitoring and managing network performance and security and for receiving data to be uploaded to the data center) and up to 100 wireless nodes (for collecting and relaying data). The nodes form a redundant multihop and self-healing wireless mesh network around the manager (Figure 6). Currently, 76,000 SmartMesh networks have been deployed worldwide. The reliability of data transmission exceeds 99%, and the average current consumed on the routing node is less than 50 μA, making the battery life more than 10 A.
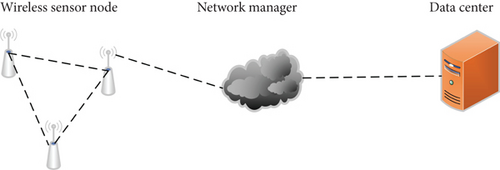
Currently, 5 SmartMesh networks are deployed in this experiment. Among them, 4 SmartMesh networks are deployed in 4 observation plots of 30 m × 30 m; each SmartMesh network consists of a manager, 14 sensor nodes, and multiple relay nodes, in case some sensor nodes are deployed too far from the rest of the network to connect. The SmartMesh network deployed at the super observatory consists of a manager, 29 sensor nodes, and multiple relay nodes. The network manager is installed 2 m above the ground and uploads sensor data and network statistics to the data center server via GSM/GPRS/4G.
The location of sensor nodes is selected according to characteristics such as forest type and site conditions. The sensor nodes cover an area between 1 and 1.5 km2. Network managers are deployed in open areas with good cellular connectivity. Once the sensors and network manager are in place and the device is turned on, utilize the monitoring tools built into the manager to verify connectivity between the sensors. The relay nodes are placed iteratively and the updated connection information is verified. When verifying the connection information, the Dust Networks’ rule is followed; that is, each node has at least 3 neighbors connected to it, and its received signal strength is higher than -85 dBm.
4.4. Function of the Platform
4.4.1. Service Function Subsystem of Garden Ecosystem
- (1)
Observation and Evaluation of Carbon Fixation and Oxygen Release Function. Based on vegetation biomass data, carbon flux data, and satellite remote sensing data, the platform simulates the regional-scale net primary production (NPP) and further estimates the carbon fixation and oxygen release function of garden ecosystem. Specific functions include query and statistical analysis of CO2 concentration, vegetation DBH, and litter thickness; estimation, query, and statistical analysis of vegetation carbon storage and soil carbon storage; and estimation, query, and statistical analysis of forest carbon sequestration and oxygen release and its ecosystem service value [25, 26]
- (2)
Observation and Evaluation of Water Conservation Function. The platform simulates regional-scale soil water content based on water vapor flux data, soil temperature and humidity data, atmospheric temperature and humidity data, and satellite remote sensing data and further estimates the water conservation function of garden ecosystems. Specific functions include query and statistical analysis of precipitation, H2O concentration, and soil water content; estimation, query, and statistical analysis of evapotranspiration; and estimation, display, and statistical analysis of garden water conservation and its ecosystem service value
- (3)
Observation and Evaluation of Conservation Soil Function. The platform simulates the regional-scale soil nitrogen, phosphorus and potassium content based on soil nitrogen, phosphorus and potassium content data, and satellite remote sensing data and further estimates the soil function of garden ecosystem conservation. Specific functions include query and statistical analysis of soil nitrogen content, soil phosphorus content, and soil potassium content and estimation, display, and statistical analysis of garden soil retention and fertilizer retention and its ecosystem service value
4.4.2. Forest Fire Management Subsystem
- (1)
Prediction and Early Warning of Garden Fire Danger Level. Based on meteorological factors (wind speed, wind direction, precipitation, air temperature, and relative air humidity), litter volume, and soil moisture content, the platform establishes a garden fire risk forecast model to evaluate and warn the garden fire risk level. Specific functions include query and statistical analysis of meteorological factors, ground combustibles, and soil moisture content and real-time forecast, mid-term forecast, and historical data query of fire danger levels
- (2)
Garden Fire Monitoring. The platform uses infrared thermal imagers to monitor garden fires in a 360° panorama around the clock. Once the image pixel value exceeds the threshold, a fire alarm will be triggered and a rescue plan will be generated. There are 4 specific functional modules: (1) fire monitoring module, which provides real-time video monitoring, fire alarm, and dynamic playback functions; (2) fire inspection module, which provides fire alarm, fire information query, patrol check-in, and sudden fire use approval, issuing notices, inspection and assessment, and fire filing functions; (3) firefighting module, which provides two-dimensional and three-dimensional electronic sand table, formulating and issuing firefighting plans, command, and dispatching functions; and (4) basic information module, which provides query and display of geomorphic information firefighting, road information, water source information, equipment information, population distribution, sensitive points, and biological isolation zones
4.4.3. Scale Conversion Subsystem
Based on the observation data of 30 m × 30 m observation plots and super observation stations and Landsat TM/OLI image data (spatial resolution of 30 m), the platform uses remote sensing data-driven model to realize the data of garden vegetation GPP and NPP and realize the conversion of garden vegetation GPP, NPP, and soil water content data from site scale to 30 m spatial resolution scale with remote sensing data-driven model. Based on the site observation data, Landsat TM/OLI image data, and Terra MODIS sensor image data (with a spatial resolution of 500 m), the model was used to realize the conversion of garden vegetation GPP, NPP, and soil water content data from site scale to 30 m spatial resolution scale and 500 m spatial resolution. The platform provides query and display of garden vegetation GPP, NPP, and soil moisture data at four scales: site scale, 30 m, 500 m spatial resolution scale, and regional scale.
4.5. System Design
4.5.1. Overall Design
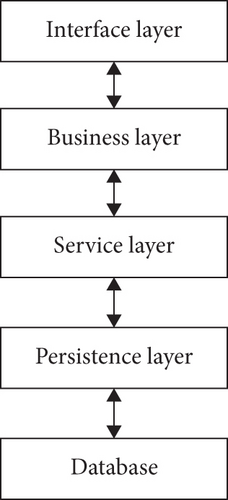
In order to facilitate development and maintenance of good scalability, this paper divides the SPS service into four layers, and its architecture diagram is shown in Figure 7.
4.5.2. Processing Flow
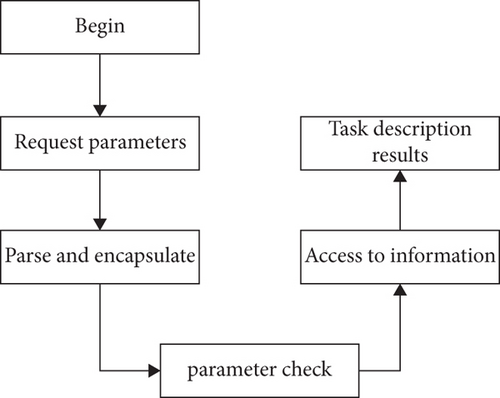
According to the above overall design, when processing user requests, the core interface operations and extended interface operations of SPS will complete a series of operations according to a consistent processing flow.
Through the request of the 3 versions and parameter verification, it will be called by the service layer interface. The BasicSensorPlannerOperator service first checks whether the request has additional requirements. Currently, the request is not allowed to have additional requests by default. The task ID is obtained from the procedure parameter of the request and then reads the corresponding information from the database. The successfully obtained task description information will also be returned to the user in xml format, as shown in Figure 8.
4.6. Application Implementation
4.6.1. Development Environment
The ultimate purpose of studying SPS service specification in this paper is to integrate it into the ecological environment monitoring system. Due to the advantages of java language cross-platform, once compiled, and executed everywhere, this system will be implemented mainly by using java language.
4.6.2. Application Demonstration and Testing
Since the SPS service studied in this paper is a part of the ecological environment monitoring system, in order to facilitate the testing of the service, the front-end test page is designed while the server-side development of the SPS service is completed.
After testing, the submit interface and the other six interfaces can achieve the corresponding functions according to the expected design, and the SPS service can run normally. It can be seen that the SPS service can complete various functions of the sensing resource task planning stage. Simulation experiments show that monitoring and sensing technology can effectively support the research of garden ecosystem.
5. Conclusions
In order to practice “lucid waters and lush mountains are invaluable assets,” it is necessary to pay more attention to the protection of garden ecosystems along with economic development. However, due to the vast territory of China, it is difficult to achieve full coverage by relying solely on human resources for traditional monitoring and analysis. In response to these requirements and deficiencies, this paper attempts to introduce monitoring and sensing technology, through long-term and continuous comprehensive observation of water, soil, air, and biological elements in the garden ecosystem, to try to explore the coupling between the atmosphere, biosphere, and geosphere. It provides important data support for the contribution of the garden ecosystem in the regional carbon cycle, realizes the monitoring, prediction, and early warning of garden fires, and enhances the comprehensive application of wireless sensor network technology, remote sensing technology, flux observation technology, and methods, and finally, it provides an important basis for garden protection. The simulation experiment results show that the monitoring sensor technology can effectively realize the support of garden ecosystem research.
Conflicts of Interest
The authors declare no conflicts of interest.
Open Research
Data Availability
The data used to support the findings of this study are available from the corresponding author upon request.


