Determination of Heavy Metal Pollution in the Dankran River in the Bekwai Municipality of Ghana
Abstract
Water pollution has been a major issue across the globe because of industrial activities to meet the needs of people. Many chemicals are released into the environment through these processes, which affect human health and the environment. Hence, the study aimed to assess the concentration of heavy metals (Cu, Zn, Mn, Ni, Hg, and Fe) and the physicochemical and biological properties of the Dankra River. The samples were taken from three locations, Konyaw, Jumako, and Anwiankwanta, and subjected to standard laboratory tests using Atomic Absorption Spectroscopy (AAS) and Inductively Coupled Plasma Mass Spectroscopy (ICP-MS). Results revealed that the Dankran river was not polluted with the selected heavy metals under study. The physicochemical properties, the biological oxygen demand (BOD), chemical oxygen demand (COD), and nitrogen, phosphorus, and potassium (NPK) concentrations were all within the allowable healthy limits according to WHO standards. Iron was the predominant metal in the Dankran river, with the highest concentration of 6.5913 mg/l. Thus, the river is safe to use, but there is a need for regular monitoring to support life. The order of concentration of the investigated metals follows this pattern in descending order: Fe > Mn > Cu > Zn > Ni > Hg.
1. Introduction
One of the most critical issues facing our society today has been caused by anthropological and natural happenings resulting in the entry of contaminants into the environment. Most pollutants result from industrial plants and municipal sewage treatment plants, while others are from polluted runoff in urban and agricultural areas and historical contamination [1]. A heavy metal that builds up in the food web can result from accumulation in tissues of organisms from the surrounding medium such as water or sediment or by biomagnification from the food source [2]. Many African countries over the previous decades have experienced a sharp increase in urbanization and industrial and agricultural land use due to significant population growth [3]. This growth has necessitated a substantial rise in the release of toxic waste to receiving water bodies, producing an unpleasant situation in the aquatic environment: among all the pollutants, heavy metals are the ones that settle at the bottom of the water sediments [4]. Due to heavy metals’ comparatively high harmful and never-ending essence in the environment, their endangerment has been exasperated [2, 5]. Water pollution in developing countries has reached an alarming situation and Ghana is not an exception. Supervision and feasible management of river catchment areas are crucial subjects in Ghana because of the numerous forces leveled on land and water resources. The Dankran river provides 80% of drinking water to the Bekwai Municipality and its environs with occupational and recreational activities such as fishing. Yet, for the past two decades, the Dankran river basin has experienced continual degeneration by human-induced activities in its hydrography and increased agitation on the decline in water quality. Reference [6] defined heavy metals as the universal elements described by their relatively high atomic mass and density. Although they commonly arise in comparatively low concentrations, they can be found all through the crust of our planet and are frequently known to have the slightest density of 5 g/cm3. Physicochemical properties can interfere with standard biological mechanisms, thus contributing to the inherent hazards of a chemical. Also, they establish a chemical or a substance’s physical hazards, affecting its environmental fate, which includes its degradation and persistence. The measure of BOD can abruptly predict the level of pollution of organic matter in water bodies; these approximate the extent of chemical and biological oxidation, respectively [7]. COD is an essential water quality parameter for constituting the levels of organic pollution and is sternly governed by environmental regulatory agencies [8]. The intended purpose of the BODs test is to determine the possibility of wastewater and other waters utilizing the level of oxygen in receiving waters [9]. The overload of nitrogen in the water, specifically from fertilizer use and fossil fuel emission, frequently results in the speedy development of phytoplankton, for example, algae [10]. Phosphorus is essential to humans, and they are mostly found as phosphates and phosphate esters, forming 1 to 4% of the fat-free mass, of which 85% are in the bones and teeth and the remaining dispersed evenly in the blood and soft tissue [11]. The synthesis and respiration process in the human body is affected by potassium which plays a vital role and the essential regulation of hydration tissues [12]. Due to the increase in anthropology activities, the quality of water has changed and knowledge of their current condition is vital for developing regulations to conserve the country’s water bodies. According to [13], water bodies close to mining sites are polluted with pH, Fe, and P above the WHO recommended values, and Cu, Hg, As, and Fe were above permissible levels for irrigation. Reference [14] reported that rivers in the Kumasi Metropolis are highly contaminated with metals such as cadmium, chromium, Mercury, and arsenic and are related to human activities. Arsenic and chromium released into water bodies as a result of mining and other human activities pose a carcinogenic threat to the local residents [15]. There are high accumulations of heavy metals in the suspended mineral fractions of the Pra river and sediments were also greatly polluted with heavy metal sinks [16]. According to [17], the stream at Kokoteasua recorded high levels of Mn, Fe, and pH above the acceptable WHO drinking water guidelines, and this could pose a health risk to human health. Chemu lagoon recorded the highest mean lead, zinc, and iron, and this can affect the health of aquatic organisms within it [18]. Hence, this study seeks to assess the water concentration of heavy metals, water quality parameters, and other concentrations: biological oxygen demand, chemical oxygen demand, nitrogen, phosphorus, and potassium of the Dankran river.
2. Materials and Methods
2.1. Study Area
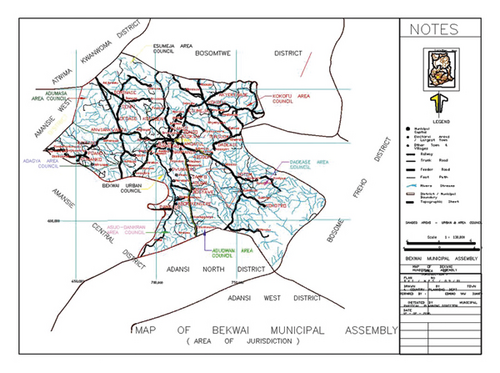
Ashanti Region is one of the 16 regions in Ghana with 27 districts under the Legislative Instruments, L.I.1906 (2007), of which Bekwai Municipal Assembly is one. Dankran river is within the Bekwai Municipality. It lies within latitude 6°00–6°30′N and longitude 1°00–1°35W, covering a land base of approximately 633 sqkm as shown in Figure 1. It takes its source from Konyaw (a town known for its rich mineral deposits), flows southwest toward Jumako to Adankragya, and joins the Oda River at Anwiankwanta, as shown in Figure 1. The river is the water source for the Municipality’s numerous activities, including farming, mining, making ceramic, bricks, roofing tiles, and pottery products. The river offers a considerable prospect for agricultural development throughout the year.
2.2. Climate
The Municipal Assembly experiences a semiequatorial climate, a double maximum rainfall season throughout the year [19]. Thus, between March and July and from September to November, the Municipality Forest area is moist semideciduous, with most parts reserved for future use. The tree species within this forest zone include Odum, Wawa, Edinam, and Mahogany [20]. The “Acheampong” shrub, scientifically called (Chromolaena odorata), is the principal vegetation cover [21].
2.3. Sampling Locations
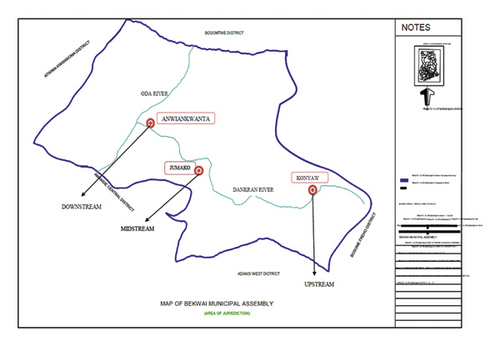
The sample was collected in three locations, that is, Konyaw (the source of the river; sampling point 1), Adankragya (midstream; sampling point 2), and Anwiankwanta (where the river joins Oda River; sampling point 3) as shown in Figure 2, which also shows the location of the Dankran river within the municipality.
2.4. Sample Collection and Preparation
Samples collection from the Dankran river was done on four alternative days at monthly intervals. The research was done during the dry season to prevent any instability in the river. Upon a visit to the river, the sampling points were determined. The three points selected are the major area where the Dankran river flows to meet the Oda River. 24 water samples were collected using the grab method (with this method, bottles were dipped into the river to a specific depth to collect the sample in the river flow direction) [22]. Polyethylene bottles for water sampling were thoroughly washed with soap under running water and rinsed twice with distilled water and dried before use. The bottles were rinsed in the water at the various sampling locations before sampling wearing polyethylene gloves. Three water samples of each sampling day were acidified with concentrated nitric acid, and the remaining samples were then taken to the laboratory and stored in a coolant. However, the polyethylene bottles for the BOD, COD, TN, P, and K were not acidified but stored in a coolant as indicated and taken to the laboratory within five hours. Using the probe apparatus, some physicochemical parameters were determined on-site and the remaining in the laboratory.
2.5. Laboratory Analyses
2.5.1. Water Samples Analysis
Palintest Micro 800 Multi (Halma, UK) pH/Conductivity/TDS/Temperature meter was used to measure pH, conductivity, TDS, and temperature. 10 ml of the sample was taken using a graduated cylinder and transferred to the sample cell for the turbidity test. After that, the sample cell surface was carefully wiped with tissue paper and positioned in the instrument light cabinet and sealed with the light shield. The turbidity reading was recorded in NTU, and the procedure was repeated for all the samples in triplicate. The other parameters were determined by calibrating their individual probes, and then, the measurement of the samples was done for each in triplicate.
2.5.2. Analysis of Water Samples for Cu, Mn, Ni, Fe, Zn, and K
A commercially prepared Cu, Mn, Ni, Fe, and K standard solution (1000 mg/L) was obtained from Merck (Darmstadt, Germany). In preparing the standards for the instrument calibration, the stock solution was consecutively lessened with 1% HNO3 (Table 1). The instrument calibration was done using an analyte-free solution (0.1% HCl solution) as the blank solution.
| Element (analyte) | Standard working solutions (mg/L) |
|---|---|
| Cu | 2, 4, 6, 8 and 10 |
| Zn | 0.2, 0.4, 0.6, 0.8 and 1.0 |
| Mn | 1, 2, 3, 4 and 5 |
| Ni | 2, 4, 6, 8 and 10 |
| Fe | 1, 2, 3, 4 and 5 |
| K | 0.2, 0.4, 0.6, 0.8 and 1.0 |
Flame Atomic Absorption Spectroscopy (FAAS) measurements were performed on the Analytikjena model novAA400P atomic absorption spectrophotometer (Drawell- Chongqing, China) using the single-beam optical mode. A hollow cathode lamp (HCL) for the respective elements was used as a light source for the analysis. Air (specifically air kept under pressure higher than atmospheric pressure) and acetylene (N26 quality, Air Liquide, Ghana) were used as the oxidizer and the fuel gas for the flame, respectively.
These elements then absorb light (generated from the HCl) at a specific wavelength (Table 2) ultraviolet spectrum. This is dependent on the wavelength of maximum absorption of the analyte. After absorption, the transmitted light is detected by a detector after going through a monochromator. Five different solutions of known concentrations were used to calibrate the instrument, and the samples were analyzed in triplicate.
| Element (analyte) | Wavelength (nm) | Slit width (nm) | Power supply (mA) | Flame, flow setting (L/h) |
|---|---|---|---|---|
| Cu | 324.8 | 1.2 | 2 | 50 |
| Zn | 213.9 | 0.5 | 2 | 50 |
| Mn | 279.5 | 0.2 | 5 | 60 |
| Ni | 232.0 | 0.2 | 3 | 55 |
| Fe | 248.3 | 0.2 | 4 | 65 |
| K | 766.5 | 0.8 | 4 | 80 |
2.5.3. Analysis of Sample for Mercury
50 ml of a water sample was put into a 300 ml Erlenmeyer reaction flask, and 5 ml of concentrated H2SO4 and 2.5 ml of concentrated HNO3 were added to the flask. 15 ml of KMnO4 was added, and the flask was left to stand for at least 15 min, after being swirled to result in a homogeneous mixture [23]. 8 ml of K2S2O8 solution was added to the flask and heated in a water bath for 2 hours at 95°C and allowed cool to 20°C. To get rid of the excess KMnO4, 5 ml of hydroxylamine was added. The whole process was replicated for each water sample. Using the same chemicals, a blank solution was made [24].
2.5.4. Analysis of Sample for BOD
100 ml of the sample was poured into a 300 ml BOD bottle and diluted with water till it overflowed. In preparing the blank solution, a second BOD bottle was filled with dilution water. Using a HACH LDO meter, the initial oxygen concentration of the diluted and blank solutions was determined. The two BOD bottles were incubated at 20°C for five days. The dissolved oxygen left in the sample was measured using the LDO meter on the fifth day.
2.5.5. Analysis of Sample for COD
2.5.6. Analysis of Sample for Total Nitrogen
The Hach method was used for the total nitrogen determination. 0.5 ml of the sample was put in a vial and 2 ml of Hach TNT 827 solution A was added. After that, one tablet of B was added to it and closed immediately. The mixture was heated in a reactor for 30 mins at 120°C and allowed to cool to room temperature. The solution was inverted for some time, and 0.5 ml of the digested solution was pipetted into a cuvette. 0.2 ml of Hach TNT 827 solution D was added to the pipetted solution and inverted for a few minutes. The solution was allowed to react for 15 mins, and the total nitrogen was analyzed using a spectrophotometer [26].
2.5.7. Analysis of Sample for Phosphorus
The Ascorbic Acid (PhosVer 3) method was used for the determination of phosphorus in the sample. In determining phosphorus, Program 490 P React. PV was used for the Hach Programs. A clean, round sample cell was filled with a known 5 ml of the water sample and diluted with 5 ml of distilled water. One PhosVer 3 phosphate Powder Pillow was added to the diluted solution. The sample cell was immediately corked and turned upside for the contents to mix well, for 2 mins. A second sample cell was filled with 10 ml blank solution and dropped in the cell holder of the spectrophotometer. After 4 mins, the prepared sample was also placed in the cell holder and phosphorus concentration was read in mg/L P.
2.5.8. Water Pollution Analysis
The contamination level was determined by comparing the concentration of a metal to its respective MAC value in direct proportion. With this index, water cannot be used for elements with a metal index greater than 1, that is, when the element concentration is higher than their MAC. Thus, the highest limit for any MI is one (1). This research was done with MI calculation in assessing the Cu, Zn, Mn, Ni, and Fe pollution levels. The values provided by the WHO were used for MAC in this calculation.
2.5.9. Degree of Contamination
2.5.10. Statistical Analysis
Microsoft Excel (2016) and Graphpad Prism version 6 were used for statistical analysis and one-way ANOVA for the significant test. The results were subjected to a significance level of 5%, and the relationship between the findings was established at the same significance level.
3. Results and Discussion
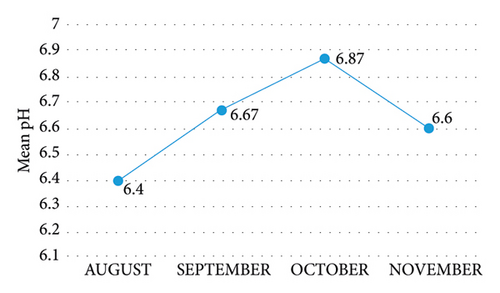
pH in the months under study was relatively stable, with a mean range of 6.4 in August to 6.87 in October (Figure 3). It was observed that pH follows a specific trend as it increased from August through to October and dropped in November. It was, however, relatively high along with the downstream for September and October. Also, the pH for the downstream during the period under study was relatively higher than the midstream which was also higher than that of the upstream. The coefficient of variation values of pH was between a minimum value of 6.0 and a maximum value of 7.4. However, all pH values were within the required range of 6.5–8.5, as [32] indicated for drinking water and domestic use. Therefore, the pH cannot cause any harm to human health, because at the pH levels obtained from the measurement, they can support biological and chemical activities without any impediment.
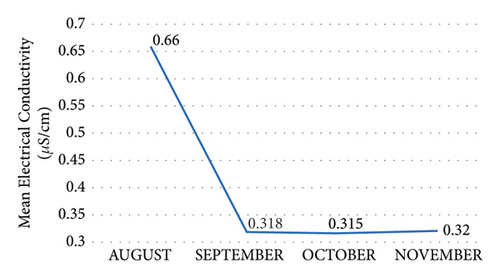
The electrical conductivity was measured according to the period under study. It was observed that there was consistency in the upstream and midstream and relatively decreased across the period (0.3–6.6 μS/cm) except for a decrease in electrical conductivity from August to October and a decrease in November (Figure 4). Reference [33] recommended that 1000 μS/cm is the acceptable electrical conductivity limit for freshwater. Again, [34] indicated that it is expected that averagely a typical, uncontaminated water body should be approximately 350 μS/cm. This current study's result ranges from 0.182 to 1.17 μS/cm indicating that it has a low electrical conductivity which falls within the acceptable limit recommended by World Health Organization. The highest value recordings were seen in the midstream in all the sample sites; this can be directly related to increased microbial activity and higher velocity of the river in these parts. Even though the EC was within the permissible limit, it can also cause nutrient imbalance leading to inadequate nutrient levels for healthy growth and plant stress. This has caused some of the plants in the catchment area to be yellowing or brown leaves, necrosis on leaves, or holes in leaves.
Mean turbidity values ranged from a high 233.72 NTU in August to 223.86 NTU in November, with downstream values recording relatively low levels compared with upstream values. However, midstream values were high. A significant increase in September followed by a sharp decrease through November was observed. The extremely high turbidity values suggest a high level of disturbance in the river and increased microbial activity. Residents in the area will thus have to treat this water before drinking or for other domestic uses like cooking. The high turbidity could affect light penetration, and this can affect plant growth and cause other damages to the plant.
Actual color values were lower in the downstream part (176 Pt/Co) followed by the upstream part (948 Pt/Co), and then the midstream part recorded the highest (2,626 Pt/Co). A similar trend was recorded in apparent color. The mean values for apparent color were relatively higher (2185.67, 2553.72, 2330, 2440) Pt/Co than that of the actual color (293.33, 217.33, 287.33, 453) Pt/Co. The apparent color and actual color were beyond the permissible limit for water samples given by the World Health Organization [35]. However, the actual color of water samples is significantly lesser than the apparent color. Highly colored water has a substantial impact on aquatic plants and algal growth. Light is very essential for the growth of aquatic plants and colored water can limit the penetration of light. Thus, a highly colored body of water could not sustain aquatic life which could lead to the long-term impairment of the ecosystem.
The mean salinity level varied with the months of sampling with a rise from August (45.6 mg/L) to October (61.49 mg/L) and a sudden drop in November (36.04 mg/L). Upstream recorded a steady increase (from 21.64 to 34.98 mg/L) while there was a relatively rise and fall at midstream. However, downstream rose in salinity from 95.82 mg/L in September to 104.95 mg/L in October and a sudden fall to 28.62 mg/L in November. The total dissolved salts (salts) in a given water body constitute and define the salinity of the water body. The actual highest value was 104.95 mg/L which was within safety standards (Table 3). The salinity of the Dankran river is relatively low and thus safe for domestic use [13]. Salinity is highly dependent on the dissolved salts in a given water body. This may also be impacted by the proximity of the river or lake to the seas which explains why the salinity in most water bodies in the Greater Accra region of Ghana is high. Following the details of this research, however, the results show low values of dissolved salts and hence low salinity levels as compared to international standards and the standards set by the World Health Organization.
| Sampling months | P-value | August | September | October | November | |||||||
|---|---|---|---|---|---|---|---|---|---|---|---|---|
| Sampling points/parameter | US | DS | MS | US | DS | MS | US | MS | DS | US | MS | |
| pH | 0.03 | 6 | 6.4 | 6.8 | 6.2 | 6.6 | 7.2 | 6.4 | 6.8 | 7.4 | 6 | 6.6 |
| Electrical conductivity (μs/Cm) | 0.02 | 0.21 | 1.17 | 0.6 | 0.18 | 0.183 | 0.59 | 0.2 | 0.185 | 0.56 | 0.21 | 0.19 |
| Turbidity (Ntu) | 0.01 | 68.7 | 627 | 5.45 | 53.4 | 645 | 3.95 | 37 | 637 | 7.24 | 34.5 | 632 |
| True color (Pt/Co) | 0.35 | 105 | 717 | 58 | 33 | 596 | 23 | 4 | 806 | 52 | 806 | 507 |
| App color (Pt/Co) | 0.01 | 477 | 6017 | 63 | 334 | 7275 | 52.15 | 214 | 6715 | 61 | 248 | 7015 |
| Salinity (mg/L) | 0.59 | 21.64 | 47.71 | 67.46 | 24.73 | 52.15 | 95.82 | 28.62 | 50.89 | 104.95 | 34.98 | 44.53 |
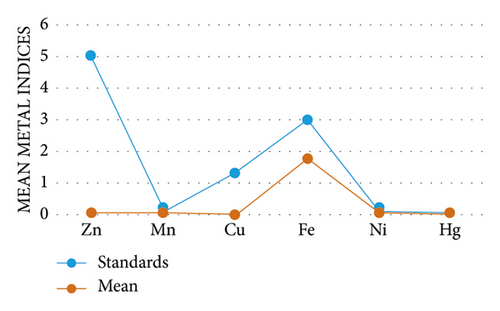
The graph below shows the mean pollution indices of Zn, Mn, Cu, Fe, Ni, and Hg with standard concentrations. Figure 5 shows that the pollution indices of the heavy metals were below standard concentration, indicating the Dankran river is not polluted with the said heavy metals.
BOD test helps to quantify the measure of biodegradable natural material of water test [36]. The unpolluted water has a BOD estimation of 3 mg/L or less, and the polluted water body has as high as 25 mg/L and more [37]. The BOD of the water samples was in the range of 5 mg/L to 85 mg/L and the mean range of 49 mg/L to 59.33 mg/L (Table 4), indicating that the Dankran river has high BOD [13]. This could be due to the continual degeneration by human-induced activities such as fishing, mining, and throwing waste substances into the river. It was observed that the trend in the increase in COD shows population load and activities resulting from the mixing of sewage water, garbage dumping, and industrial discharge; thus, there is a need for periodic monitoring and control. The values of nitrogen were within the acceptable limit prescribed by [38]. The high BOD and COD could affect aquatic life because there will be a low level of dissolved oxygen in the river which they need to survive.
Nitrogen is the fundamental source of nitrates, which constitute proteins, chlorophyll, and numerous other natural compounds. The value of nitrogen in water varied from 1.8 mg/L to 5.04 mg/L and mean values of 2.477 mg/L to 3.472 mg/L Table 4 which was within the acceptable limit prescribed by [38]. These nutrients are normally present in the climate and characteristic supplement cycling processes that forestall the amassing of high groupings of the nutrients; nonetheless, human activities have expanded ecological nutrient fixation with agriculture being a significant source [39, 40]. This incorporates expanded utilization of nitrogen-containing composts just as concentrated animals and poultry farming; the latter two produce a large number of huge loads of nitrate-containing excrement every year [41].
There was a significant difference (P ≤ 0.05) in the pH, EC, turbidity, and apparent color at the three sampling points (down, upper, and mid streams), indicating that at the various levels, the paraments vary within the river. But there is no significant difference in the true color and salinity, indicating that these parameters remain the same at the various sampling points.
The result indicates that potassium content in the water samples was within the permissible limits as per the guideline laid down by WHO in 2019 [31]. But there were observed fluctuations in the concentrations between sampling locations; Table 4 shows range values of 1.514 mg/L to 10.75 mg/L and mean values within 3.509 mg/L and 8.347 mg/L. The presence of potassium in the water may be basically due to human activities along the river, mainly the use of fertilizers for farming [42, 43]. On the other hand, the level of phosphorous was a little above the allowed limit of 0.1 mg/L by [30]. Its recorded values ranged within 0.04 mg/L and 1.9 mg/L with mean values of 0.243 mg/L to 0.0733 mg/L (Table 4). This increasing level of concentration may be a result of extensive farming along the river banks with a high probability of farmers using fertilizer. On average, Iron (Fe), and Manganese (Mn) had concentrations higher than the other metals in all the tests performed. Mercury (Hg), Zinc (Zn), Copper (Cu), and Nickel (Ni) relatively occurred in very small concentrations, almost negligible [16, 17]. The order of concentration of the investigated metals follows this pattern in descending order; Fe > Mn > Cu > Zn > Ni > Hg. The metal concentrations were significantly different between sampling locations and months. However, the concentrations of Zn, Cu, Mn, Hg, and Ni were found to be below the highest permissible value of USEPA and WHO, with the exception of Fe which was beyond the permissible limits.
| Sampling months | P-value | August | September | October | November | ||||||||
|---|---|---|---|---|---|---|---|---|---|---|---|---|---|
| Sampling points/parameter | US | DS | MS | US | DS | MS | US | MS | DS | US | MS | DS | |
| Cu (μg/L) | 0.27 | 0.0586 | 0.0594 | 0.0257 | 0.0655 | 0.0833 | 0.0833 | 0.0799 | 0.0422 | 0.0744 | 0.071 | 0.0188 | 0.0669 |
| Zn (μg/L) | 0.02 | 0.142 | 0.1 | 0.0618 | 0.1225 | 0.0917 | 0.0844 | 0.131 | 0.114 | 0.0631 | 0.122 | 0.135 | 0.0746 |
| Mn (μg/L) | 0.01 | 1.145 | 0.2971 | 0.1663 | 2.485 | 0.3124 | 0.496 | 3.231 | 0.446 | 0.074 | 4.257 | 0.2668 | 0.0601 |
| Ni (μg/L) | 0.19 | 0.345 | 0.0222 | 0.0074 | 0.032 | 0.0205 | 0.0292 | 0.3265 | 0.3507 | 0.322 | 0.3229 | 0.3647 | 0.3522 |
| Fe (mg/L) | 0.01 | 5.633 | 4.011 | 2.162 | 6.382 | 4.22 | 1.949 | 3.211 | 13.92 | 1.529 | 3.749 | 13.67 | 2.355 |
| Hg (μg/L) | 0.13 | 0.005 | 0.0007 | 0.0015 | 0.0002 | 0.0004 | 0.0012 | 0.0038 | 0.0004 | 0.0021 | 0.0021 | 0.001 | 0.0015 |
| BOD (mg/L) | 0.2 | 65 | 5 | 15 | 56 | 8 | 83 | 40 | 70 | 68 | 61 | 85 | 58 |
| COD (mg/L) | 0.23 | 185 | 13 | 38 | 165 | 20 | 208 | 106 | 166 | 164 | 152 | 196 | 145 |
| TN (mg/L) | 0.02 | 2.13 | 1.8 | 3.5 | 2.8 | 2 | 4.03 | 1.96 | 2.25 | 4.37 | 2.352 | 3.024 | 5.04 |
| P (mg/L) | 0.19 | 0.04 | 0.06 | 0.23 | 0.06 | 0.07 | 0.9 | 0.16 | 0.14 | 1.9 | 0.07 | 0.07 | 0.59 |
| K (mg/L) | 0.01 | 1.533 | 2.53 | 6.646 | 1.514 | 2.464 | 10.64 | 10.74 | 3.55 | 10.75 | 1.65 | 3.497 | 9.777 |
The contamination factor for all heavy metals can be categorized as having low concentration because they were all below one (<1) Table 5, and this further confirms that the river is safe to be used by the people living close to the river.
| CF values | CF category | Extent of contamination |
|---|---|---|
| <1 | 0 | Low contamination |
| 1 ≤ CF < 3 | 1 | Moderate contamination |
| 3 ≤ CF < 6 | 2 | Considerable contamination |
| >6 | 3 | Very high contamination |
4. Conclusion
Results reveal that the Dankran river is safe for domestic use as it does not contain high concentrations of heavy or poisonous metals. The concentration of Mercury (Hg), a very poisonous metal, was very low. The Dankran river is thus not only safe for domestic use but also for agricultural activities but could affect aquatic life (both flora and fauna) because of high BOD and COD. Inferring from the results and tests, also the electrical conductivity of the Dankran river is very low; thus, there is an extensive conclusion from Total Salt Deposits (TSD). The deposits of salts like potassium and calcium were extremely low and chemically electrical conductivity increased with an increased number of impurities like salts. The results further define a very low pollution index according to standardized values by WHO. There were very low concentrations of heavy metals, salts, turbidity, and almost neutral pH. The Dankran river has the tendency to support life because it is not polluted.
Conflicts of Interest
The authors declare no conflicts of interest.
Open Research
Data Availability
Data are available upon request.


