Study on Seismic Response Characteristics of Shield Tunnel in Soil-Rock Combination Stratum
Abstract
The sharp change of stiffness in the soil-rock combination stratum is the weak point in the seismic design of the tunnel structure. To explore the influence of soil-rock combination stratum vibration on the shield tunnel, the section of Jinan rail transit line 4 at the Olympic Sports Center is used as the research background. Firstly, the two-dimensional numerical model is established, and the internal force calculation and distribution law of the structure are studied. Then, based on the third similarity theory, the model similarity physical relationship is derived. The shaking-table model test of the soil-rock-structure system is carried out. The seismic response law of tunnel cross-section is studied by the model test and numerical analysis. The results revealed the following: (1) the peak bending moment distribution diagram derived from numerical calculation is consistent with that obtained from the shaking-table model test, which has shown that the numerical and experimental methods are correct, and the research results are available for the seismic resistance of shield tunnels. (2) The deformation, axial force, shear force, and bending moment of the tunnel structure in the soil-rock combination stratum under the action of S-wave change abruptly and significantly at the soil-rock interface section, and the difference in structural stress between the upper and lower sides of the soil-rock interface increased by 65.5%. The excessive stress difference changes the damage mode of the tunnel. (3) The relative difference and abrupt change of bending moment and shear force at the interface is more significant than the axial force, so that the tunnel structure at the soil-rock interface is most prone to bending-shear damage.
1. Introduction
The shield method [1, 2], as one of the main methods of tunnel construction, has been widely used in the field of urban underground rail transit engineering construction. Many underground structures were severely damaged by the Kobe earthquake, and the structures were either completely collapsed or could not be used as they became irreparable. It fully exposed the problem of underground structures resisting earthquakes [3, 4]. With the development of urban subway tunnels, there are more records of earthquake damage to underground structures [5, 6]. For tunnel structures in complex geological conditions, the strength of the restraint effect of the surrounding strata on the tunnel results in different damage states, where the lateral force characteristic of the tunnel sheet is the key point for seismic performance control, especially when the tunnel structure crosses the stratigraphic interface, where the soil stiffness and shear properties change sharply.
The existing analysis methods are divided into the pseudostatic method [7] and the dynamic analysis method [8] in terms of mechanical characteristics, and the dynamic analysis method is one of the most effective analytical methods to study the interaction between the structure and the soil medium under seismic excitation in complex geological conditions. Liu et al. [9] established a three-dimensional finite element model to analyze the seismic response of immersed tube tunnels in different sites. Huang et al. [10] carried out shaking-table model tests for longitudinal soil-rock abrupt change strata and studied the effect of the input angle of seismic waves on the longitudinal dynamic response of the tunnel structure. Shen [11] designed a shaking-table test based on the longitudinal equivalent stiffness of shield tunnel to study its dynamic response characteristics for the shield tunnel, crossing soft and hard strata. Cheng [12] used the ABAQUS software to establish a refined numerical model of three-dimensional soil-concrete pipe sheet structure and bolts between pipe rings to obtain the structural response law of a large-diameter shield tunnel through soft and hard abruptly changing strata under longitudinal seismic effects. Wang et al. [13] carried out the shaking-table tests of shield tunnels under cracks in the strata and conducted the shaking-table tests of loess-free field as well as horseshoe-shaped tunnel structure foundation interactions.
The above studies mainly focus on the effect of sharp changes in tunnel longitudinal stratigraphy on the seismic response of the structure, however, most of these studies only use a single research method. Usually, it is difficult to verify the validity of the results obtained by a single research method. Using a variety of mutually verifiable research methods may effectively improve the reliability of the results. Therefore, in this study, establish a two-dimensional dynamic analysis model, study the interaction response law of the soil-rock stratum tunnel system through numerical analysis, and obtain the response values of soil-rock geological structure changes to the internal force and acceleration of shield tunnel. Then, shaking-table tests are conducted for shield tunnels under soil-rock combination fields to visualize the seismic response mechanism of the structure; meanwhile, the shaking table test reveals the dynamic response of the geological changes to the cross-section of the shield tunnel structure.
2. Engineering Research Background
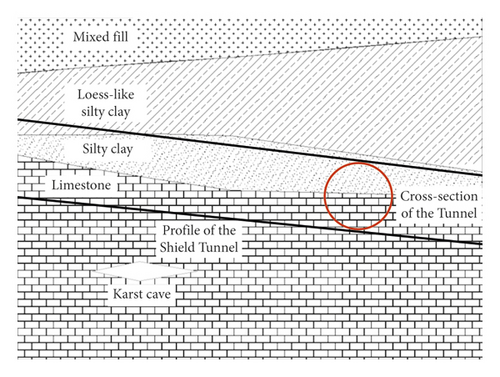
Rail transit line 4 is the main rail transportation line linking the west and east city regions, and the area where the traffic line project is located belongs to the North China Seismic Zone. In this paper, the crossing node of the selected tunnel is located in the section of the Olympic Sports Center Station of Rail Transit Line 4, with a minimum embedded depth of about 10.3 m and a maximum depth of about 12.2 m, as shown in Figure 1. The tunnel passes through a complex stratigraphic environment with mixed fill, loess-like silty clay, silty clay, limestone, etc. The state of the upper silty clay layer is mainly plastic to hard plastic, while the lower layers of rock are mainly Paleozoic Ordovician limestone with rock quality class III and RQD = 20∼80. The upper soft and lower hard strata are in close contact, so that the cross-section of the shield tunnel is in the upper soil and lower rock strata at the same time, and the soil and rock stiffness changes along the depth direction because of the abrupt material change in the soil-rock stratum and the difference in the embedment restraint mechanism of soil and rock. These unfavorable factors bring more uncertainty and challenge to the seismic design of shield tunnels and other underground structures in this stratum distribution form. Therefore, it is important to carry out the lateral seismic study of the tunnel under relevant geological conditions. The typical soil and rock combination stratum was selected for this study. The stratum was simplified into two types of hard and soft strata, and the direction of the interface was parallel to the longitudinal axis of the tunnel.
3. Numerical Simulation of Shield Tunnel in Soil and Rock Combination Stratum
3.1. Soil-Rock Combination Stratum Model
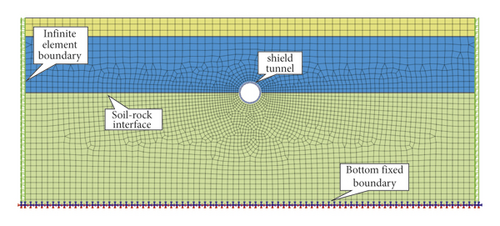
Based on MIDAS/GTS finite element software, an equivalent linear model is used for the soil and rock, an elastic model is used for the pipe sheet material, a fixed boundary condition is used at the bottom, an interface element layer is set between the soil and the structure, and a dynamic finite element model is established, as shown in Figure 2. The numerical analysis model is easier to solve and obtain the detailed distribution of the internal force of the shield tunnel structure and provide suggestions on model making, sensors arrangement, and ground motion input for the subsequent shaking-table test. The element type of stratum is two-dimensional planar element. Mixed fill, silty clay, and limestone are used in the Mohr-Coulomb elastoplastic principal model, considering the reduction of segment stiffness caused by segment joint and the influence of segment joint assembly. The segment ring has ηEI (η ≤ 1, EI is the bending stiffness of the cross-section of the homogeneous tunnel), and the transverse stiffness of the tunnel is reduced by a coefficient of 0.6∼0.8 [14], which is taken as η = 0.8. The material parameters of the structure and stratum are taken, as shown in Table 1. The relative sliding or detachment of the tunnel structure and the soil body occurs, resulting in the inability to transfer the forces exerted by the forced displacement of the soil body, and to simulate the actual contact condition, considering the frictional shear effect at the contact surface because of the change in stiffness between different materials, an interface elements layer is set up between the stratum and the tunnel [15]. The interface element defines the contact behavior automatically by MIDAS according to the stiffness value between two materials. The bedrock is used at a depth of 5 times the diameter of the tunnel below to ensure good convergence and stability of the numerical calculation.
| Material | Severe γ (kN·m−3) | Modulus of elasticity E (MPa) | Cohesion c (kPa) | Internal friction angle φ (°) | Poisson’s ratio μ |
|---|---|---|---|---|---|
| Mixed fill | 19.2 | 12 | 18.0 | 12.0 | 0.37 |
| Silty clay | 17.9 | 25 | 30.2 | 17.8 | 0.32 |
| Limestone | 21.2 | 6000 | 217.0 | 35.0 | 0.39 |
| Bedrock | 25.6 | 17200 | — | — | 0.20 |
| C50 concrete | 25.0 | 34500 | — | — | 0.20 |
3.2. Seismic Wave Selection and Loading Conditions
El-Centro wave is selected for numerical simulation in this study. El-Centro wave is a typical near-field strong earthquake wave, which is suitable for cohesive soil sites. The input bedrock seismic waves are E1 frequent earthquakes with a peak acceleration of 0.05 g, E2 fortification earthquakes with a peak acceleration of 0.10 g, and unidirectional x seismic waves are input from the bottom of the model.
The free-field eigenvalue analysis was performed on the soil-rock site to obtain the first two orders of self-oscillation periods, where the sum of the maximum mass participation coefficients of the model exceeded 80% for calculation. In the soil-rock tunnel model, the cross-section of the structure is in the dual media of powder clay and rock, and the stratigraphic partition interface is at 1/2 cross-section.
3.3. Structural Internal Force Analysis
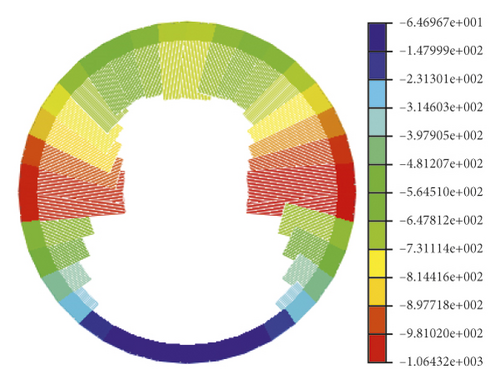
The internal force values of the tunnel structure in the soil-rock combination stratum are shown in Table 2. The values of the internal force of the tunnel structure on the upper and lower sides of the stratigraphic interface are extracted for two different sets of seismic loading conditions. The shear force relative differences were 31.2% and 50.0%. The relative value difference percentage of the bending moment was 41.6% and 50.2%. The relative value differences percentage of the structural internal force values increased gradually with the increase of seismic load level, in which the difference of shear force and bending moment at the soil-rock partition interface was significantly larger than the abrupt changes of axial force. Even if the abrupt change of the axial force at the partition interface is an unfavorable section, the axial force is not the dominant factor in the seismic design at the soil-rock partition interface because of the large compressive bearing capacity of concrete. Since the shear and flexural bearing capacity of concrete structures is mainly provided by internal reinforcement, the tunnel structure at the soil-rock interface is most prone to bending and shear damage, and the tunnel structure bending-shear structural measures should be strengthened during the seismic design.
| Seismic waves (g) | Location | The right side of structure | The left side of structure | ||||
|---|---|---|---|---|---|---|---|
| Axial force N (kN) | Bending moment M (kN·m) | Shear force V (kN) | Axial force N (kN) | Bending moment M (kN·m) | Shear force V (kN) | ||
| 0.05 | Upper interface | −860.7 | −168.8 | 167.2 | −891.1 | −175.3 | 158.6 |
| Lower interface | −755.2 | −116.2 | 97.6 | −795.2 | −120.4 | 93.7 | |
| 0.10 | Upper interface | −1 065.6 | −273.2 | 352.1 | −1 125.6 | −293.6 | 264.2 |
| Lower interface | −892.1 | −155.2 | 241.3 | −867.2 | −146.9 | 131.5 | |
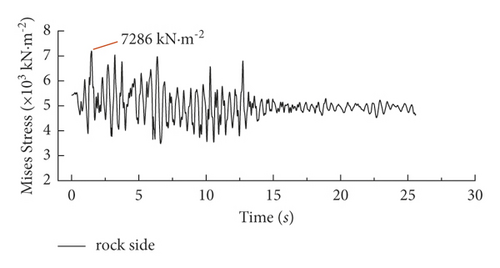
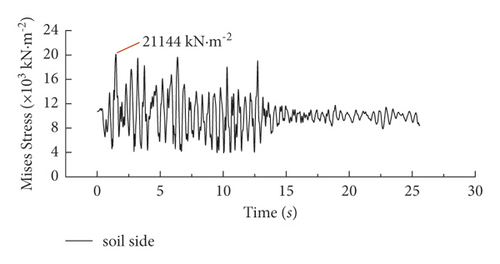
The time history curves of maximum Mises stress at rock side (lower interface) and soil side (upper interface) are shown in Figure 3. The stress value of the tunnel structure at the soil-rock transition section increases from 7286 kN·m−2 to 21,144 kN·m−2, and the structural stress increased by 65.5%. The excessive stress difference causes secondary stresses inside the structure to change the damage pattern of the structure, resulting in the tunnel structure at the soil-rock transition interface damage pattern changing from compression-bending damage state to bending-shear damage state.
3.4. Distribution Law of Structural Internal Force
According to existing studies, the tunnel is mainly controlled by the static load under the action of medium and small earthquakes in the soil field, and the structural bending moment gradually changes to the antisymmetric form as the seismic load level increases. The axial force distribution is compressed in the full section, and the shear force is distributed in 45° antisymmetric form along the counterclockwise direction [16].
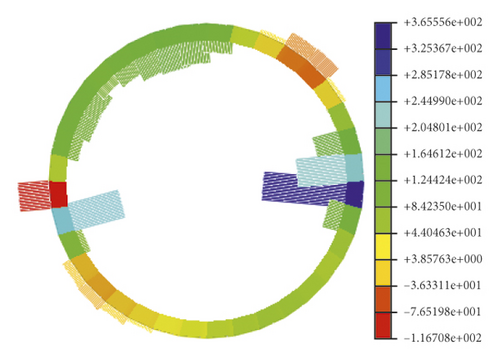
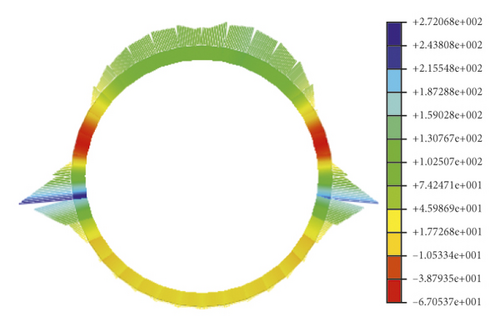
In the soil-rock combination field, the soil properties change sharply along with the soil depth, and the stiffness and shear properties of the surrounding rock are significantly different from those of the clay. Figure 4 presents the structural cloud diagram of the tunnel structure in the soil-rock combination field under the action of 0.10 g seismic wave for the axial force, shear force, and bending moment of the tube piece. The analysis results show that the axial force of the tunnel structure in the soil-rock stratum under the action of seismic waves is still symmetrically distributed in the full-section compressed state. The bending moment shows a four-peak phenomenon, with the maximum value occurring at the soil-rock interface in an axisymmetric distribution. The shear force distribution of the structure in the interface region undergoes a significant abrupt change. On both sides of the soil-rock partition interface, the internal force response of the structure on the soil side is larger. This phenomenon may be because the main deformation of the tunnel tube is the forced displacement caused by the deformation of the surrounding soil layer during the seismic action, especially in the section of abrupt changes in the ground stiffness, shear parameters, etc., which will cause unfavorable situation areas of stress. Therefore, the lateral seismic design of the tunnel structure should focus on the case of abrupt changes in geological conditions.
4. Shaking-Table Model Test
The shaking-table test is mainly to further study the dynamic response law of the tunnel structure cross-section under the earthquake action. The numerical analysis and the response law of the structure obtained from the shaking-table test are used to verify the accuracy of the study.
4.1. Shaking-Table Testing System
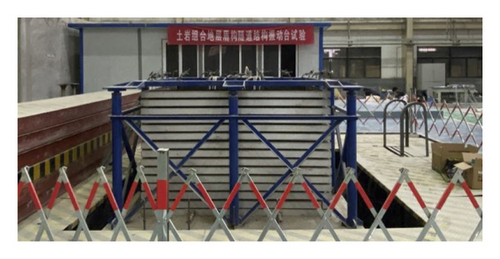
The test was conducted on a three-way hydraulic servo-driven seismic simulation test bench of Shandong Jianzhu University, with a table size of 3 m × 3 m, the system frequency range of 0–100 Hz, the maximum load of 10 t, the maximum acceleration of 1.5 g in X, Y, and Z directions, and the maximum amplitude of ±125 mm, with a laminated shear model box of 2.0 m × 1.5 m × 1.5 m assembled on the shaking-table. The excitation direction is along the long side of the model box horizontal excitation, and the model box is as shown in Figure 5.
4.2. Similarity Ratio Design
The model did not reach the damage stage in the test. Hence, the ultimate strength similarity of the material is not all required. The geometric similarity ratio of the tunnel model is selected as 1/25, the similarity ratio of the unit weight is 1/1, and the similarity ratio of the elastic modulus is 1/125, with the length l, density ρ, and elastic modulus E as the basic physical quantities. In the dynamic test of the underground structure, the similarity ratio of the soil is very important to the influence of the shaking-table test, which is mainly based on the shear wave velocity and density as the basic physical quantities, assuming that the model soil density similarity ratio is 1. According to the similarity principle [17–20], a volume analysis can be performed to derive other relevant parameter ratios, as shown in Table 3.
| Physical quantity | Similar relationship | Similarity ratio |
|---|---|---|
| Length/l | Cl | 1/25 |
| Modulus of elasticity/E | CE | 1/125 |
| Unit weight/γ | 1 | 1 |
| Strain/ε | 1 | 1/ |
| Stress/σ | CECσ | 1/125 |
| Effective overpressure/F | Cl | 1/25 |
| Time/t | 1/12.5 | |
| Frequency/w | 1/Ct | 12.5 |
| Acceleration/a | 2.3 |
4.3. Similar Materials for Tunnels and Rock
4.3.1. Tunnel Structure Similar Materials
| Name | Flexural stiffness | Slotting depth (mm) | Slotting width (mm) |
|---|---|---|---|
| Arch top/arch bottom | 50 | 3.5 | 7.6 |
| Arched waist | 35 | 2.2 | 7.6 |
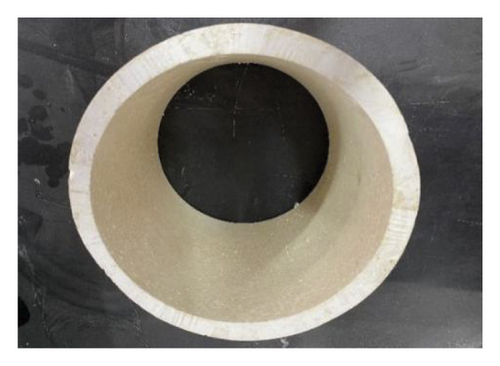
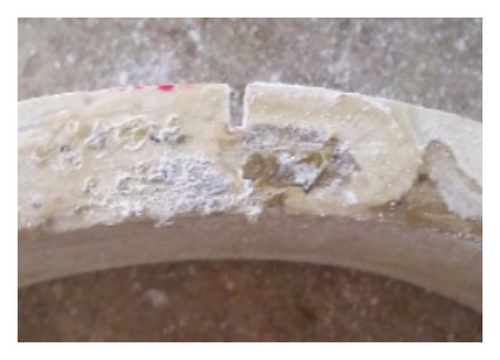
4.3.2. Similar Materials for Soil-Rock Combination Stratigraphy
According to the geotechnical investigation report and the similar ratio relationship, the prototype site soil is selected for the silty clay stratum, controlling the same water content and weight. The surrounding rock is with quartz sand and gravel as aggregate, along with silicate cement and gypsum as the binder material. Density, cohesion, internal friction angle, and other physical and mechanical parameters have a large impact on the structural response. The mixed materials are subjected to the direct shear test and laboratory geotechnical test to determine the above parameters. The mass ratio of the surrounding rock in this model is shown in Table 5, and the physical parameters of the prototype foundation and the model are shown in Table 6.
| Molding materials | Quartz sand | Stone | Gypsum powder | Silicate cement |
|---|---|---|---|---|
| Mass ratio | 10 | 0.2 | 4 | 1 |
| Material | Unit weight γ (kN·m−3) | Modulus of elasticity E/(MPa) | Cohesion c/(kPa) | Internal friction angle φ (°) |
|---|---|---|---|---|
| Silty clay | 17.9 | 0.6 | 30.2 | 17.8 |
| Surrounding rocks | 21.2 | 200 | 217 | 35 |
4.4. Experimental Design and Seismic Wave Loading
4.4.1. Test Sensor Arrangements
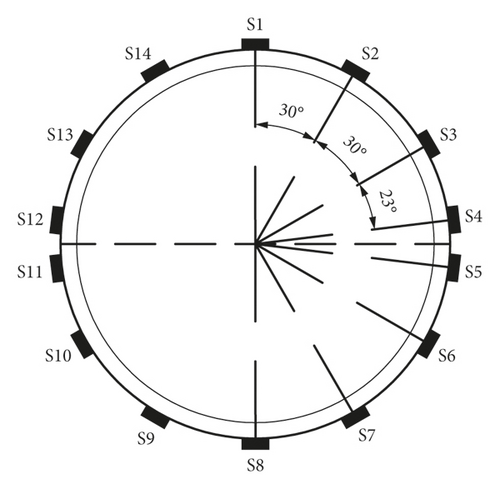
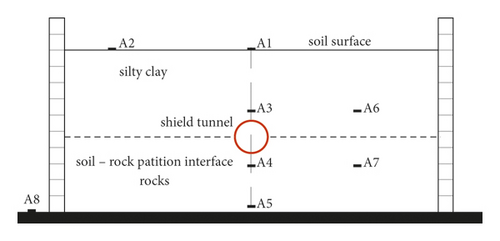
The test requires the acquisition of structural acceleration, strain, and other data. The principle of sensor arrangement is based on the research content. One observation surface A–A was set up in the model. To reduce the unfavorable influence of the boundary effect on the test, strain sensors S1∼S14 are arranged on the A–A observation surface in the circular direction along the inside and outside of the tunnel to obtain the bending moment of the cross-section of the structure, as shown in Figure 7. Accelerometers A1–A2 were arranged on the surface of the soil, A3–A7 were arranged in the surrounding soil and rock, and A8 was located on the table of the shaking-table as the reference acceleration input monitoring point, as shown in Figure 8.
4.4.2. Test Loading Scheme
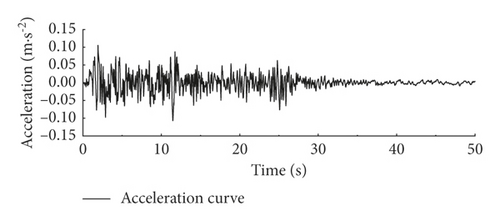
The test is proposed using the El-Centro wave as input ground motion. The bedrock seismic waves are referred to the seismic waves provided by the Earthquake Engineering Research Institute of Shandong Province with a 50-year probability of exceedance of 10% (multiple encounter earthquake, peak acceleration 0.05 g), and a 50-year probability of exceedance of 5% (fortified earthquake, peak acceleration 0.10 g), and the corresponding acceleration peaks are 0.115 g and 0.230 g after baseline adjustment and similar relationship conversion, with a seismic wave duration of 26.324 s and a time step of 0.00616 s. The frequency scanning with the white noise of the amplitude of 0.05 g is performed before and after each level of loading to observe the changes in self-oscillation frequency and damping of the soil-model structure interaction system. The specific test conditions are shown in Table 7, and the seismic wave time history curves are shown in Figure 9.
| Name | Waveform | Acceleration | Duration (s) | Direction |
|---|---|---|---|---|
| 1 | White noise | 0.05 g | 30 | One-way x |
| 2 | El-Centro | 0.115 g | 30 | |
| 3 | White noise | 0.05 g | 30 | |
| 4 | El-Centro | 0.230 g | 30 | |
| 5 | White noise | 0.05 g | 30 |
5. Result Analysis of Shaking-Table Model Testing
5.1. Shear Box Boundary Effect Verification
The acceleration curves of the two measurement points A1 and A2 have the same trend of change and show the same acceleration dynamic response change law. Figure 10 shows the diophantine coefficient curve, with the increase of the ground vibration input peak index µ increasing roughly linearly, indicating that the boundary effect is gradually enhanced with the increase of earthquake intensity, and the maximum of the collecting data results is 0.16, which meets the test error requirements.

5.2. Predominant Period in Soil-Rock Combination Stratum
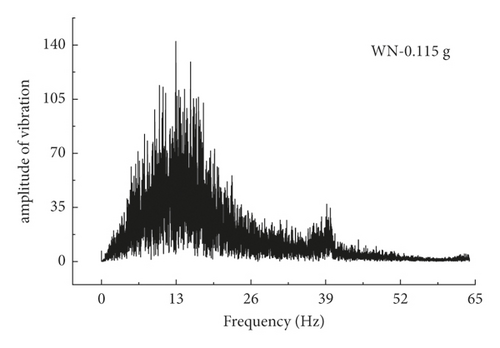
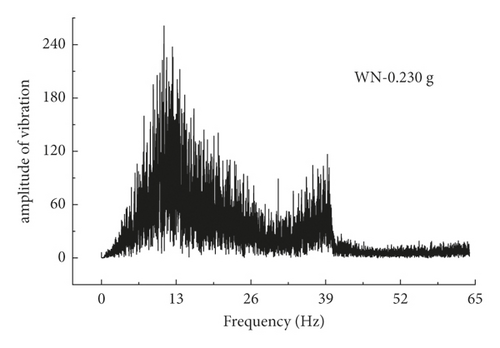
Site natural vibration period is an important index parameter for the seismic design of underground structures and the vibration characteristics inherent to the underground structure and soil system. In this study, the self-vibration characteristics of free sites are usually determined by the white noise signal scanning method. The A1 acceleration sensor on the surface of the foundation is the white noise transfer curve measurement point, and the scanned frequency data is filtered and processed with Fourier transform using MATLAB to obtain the predominant period variation trend of the test model, as shown in Figure 11. In the soil-rock combination field, the predominant period of the site is more inclined to the first modal frequency of 13.68 Hz, and with the increase of the peak loading load, the soil-rock field is enhanced by the second-order modal influence. The first-order modal frequency is reduced to 12.05 Hz, and the change of modal distribution tends to the characteristics of the silty clay, which is because the damage characteristics of the limestone are more easily broken under the action of external forces, and the lower surrounding rock enters the damage state to decrease the transmission efficiency of seismic waves.
5.3. Structural Dynamic Response Analysis
5.3.1. Model Structural Strain
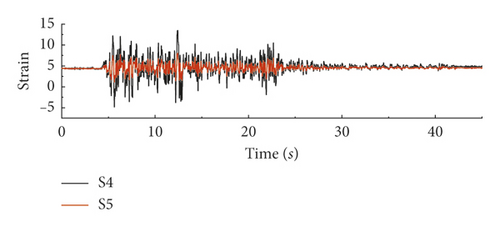
In the shaking-table test, the time history curves of dynamic strains under 0.115 g peak acceleration were extracted from the measurement points on the soil side and the surrounding rock side at the soil-rock interface, as shown in Figure 12. The strains at the lower and upper parts of the interface are 127.8 µε and 218.6 µε. The stress time history curves on the upper and lower sides of the soil-rock interface of the tunnel structure in the numerical analysis, as shown in Figure 3, are the same as the test strain curves roughly, which intuitively reflect the influence of soil-rock abrupt changes on the internal force of the structure and indicate that the abrupt change in the interface area of the strata is an unfavorable factor for the seismic design of the structure.
5.3.2. Distribution Law of Peak Bending Moment of the Tunnel Structure
The peak bending moment distribution of the structure is calculated from the peak strain at each measurement point of the tunnel structure, as shown in Figure 13. The distribution of peak bending moment under 0.115 g acceleration from the shaking-table test in figure 13(a) is consistent with the distribution of bending moment in figure 4(c), obtained from a numerical analysis under 0.05 g peak acceleration to verify the reliability of the analysis.
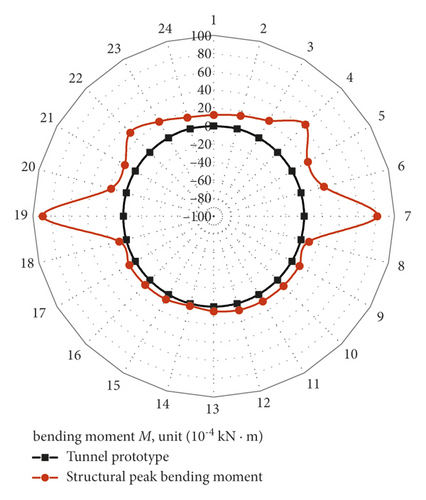
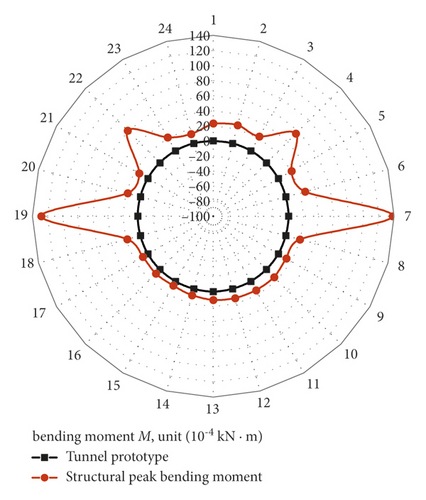
The comparison of the bending moment distribution of the model test with the numerical analysis of the structural bending moment distribution (i.e., Figures 13 and 4(c)) shows that the bending moments at the soil-rock partition interface change abruptly, and the second peak phenomenon appears at 45° counterclockwise of the structure, which is symmetrically distributed. As the seismic load level increases, the second peak gradually transitions to the vault. The second peak bending moment occurs between ±45° and 60° of the structure, which is because of the vertical overlying soil self-weight on the tunnel structure and the embedded constraint of the lower surrounding rock on the structure, and the forced displacement imposed by the soil body on the structure under the action of the seismic load is mainly borne by the tunnel structure on the soil side, and the direction of the synthetic force by the action is mainly in ±45° to ±60°, so that the second peak of the strain is generated. Therefore, the overall strength of the shield tunnel on one side of the soil should be strengthened in the seismic design.
5.3.3. Tunnel Structure Acceleration Analysis
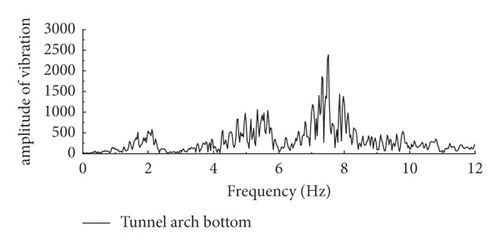
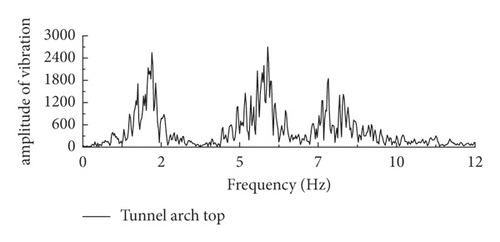
The acceleration time curves of the vault and arch of the tunnel structure are derived and Fourier transformed. The response law of different frequency bands of the tunnel structure under the action of seismic waves are obtained, as shown in Figure 14. The tunnel structure in the rock has an amplification effect on the high-frequency 6–8 Hz band of seismic waves and a low frequency 1.5–2.5 Hz band in the soil layer. At the same time, compared with the amplification effect of the high-frequency band of the tunnel structure in the rock, the percentage of the high-frequency band of seismic waves at the location of the tunnel vault shows a significant decrease, and the seismic waves in a certain high-frequency band will be filtered by the soil layer during the propagation of seismic waves in the soil layer.
6. Conclusion
- (1)
Under the earthquake loading, the internal force values of the shield tunnel structure in the soil-rock combination stratum increased significantly from the lower side rock to the upper side soil, and the tunnel structural stress increased by 65.5%. The excessive stress difference causes secondary stresses inside the structure and changes the damage pattern of the tunnel.
- (2)
The abrupt increase of the shear force at the soil-rock interface is significantly higher than the increase of axial force. Meanwhile, the shear bearing capacity of the concrete structure is mainly provided by the internal reinforcement. Hence, the tunnel structure at the soil-rock interface is most susceptible to bending-shear damage.
- (3)
Compared with the amplification effect of the high-frequency band of the tunnel structure in the rock, the percentage of the high-frequency band of seismic waves at the tunnel vault shows a significant decrease, i.e., the high-frequency band of seismic waves will be filtered by the soil layer during earthquake waves propagated from the lower rock to the upper soil layer.
- (4)
Since the tunnel tube pieces are prefabricated structures, in the process of seismic design of the structure, the local stiffness of the structure should be enhanced in the soil-rock combination stratum, and the bending-shear structural measures of the shield tunnel should be strengthened to improve the seismic performance.
Conflicts of Interest
The authors declare that there are no conflicts of interest regarding the publication of this paper.
Acknowledgments
The research work in this paper was supported by the Science and Technology Development Program of Jinan City, with Grant no. 201807005, and Science and Technology Program Project of Shandong Provincial Department of Transportation, with Grant no. 2019B11.
Open Research
Data Availability
Some or all data, models, or codes that support the findings of this study are available from the corresponding author upon reasonable request.


