Research on the Residual Carrying Capacity of Composite Decks with MCL Connectors under Fatigue Load
Abstract
To investigate the mechanical behavior of the profiled steel-concrete composite deck with modified clothoid (MCL) connectors under fatigue load, a method for calculating the residual carrying capacity of the composite deck is proposed, and a finite element (FE) model is established to analyze the mechanism of the composite decks after fatigue failure. The maximum error between the theoretical method and the test result is 4%, and for the finite element model, the maximum error is 9%. The result indicates that the residual carrying capacities of the composite deck obtained from the theoretical method and the finite element model accord well with the test results. Parametric analysis is performed to investigate the influence of the shear span length Lsp, the modified clothoid shape connector spacing Lmc, and the upper flange depth hc of the concrete slab. It reveals that with the increase of the shear span length and the MCL connector spacing, the residual carrying capacity decreases exponentially. Additionally, the relation between hc and the residual capacity of the composite deck is linear. The study is helpful for the fatigue design of the profiled steel-concrete composite decks.
1. Introduction
With the economic development in China, the profiled steel-concrete composite structures are widely used in bridge engineering. Compared with the reinforced concrete (RC) beams, the profiled steel-concrete composite decks with modified clothoid connectors have the advantages of better mechanical property, construction convenience, and time-saving [1, 2]. The composite deck will be subjected to various kinds of loads during its service life, among which the vehicle load has the greatest influence. Under the action of the vehicle load, fatigue damage will occur in the composite deck and lead to its failure. Hence, it is significant to investigate the residual carrying capacity of the profiled steel-concrete composite deck under a fatigue load.
In recent years, studies on the fatigue performance of composite decks mainly focused on stiffness and displacement. Zhang [3] investigated the fatigue performance of the orthotropic steel-concrete composite deck by numerical simulation and fatigue test. The results showed that the cracks in concrete accelerated the development of fatigue damage of the composite decks, but the error between the theoretical method and the test results was relatively larger in the later stage of fatigue loading. Fatigue tests were performed by Temple [4] to study the mechanical behavior of the composite decks with different shear span lengths. The results showed that the composite deck with a longer shear span was more likely to fail under fatigue loading. Nevertheless, the relationship between fatigue damage and the shear span length was not specified in the study. To investigate the effect of the cyclic loads on the residual strength of the composite deck with stud connectors, El Zohairy et al. [5] conducted a fatigue test on four specimens. The results revealed that the composite deck with a partial shear connection was more prone to be damaged under fatigue load. To investigate the variation law of the residual deflection, Song et al. [6] conducted a fatigue test on the composite decks and proposed an analytical model to predict the residual deflection of the composite decks under a negative moment.
However, literature on the calculation of the residual carrying capacity of the profiled steel-concrete composite decks under fatigue load is limited [7]. On the basis of the material residual strength theory, Wang proposed a calculation method for the residual carrying capacity of the composite deck [8]. Xiang and He developed the calculation method for the residual carrying capacity of the composite decks with the consideration of the initial defect of the headed studs [9]. Nevertheless, the effect of crack propagation was not considered in the calculation method.
In this paper, a theoretical method for the residual carrying capacity calculation of the profiled steel-concrete composite deck with MCL connectors under fatigue load is proposed based on the material strength degradation theory, and the FE model is established to analyze the mechanism of the composite decks after failure. Both the theoretical method and the FE model are verified by the test results. Additionally, the parametric analysis is performed to investigate the influence of the geometrical parameters and shear span length on the mechanical behavior of the composite deck.
2. Theoretical Method for Residual Carrying Capacity Calculation
To calculate the residual carrying capacity of the profiled steel-concrete composite decks under fatigue load, the strength degradation law of each component of the composite deck is taken into consideration according to the material residual strength theory [10].
2.1. Strength Degradation Law of Concrete Slab
2.2. Strength Degradation Law of Steel Plate
2.3. Effective Cross-Sectional Area
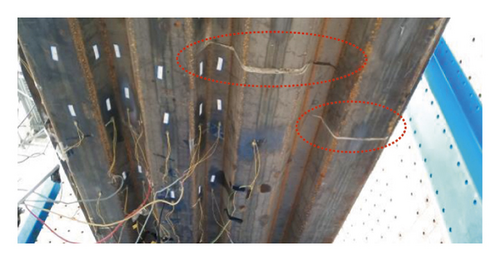
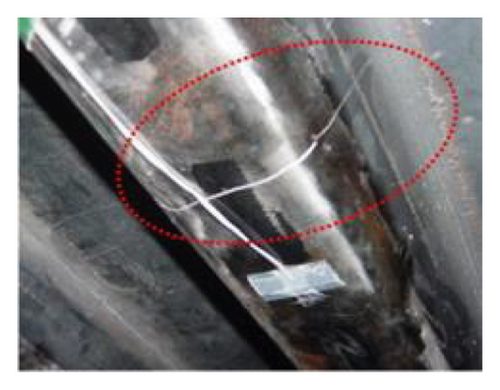
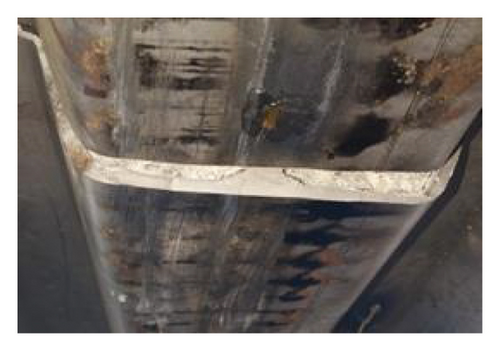
For the profiled steel-concrete composite deck under fatigue load, cracks generally appeared in the pure bending section. In the early stage of the fatigue test, the crack initiated at the welding part between the shear connector and the steel plate and propagated along the transversal direction of the steel plate. With the increase of the cycle number, the crack penetrated through the lower flange of the steel plate and extended to the rib of the steel plate, which led to the failure of the composite deck, as shown in Figure 1.
2.4. Composite Deck with Partial Shear Connection
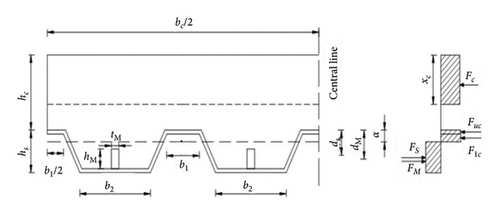
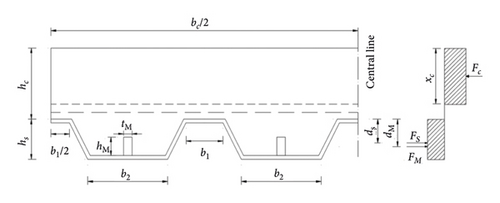
Usually, the shear connectors of the composite deck will be damaged due to the existence of cracks, and the composite deck is generally with a partial shear connection. Hence, the residual carrying capacity calculation of the composite deck can be divided into two cases based on the position of the neutral axis: (1) the neutral axis is inside the cross section of the steel plate and (2) the neutral axis is an outside cross section of the steel plate, as shown in Figure 4.
2.4.1. Case 1: Neutral Axis outside the Cross Section of the Steel Plate
2.4.2. Case 2: Neutral Axis inside the Cross-Section of the Steel Plate
2.5. Composite Deck with Complete Shear Connection
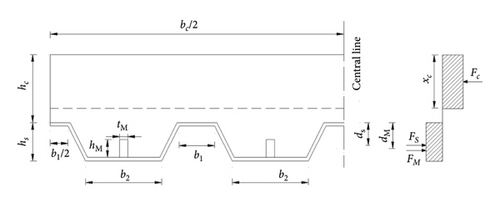
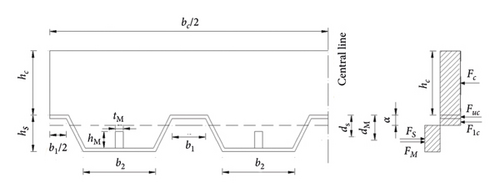
For the composite deck under complete shear connection, its bearing capacity calculation can be divided into two cases as follows:
2.5.1. Case 1: Neutral Axis outside the Cross-Section of the Steel Plate
2.5.2. Case 2: Neutral Axis inside the Cross Section of the Steel Plate
3. Validation of the Theoretical Method
3.1. Experiments
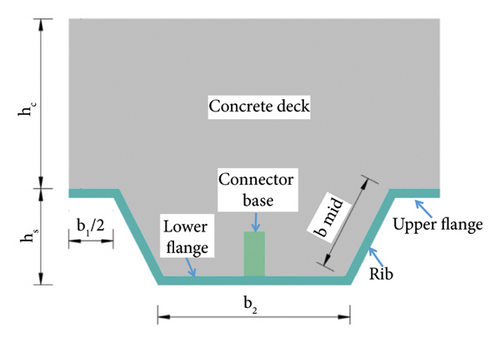
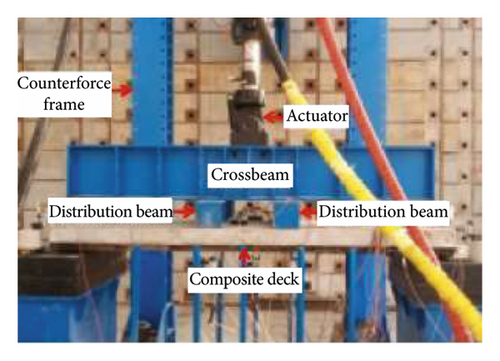
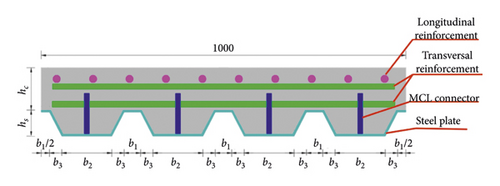
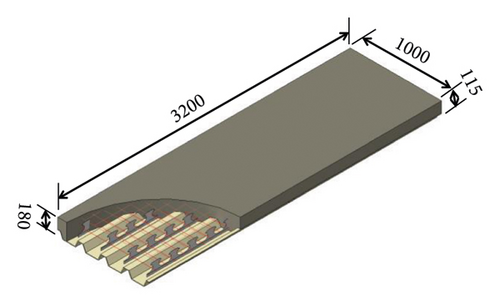
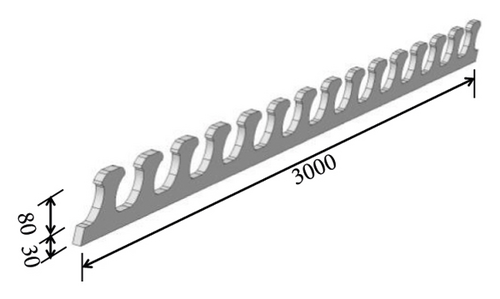
The constant amplitude fatigue test has been conducted on three profiled steel-concrete composite decks to investigate their fatigue performance, as shown in Figure 6. The specimens are designated as SP-1, SP-2, and SP-3. The composite deck measures 3200 mm in length, 1000 mm in width, and 180 mm in height. The upper flange depth of the concrete slab is 115 mm. The steel plate measures 65 mm in height, with a 6 mm thickness. The shape of the cross section is shown in Figure 7. Table 1 lists the dimensions of the cross section of the composite deck. The MCL connector measures 3000 mm in length and 110 mm in height. It consists of steel dowels and a connector base. The connector base is 30 mm in height. The connectors are welded to the steel plate. Figure 8 displays the details of the composite deck. The spacing between the two steel dowels is 200 mm, as shown in Figure 9. Bottom bars with a diameter of 16 mm are symmetrically arranged on both sides of the steel dowels. The net distance between the bottom bar and the steel dowel is 22 mm.
| Specimen no. | b 1 | b 2 | b 3 | h s | h c |
|---|---|---|---|---|---|
| SP-1 | 30 | 130 | 30 | 65 | 115 |
| SP-2 | 30 | 130 | 30 | 65 | 115 |
| SP-3 | 30 | 130 | 30 | 65 | 115 |
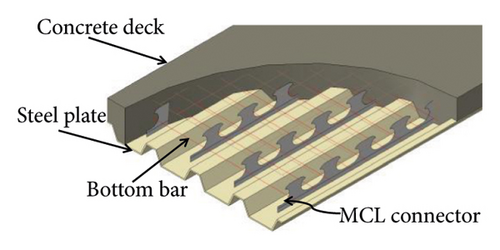
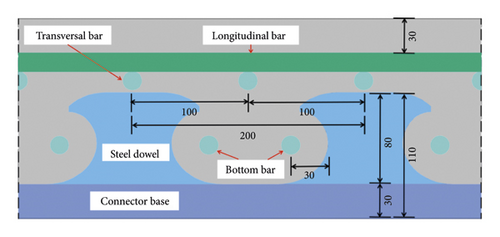
The steel bar net of 16 mm diameter was arranged at a distance of 30 mm from the top of the concrete slab. The length of the longitudinal bar is 3000 mm, while for the transversal bar, it is 900 mm. The spacing between the bars is 100 mm. Table 2 displays the material properties of the composite deck.
| Specimen | Corrugated steel plate | MCL connectors | Concrete slab | |||||
|---|---|---|---|---|---|---|---|---|
| f y | Average value | f u | Average value | f y | f u | f cu | Average value | |
| SP-1 | 415.6 | 416.5 | 568.8 | 569.2 | 438.6 | 584.3 | 62.8 | 61.2 |
| SP-2 | 416.5 | 569.2 | 438.6 | 584.3 | 61.5 | |||
| SP-3 | 414.9 | 569.5 | 438.6 | 584.3 | 59.35 | |||
3.2. Finite Element Analysis
To investigate the mechanical behavior of the composite deck with cracks under static load, the finite element method (FEM) was used for the analysis. Moreover, the results of the FEM were compared with the experimental ones to validate its accuracy.
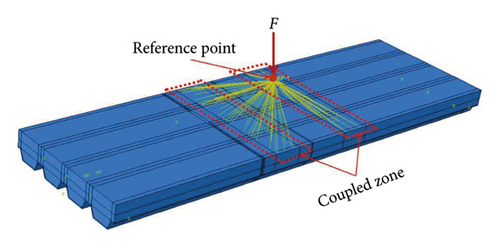
One reference point (RP) was established to simulate the actual loading process in the static test. The distance between the point and the top surface of the concrete slab was 200 mm. The RP was coupled with the loading surface of the concrete slab in the model, as shown in Figure 10.
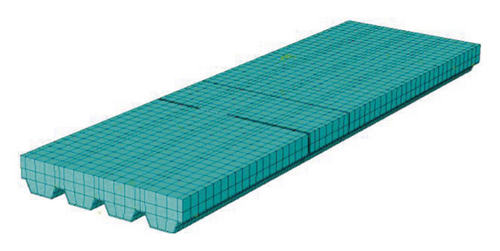
The solid elements were used for the simulation of the concrete slab, the steel plate, and the MCL connectors. The truss element was employed to simulate the bar net and the bottom bars. To conduct the mesh sensitivity analysis, the mesh size for the concrete slab was taken to be 60 mm, 50 mm, and 40 mm. The residual carrying capacities corresponding to different mesh sizes were 327.1 kN, 317.9 kN, and 319.3 kN, respectively. Considering the computation efficiency, the mesh size of 50 mm was used for the concrete slab simulation. The steel plate and MCL connectors were meshed with the element sizes of 30 mm and 10 mm, respectively, as shown in Figure 11(d). In the FE model, the regions where cracks appeared were cut out from the model.
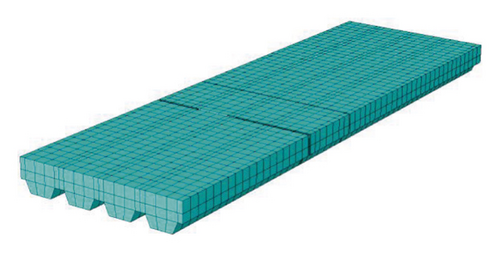
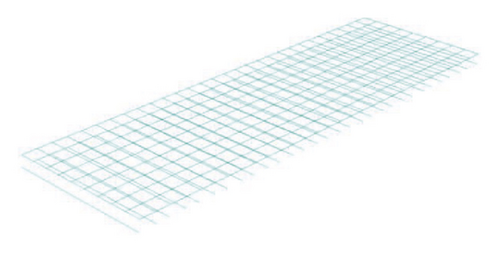
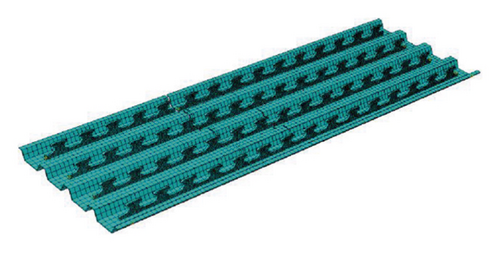
The constraint “embedded” was used to simulate the interaction between the steel bars and concrete slab, and the constraint “tie” was employed to simulate the interaction between the MCL connectors and the steel plate. The hard contact was adopted to simulate the interaction between the concrete slab and the steel plate in the normal direction, while the penalty property with a friction coefficient of 0.4 was used to simulate the interaction in the tangential direction [14–16].
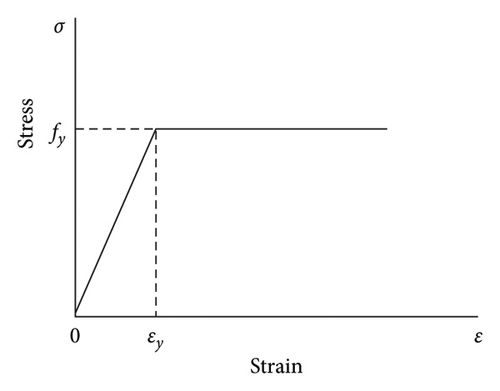
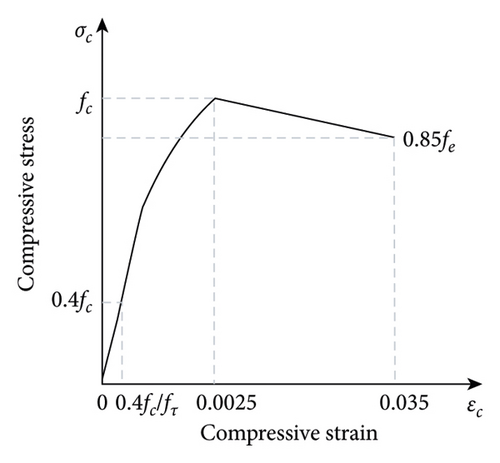
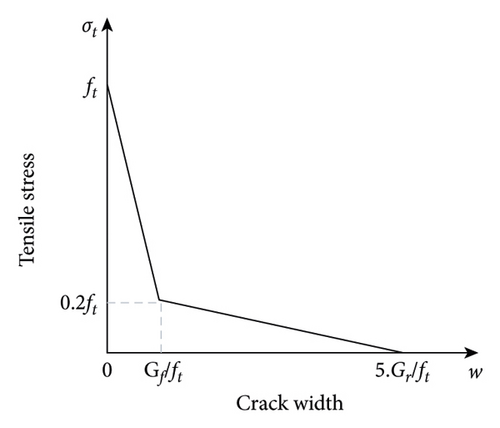
The ideal elastic-plastic constitutive relationship was employed for the steel components, as shown in Figure 12. The concrete damage plasticity model (CDP) according to the Mode Code 2010 was adopted to analyze the mechanical behavior of the concrete slab [17], as displayed in Figure 13. The compression strength fc of the concrete slab at the n-th load cycle could be calculated through equation (1). Equation (2) was employed to calculate the tension strength of the steel plate at the n-th load cycle. The stress-strain relationship for concrete in compression could be divided into three stages. In the first stage, the stress increased linearly from 0 to 0.4 fc. In the second stage, the stress-strain relationship curve was nonlinear with the stress ranging from 0.4 fc to fc. In the third stage, the stress descended linearly as the strain increased. For the concrete in tension, the stress-strain relationship could be defined using fracture energy.
3.3. Finite Element Result
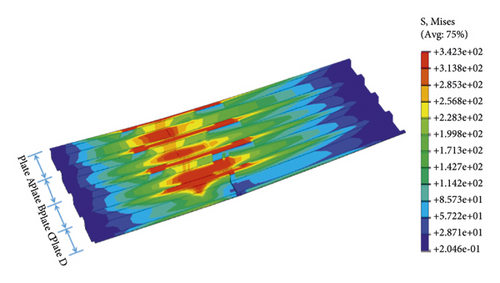
To describe the stress distribution in the steel plate, the steel plate was divided into four parts: Plate A, Plate B, Plate C, and Plate D, as shown in Figure 14. For the Specimen SP-1 under ultimate load, if the crack length was less than the width of the lower flange of the steel plate, the stress near the crack in Plates A and B could still reach the yield strength. For Plate D, the stress near the crack decreased significantly due to the reason that the crack penetrated through the lower flange of the steel plate, as shown in Figure 15(a).

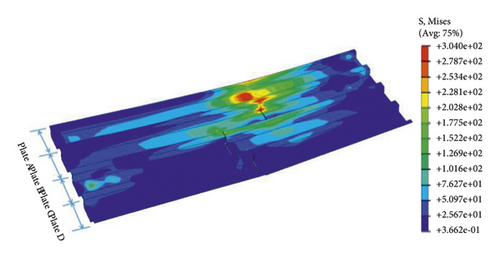
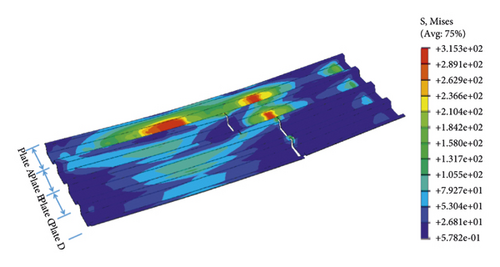
As illustrated in Figure 15(c), Plates B, C, and D were split into two parts by the cracks, respectively. Additionally, Plate A was uncracked. The maximum stress in Plate B reached the yield strength since it was adjacent to Plate A. Compared with the stress in Plate B, the stress in Plate C decreased significantly, and the stress in Plate D was negligible. Observing the stress distribution in the steel plate, it revealed that the stress in the steel plate was redistributed due to the existence of the cracks. The tensile stress was mainly borne by Plate A, Plate B, and Plate C.
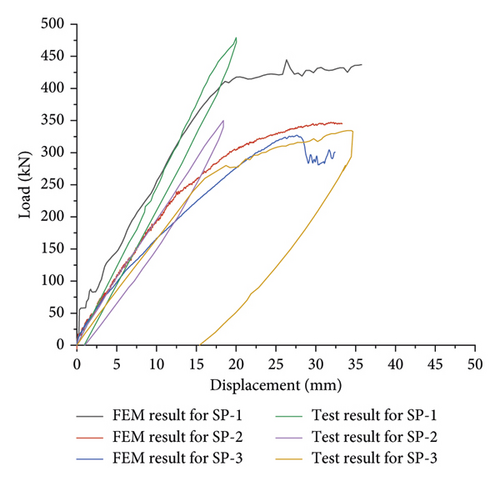
Figure 16 shows the load-displacement curves of the FE model and experiment. The residual bearing capacity obtained from the FE model was close to the test results. However, for specimens SP-1 and SP-2, the maximum displacements obtained from FE models were different from the test results. The reason was that the static test was stopped when the stress in the midspan of the steel plate reached the yield strength.
3.4. Verification of the Theoretical Method
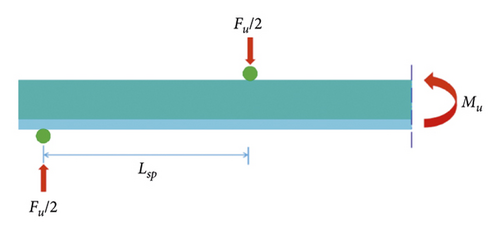
The ultimate vertical loads of the composite deck obtained from the theoretical method and FE model were compared with the test results, as displayed in Table 3. The maximum error between the test results and the theoretical calculation was 4%. It indicated that the theoretical method was reliable. Additionally, the maximum error between the test results and the FE model was 9%, which showed that the FE model was acceptable.
| Specimen | F u, test (kN) | F u, theory (kN) | F u, FEA (kN) | F u, theory/Fu, test | F u, FEA/Fu, test |
|---|---|---|---|---|---|
| SP-1 | 479.2 | 499.1 | 436.2 | 1.04 | 0.91 |
| SP-2 | 330 | 319 | 345.9 | 0.97 | 1.05 |
| SP-3 | 334.5 | 327.7 | 317.9 | 0.98 | 0.95 |
4. Parametric Analysis for Residual Carrying Capacity
To investigate the effects of the shear span length Lsp, the MCL connector spacing Lmc, and the upper flange depth of the concrete slab hc on the mechanical behavior of the composite deck, the parametric analysis was performed. The analysis of these parameters is helpful for the fatigue design of the composite decks.
4.1. Influence of the Shear Span Length
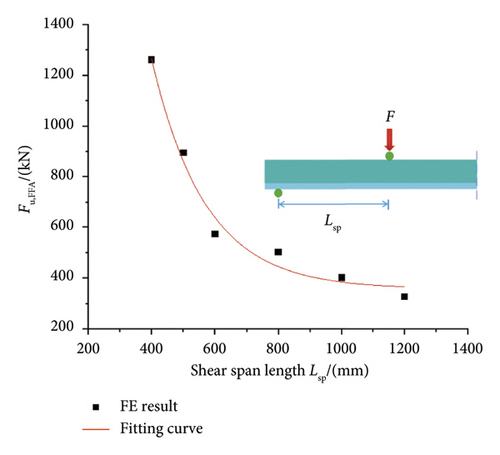
The shear span length Lsp was set to be 400 mm, 500 mm, 600 mm, 800 mm, 1000 mm, and 12000 mm. Figure 18 shows the relationship between the shear span length Lsp and the residual carrying capacity Fu, FE obtained from the FE model. When Lsp increased from 400 mm to 800 mm (by 100%), Fu, FE decreased from 1260.8 kN to 572.3 kN (by 54.6%). When Lsp increased from 800 mm to 1200 mm (by 50%), Fu, FE decreased from 572.3 kN to 327 kN (by 42.9%). As the shear span length Lsp increased, the residual carrying capacity Fu, FE decreased rapidly in the initial stage and then tended to be stable. The relationship between Lsp and Fu, FE was exponential.
4.2. Influence of the MCL Connector Spacing
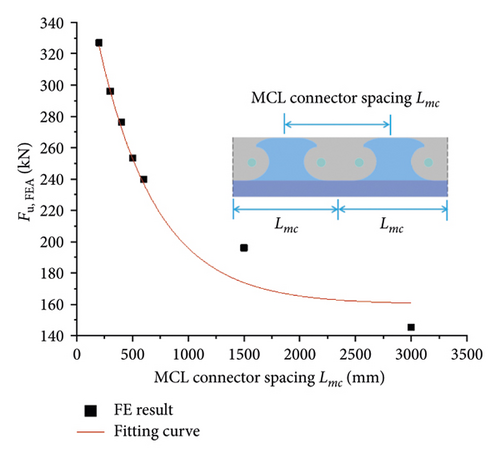
Figure 19 shows the influence of the MCL connector spacing Lmc on the residual carrying capacity of the composite deck. The spacing Lmc was taken as 200 mm, 300 mm, 400 mm, 500 mm, 600 mm, 1500 mm, and 3000 mm. The residual carrying capacity Fu, FEA decreased by 9.4% when Lmc increased from 200 mm to 300 mm (by 50%). When Lmc increased from 300 mm to 400 mm, Fu, FEA decreased from 296.1 kN to 276.2 kN (by 6.7%). When Lmc increased from 500 mm to 600 mm, Fu, FEA decreased from 253.4 kN to 239.7 kN (by 5.4%). With the increase of Lmc, Fu, FEA descended rapidly in the initial stage and then tended to be stable. The longitudinal shear resistance of the composite deck went down because of the decrease in the number of MCL connectors, which led to the decline of the residual carrying capacity of the composite decks.
4.3. Influence of the Upper Flange Depth of the Concrete Slab
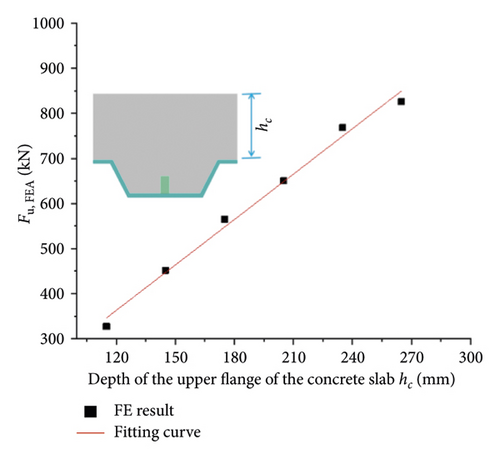
Figure 20 shows the relationship between the upper flange depth of the concrete slab hc and the residual carrying capacity of the composite deck. The depth hc was set to be 115 mm, 145 mm, 175 mm, 205 mm, 235 mm, and 265 mm. When hc increased from 115 mm to 145 mm, Fu, FEA went up from 327 kN to 451.8 kN (by 38.2%). When hc increased from 145 mm to 175 mm, Fu, FEA went up from 451.8 kN to 565.6 kN (by 25.2%). When hc increased from 205 mm to 235 mm, Fu, FEA went up from 650 kN to 768 kN (by 18.2%). When hc increased from 235 mm to 265 mm, Fu, FEA went up from 768 kN to 826 kN (by 7.6%). The relationship between the hc and Fu, FEA was linear, as shown in Figure 20. It indicated that the residual bearing capacity of the composite deck could be improved by increasing hc appropriately. The increase in the depth of the concrete slab enhanced the inertial moment of the cross section of the composite deck, which improved the flexural performance of the composite deck.
5. Conclusions
- (1)
The maximum error between the theoretical result and the test result was 4%. It indicates that the theoretical method based on the material strength deterioration theory is reliable.
- (2)
The stress redistribution in the steel plate occurred due to the existence of cracks. If the length of the crack was less than the width of the lower flange of the steel plate, the stress in the lower flange of the steel plate could still reach the yield strength.
- (3)
The maximum error between the test result and the finite element model was 9%. It reveals that the simulation result of the finite element model is acceptable.
- (4)
In the parametric analysis, as Lsp and Lmc increased, the residual capacity decreased exponentially. Moreover, the relationship between hc and the residual carrying capacity was linear. This study is beneficial for the fatigue design of the composite deck.
Conflicts of Interest
The authors declare that they have no conflicts of interest.
Open Research
Data Availability
All data generated or analyzed during this study are included in this published article.


