Prediction of Linalool Content in Osmanthus fragrans Using E-Nose Technology
Abstract
Linalool is a well-known volatile compound. It is usually extracted from plants or synthesized by chemical methods. However, there is still no rapid screening method for plants with high linalool content. Therefore, we aimed to establish a method determining linalool content in Osmanthus fragrans by electronic nose (E-nose). The volatile gases of three cultivars of O. fragrans were characterized by gas chromatography-mass spectrometry (GC-MS) and E-nose. Different concentrations of linalool were measured by E-nose. Then, the E-nose data were subjected to principal component analysis (PCA) and linear discriminant analysis (LDA) to establish a discriminant model for determining linalool concentrations. Prediction models based on principal component regression (PCR) and multiple linear regression (MLR) were developed from all sensors and feature sensors to determine linalool concentrations in the three cultivars of O. fragrans flowers. Finally, the linalool concentrations determined by gas chromatography were used to verify the accuracy of the prediction model. The results show that linalool had the highest abundance among the volatile compounds of O. fragrans, and the MLR prediction model had an R2 of 0.992 in calibration sets and an R2 of 0.895 in prediction sets using 10 sensors. This study describes a rapid and accurate method for the detection and quantification of linalool concentrations.
1. Introduction
Plant floral fragrance is an important trait of garden plants. It is an important expression signal for plants to attract insects to pollinate, and it is an important quality indicator for evaluating ornamental plants and fresh cut flowers [1, 2]. According to the biosynthetic pathway of floral volatiles, the compounds that make up floral fragrance can be divided into three categories: terpenes, phenylpropionic acid/benzene compounds, and aliphatic compounds [3]. The commonly used extraction and separation methods for volatile compounds in plants include extraction chromatography, distillation chromatography, and headspace chromatography. These methods have been applied to the identification and analysis of volatile compounds in Malus spectabilis [4], Chimonanthus praecox [5], Cymbidium ssp. [6], Rosa rugosa [7], Jasminum sambac [8], and other aromatic plants. Chromatography has the advantages of highly accurate qualitative and quantitative analyses of floral components; however, it has limitations, such as high instrument maintenance and operation costs, and long sample pretreatment and analysis time. The development of new methods to analyze volatile compounds is still needed. Therefore, it is of great practical significance to develop a rapid and economical detection method to determine the content of volatile compounds in plants.
In recent years, testing technologies, such as the electric nose, have received increasingly more attention. The E-nose is an olfactory simulation test tool. Typically consisting of a series of nonspecific, cross-reactive chemical sensors that are used in conjunction with machine learning methods, these sensors can detect combinations of volatile compounds in complex samples when exposed to different sample gases [9]. Moreover, the sample preparation does not require organic solvents, the measurement time is short, and it can be measured in the field. Currently, E-noses are mainly used for quality control of animal and plant products in the food industry [10] or to determine the shelf life of fruits, vegetables [11], aquatic products [12], and meat products [13]. It is used for tobacco [14] and beverage [15] authenticity identification, as well as to differentiate fruit maturity [16]. There has also been development in research on specific E-nose and related statistical analysis methods using MAU-9 E-nose MOS-type sensor arrays in combination with artificial neural network analysis methods for more accurate discrimination of fruit essential oils [17]. To improve the detection limit of E-nose, miniaturized preconcentrators packed with hydrophobic adsorbent have been incorporated into bio-based opto-electronic noses (NeOse Pro) to enhance the statistical discrimination capacity of odor patterns [18]. For the detection of floral fragrances, the E-nose has been used for germplasm identification, differentiation of different flowering periods, and identification of volatile compounds in different floral organs. However, there are no reports on the application of E-nose for the prediction of volatile component content of flowers. There are also no specific sensor products available on the market for plant floral screening. Accordingly, to apply devices such as E-nose more widely in practice, the functionality of E-nose can be improved not only by using more advanced techniques to analyze large data but also by obtaining more data to describe the scent profile during a single measurement of volatile compounds [19–21]. Here, we aimed to explore the use of the E-nose method for rapid determination of floral components and to obtain aroma description data and associations between E-nose sensors and plant volatile compounds. The exploration of this technique has a significant reference value for the fragrant flower breeding, floral fragrance evaluation, and fragrance industry.
Linalool (3,7-dimethyl-1,6-octadien-3-ol, C10H18O) is a tertiary alcohol and a monoterpenoid. Linalool is one of the main floral volatile compounds of plants, such as O. fragrans [22], Freesia hybrida [23], Jasminum sambac [24], and Hosta plantaginea [25]. It has a flowery-fresh aroma that is reminiscent of lily of the valley [26]. It is an important essential oil widely used in the fragrance industry for perfumes and daily chemical products [27]. Linalool ranks first among the most commonly used fragrances every year around the world. It also has antibacterial, antiviral, sedative, and insecticidal effects [28–32]. The current methods of linalool preparation are extracted from plants or chemically synthesized [33]. If a rapid screening method for plants with high linalool content is established, the development and application of linalool in flowers would be promoted. Therefore, in this study, SPME-GC-MS technology and E-nose were used to study the aroma profiles of three O. fragrans samples and different concentrations of linalool standard solutions. Then, based on principal component analysis (PCA) and linear discriminant analysis (LDA), a discriminant model of linalool concentration was established. Finally, an accurate linalool concentration prediction model for 10 sensors was established using principal component regression (PCR) and multiple linear regression (MLR). The relationship between the E-nose sensors and the volatile compounds in O. fragrans was initially explored. The important functions of E-nose in floral detection and the floral fragrance quality were evaluated. The aim of this study was to establish a rapid and cost-effective assay to determine the content of linalool in plants and a system for rapid screening of plant flowers with high linalool content.
2. Materials and Methods
2.1. Plant Material
In October 2020, healthy and consistently growing O. fragrans ‘Thunbergii,’ O. fragrans ‘Boye Jingui,’ and O. fragrans ‘Xiaoye Dangui’ were selected from the campus of Nanjing Forestry University. The fully bloomed flowers of three cultivars were collected between 7:00 and 9:00 AM on a sunny day in October. After collection, the flowers of each cultivar were fully mixed, put in a polyethylene sealed bag, and immediately transported to the laboratory for testing.
2.2. Reagent and Standard Solution Preparation
Analytically pure normal alkane standard C8–C20, methyl laurate, methanol, ethanol, and a linalool reference standard were purchased from Aladdin. Ten microliters of linalool standard substance (chromatographically pure, density of 0.861 g/mL) were diluted with ultrapure water to 10 mL to obtain the diluted standard solution (861 mg/L). The diluted standard solution (0.01, 0.02, 0.05, 0.08, 0.1, 0.2, 0.4, 0.6, and 1 mL) was dissolved in ultrapure water and diluted to 10 mL to generate 0.86, 1.72, 4.31, 6.89, 8.61, 17.22, 34.44, 51.66, and 86.10 mg/L standard injection solutions, respectively, for subsequent determination.
2.3. GC-MS Analysis
A solid-phase microextraction apparatus (Supelco, Bellefonte, PA, USA) equipped with a 65 μm PDMS-DVB (divinylbenzene) extraction head was selected for the collection and adsorption of volatile compounds. When the extraction head was used for the first time, the fiber was activated in the gas chromatograph injection port at a high temperature of 270°C for 0.5 h. The fiber was activated for 3 min before each extraction. For each sample treatment, 0.3 g of flowers was placed in a 20-mL headspace bottle, and 2.5 μL of methyl laurate (0.87 mg/mL methanol) was added as an internal standard. The volatile compounds were extracted after shaking. The extraction depth was about 2.5–3.0 cm. The sample was heated in a 45 °C water bath and extracted via headspace extraction for 35 min. The SPME fiber was immediately inserted into the gas chromatograph injection port for analysis, and three replicates of each sample were analyzed.
GC-MS Trace DSQ (Thermo Fisher Scientific, Waltham, MA, USA) equipped with a DB-5MS fused silica capillary column (30 m × 0.25mm i.d.; 0.25μm film thickness; 5% phenylmethyl siloxane; Agilent Technologies, Santa Clara, CA, USA) was used for compound identification. Following volatile compounds extraction by SPME, the fiber was inserted into the GC injector port in splitless mode for desorption at 250 °C for 5 min. Helium was used as the carrier gas at a flow rate of 1.0 mL/min. The temperatures of the transfer line and ion source were 250 °C and 210 °C, respectively. The temperature program of the column oven was as follows: 50 °C for 1 min, increased to 100°C at 10 °C/min, increased to 160 °C at 5°C/min, increased to 250 °C at 8°C/min, and maintained for 3 min. The electron ionization potential of the mass detector was 70 eV, and the scan range was from 33 to 450 amu.
2.4. E-Nose Analysis
Three O. fragrans flower samples were measured using a PEN3 portable E-nose. This system is a product of WinMuster Airsense (WMA) Analytics Inc. (Schwerin, Germany). According to the volatile compounds emitted by O. fragrans in full bloom [34], the suitability of the PEN3 sensors for the detection and identification of plant floral fragrances [4], 10 metal oxide sensors that are sensitive to many terpenoids, sulfur organic compounds, and other volatile compounds were selected and are shown in Table 1.These sensors have good repeatability and stability [35]. The E-nose sensor has a resistivity of G0 for standard activated carbon filtering gas, and the maximum resistivity after adsorbing sample gas is Gi. Gi/G0 is the response value and constitutes the E-nose data unit. The E-nose is capable of automatic adjustment/automatic calibration and system automatic enrichment to effectively eliminate baseline drift.
| Sensor no. | Sensor name | Sensitive components | Reference, mL·m−3(ppm) |
|---|---|---|---|
| 1 | W1C | Aromatic compounds | Toluene, 10 |
| 2 | W5C | Broad-range sensitivity, reacts with nitrogen oxides, very sensitive with negative signal | NO2, 1 |
| 3 | W3C | Ammonia, used as a sensor for aromatic compounds | Benzene, 10 |
| 4 | W6S | Mainly hydrogen, selectively (breath gases) | H2, 100 |
| 5 | W5S | Alkenes, aromatic compounds, less polar compounds | Propane, 1 |
| 6 | W1S | Sensitive to methane, broad range similar to no.8 | CH4, 100 |
| 7 | W1W | Reacts with sulfur compounds, sensitive to many terpenes and sulfur organic compounds, which are important for smell, limonene, and pyridine | H2S, 1 |
| 8 | W2S | Detects alcohols, partially aromatic compounds, broad range | CO, 100 |
| 9 | W2W | Aromatic compounds, sulfur organic compounds | H2S, 1 |
| 10 | W3S | Reacts at high concentrations, sometime very selective (methane) | CH4, 10 |
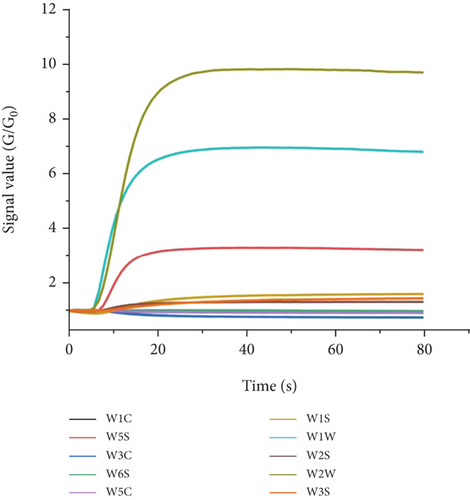
Three grams of fresh flower samples were transferred to a 250-mL headspace bottle. After equilibrating at 25 °C and room temperature for 30 min, the E-nose automatically sampled the headspace and used activated carbon to filter. The clean and dry air was used as the carrier gas. The number of sample replicates was three. The parameter settings of the E-nose instrument were as follows: sample interval of 1 s, sample preparation time of 5 s, sampling time of 80 s, auto zero time of 10 s, cleaning time of 100 s, internal flow rate of 20 mL/min, and sample flow rate of 20 mL/min. For each measurement, the 10 sensors of the E-nose generated 10 dynamic curve data points. After the curve reached a plateau (Figure 1), the response value at the 70th second was used for subsequent analysis.
The concentration of the standard injection solution was sampled and determined sequentially from low to high. Three milliliters of the standard injection solution were drawn into a 250-mL headspace bottle, and after equilibrating at 25°C for 30 min at room temperature, the E-nose automatically sampled the headspace for detection. The number of sample replicates was three. Other measurement conditions were the same as above. The 68–70 s response value, after the curve reached a plateau, was used for subsequent model construction.
2.5. Statistical Analysis
For the E-nose data, PCA and LDA were performed on the data points obtained at 70 s using Unscrambler X 10.4 (CAMO, Oslo, Norway), Origin 2019b (OriginLab, MA, USA), and SYSTAT 13 (Systat Software Inc., CA, USA). The response values of the E-nose at 68–70 s were selected with three replicates for each concentration, for a total of 81 sets (81 × 10) of experimental data. Unscrambler X 10.4 (CAMO, Oslo, Norway) software was used to model these data, and the data used in the PCA, LDA, and the model building process were standardized. The prediction correlation coefficient (R2) and the prediction root mean square error (RMSEP) were used as the evaluation indicators of the model accuracy. Generally, a good model should have a high R2 value (close to 1) and a low RMSEP value (close to 0) to indicate good stability and strong predictive ability.
3. Results and Discussion
3.1. Analysis of Volatile Compounds in O. fragrans
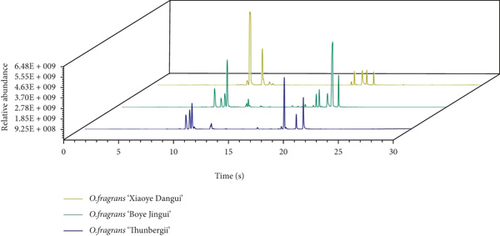
Headspace GC-MS was used to study the scent profiles of the three O. fragrans samples and verify the results of the E-nose experiment. The total ion chromatograms of the three O. fragrans volatile compounds are shown in Figure 2. A total of 43 volatile compounds were detected (Table 2). There were 32 compounds in O. fragrans ‘Boye Jingui,’ 30 compounds in O. fragrans ‘Xiaoye Dangui,’ and 24 compounds in O. fragrans ‘Thunbergii.’ Twenty-one types of terpenes, 15 types of fatty acids and their derivatives, 3 types of alcohols, 3 types of alkanes, and 1 aldehyde were identified. á-Ocimene had the highest abundance in O. fragrans ‘Xiaoye Dangui’ (33.91 μg/g FW), accounting for 49.16% of all volatile compounds, followed by linalool and its oxides (11.76 μg/g FW). O. fragrans ‘Boye Jingui’ had the highest content of β-ionone (33.91 μg/g FW), accounting for 35.88% of all volatile components, followed by linalool and its oxide (24.04 μg/g FW). Linalool and its oxide (26.23 μg/g FW) had the highest content in O. fragrans ‘Thunbergii,’ followed by 2-butanone, 4-(2,6,6-trimethyl-1-cyclohexen-1-yl) (17.69 μg/g FW).
| Compound | CAS | Relative to the content of internal standard (μg/g) | ||
|---|---|---|---|---|
| A | B | C | ||
| Terpenes | ||||
| 2,6-Dimethyl-1,3,5,7-octatetraene, E,E- | 460-01-5 | 0.22 ± 0.04 | — | — |
| 1,3,7-Octatriene,2,7-dimethyl- | 36638-38-7 | 0.03 ± 0.02 | — | — |
| Trans-á-Ocimene | 3779-61-1 | 1.40 ± 0.33a | 0.16 ± 0.03b | 0.03 ± 0.00b |
| á-Ocimene | 13877-91-3 | 33.91 ± 2.51a | 6.24 ± 0.98b | 0.24 ± 0.01c |
| Trans-Linalool oxide (furanoid) | 34995-77-2 | 0.06 ± 0.01c | 5.11 ± 0.72b | 8.34 ± 1.32a |
| Linalool | 78-70-6 | 11.58 ± 1.27ab | 14.24 ± 2.29a | 8.83 ± 0.80b |
| 2,4,6-Octatriene,2,6-dimethyl-,(E,Z)- | 7216-56-0 | 1.04 ± 0.11a | 0.15 ± 0.03b | — |
| 2,4,6-Octatriene, 2,6-dimethyl-, (E,E)- | 3016-19-1 | 0.42 ± 0.04a | 0.16 ± 0.04ab | — |
| (3R,6S)-2,2,6-Trimethyl-6-vinyltetrahydro-2H-pyran-3-ol | 39028-58-5 | 0.12 ± 0.01c | 1.40 ± 0.17b | 2.49 ± 0.01a |
| 3,7-Octadiene-2,6-diol,2,6-dimethyl- | 13741-21-4 | 0.02 ± 0.01 | — | — |
| 2,6-Octadien-1-ol,3,7-dimethyl-,(Z)- | 106-25-2 | — | 0.05 ± 0.04 | — |
| 2H-Pyran-3-ol,6-ethenyltetrahydro-2,2,6-trimethyl- | 56752-50-2 | — | — | 0.02 ± 0.00 |
| 3-Buten-2-one,4-(2,6,6-trimethyl-1-cyclohexen-1-yl)- | 14901-07-6 | 0.03 ± 0.00b | 0.47 ± 0.05a | 0.30 ± 0.23ab |
| Megastigma-4,6(E),8(E)-triene | 51468-86-1 | 0.02 ± 0.00b | 0.38 ± 0.03a | 0.04 ± 0.00b |
| 2-Butanone, 4-(2,6,6-trimethyl-2-cyclohexen-1-ylidene)- | 56052-61-0 | 0.04 ± 0.01b | 0.85 ± 0.14a | 0.08 ± 0.02b |
| 2-Butanone,4-(2,6,6-trimethyl-2-cyclohexen-1-yl)- | 31499-72-6 | — | — | 0.15 ± 0.01 |
| à-Ionone | 127-41-3 | 1.03 ± 0.15b | 3.75 ± 0.44a | 0.87 ± 0.15b |
| 2-Butanone,4-(2,6,6-trimethyl-1-cyclohexen-1-yl)- | 17283-81-7 | 4.00 ± 0.74b | 5.52 ± 1.11b | 17.69 ± 2.06a |
| 1-Cyclohexene-1-propanol,à,2,6,6-tetramethyl- | 3293-47-8 | 0.23 ± 0.03b | 0.35 ± 0.07a | 0.27 ± 0.02ab |
| β-Ionone | 79-77-6 | 3.79 ± 0.42b | 32.28 ± 2.30a | 4.24 ± 1.01b |
| à-Farnesene | 502-61-4 | — | — | 0.03 ± 0.01 |
| Esters | ||||
| Butanoic acid, methyl ester | 623-42-7 | 0.01 ± 0.00ab | 0.05 ± 0.01a | — |
| Methyl isovalerate | 556-24-1 | 0.01 ± 0.01 | — | — |
| Methyl tiglate | 6622-76-0 | 0.05 ± 0.01 | — | — |
| Butanoic acid, 2-methylene-,methyl ester | 2177-67-5 | — | 0.05 ± 0.01a | 0.02 ± 0.01ab |
| Hexanoic acid, methyl ester | 106-70-7 | 0.01 ± 0.01 | 0.03 ± 0.00 | — |
| Octanoic acid, methyl ester | 111-11-5 | 0.04 ± 0.00ab | 0.09 ± 0.02a | — |
| Butanoic acid, 3-hexenyl ester,(E)- | 53398-84-8 | 0.03 ± 0.00b | 0.94 ± 0.08a | 0.06 ± 0.02b |
| Butanoic acid, hexyl ester | 2639-63-6 | — | 0.20 ± 0.17 | — |
| Cis-3-Hexenyl-à-methylbutyrate | 53398-85-9 | — | 0.16 ± 0.10a | 0.05 ± 0.03b |
| Cis-3-Hexenyl isovalerate | 35154-45-1 | — | 0.20 ± 0.11a | 0.07 ± 0.04b |
| n-Propyl benzoate | 2315-68-6 | — | 0.03 ± 0.00 | — |
| Hexanoic acid, 3-hexenyl ester,(Z)- | 31501-11-8 | — | 0.07 ± 0.06 | — |
| 2(3H)-Furanone, 5-hexyldihydro- | 706-14-9 | 4.43 ± 0.33a | 4.66 ± 0.54a | — |
| γ-Dodecalactone | 2305-05-7 | — | — | 0.01 ± 0.00 |
| 2,2,4-Trimethyl-1, 3-pentanediol diisobutyrate | 6846-50-0 | 0.03 ± 0.01b | 0.04 ± 0.01ab | 0.06 ± 0.02a |
| Alcohols | ||||
| 2-Furanmethanol,5-ethenyltetrahydro-à,à,5-trimethyl-,cis- | 5989-33-3 | — | 3.29 ± 0.59b | 6.57 ± 1.19a |
| 2H-Pyran-3(4H)-one, 6-ethenyldihydro-2,2,6-trimethyl- | 33933-72-1 | — | 0.16 ± 0.04ab | 0.73 ± 0.15a |
| 3-Buten-2-ol,4-(2,6,6-trimethyl-2-cyclohexen-1-yl)-,(3E)- | 25312-34-9 | 0.02 ± 0.00b | 0.10 ± 0.02a | 0.02 ± 0.01b |
| Alkanes | ||||
| Dodecane | 112-40-3 | — | — | 0.01 ± 0.00 |
| Hexadecane | 544-76-3 | 0.01 ± 0.00a | 0.01 ± 0.01a | — |
| Heptadecane | 629-78-7 | 0.01 ± 0.00a | 0.01 ± 0.00a | 0.01 ± 0.00a |
| Aldehyde | ||||
| Heptanal | 111-71-7 | 0.04 ± 0.00 | — | — |
- A: O. fragrans ‘Xiaoye Dangui’; B: O. fragrans ‘Boye Jingui’; C: O. fragrans ‘Thunbergii’.
The main volatile compounds of the three varieties were significantly different, but linalool and its oxides were found in all three varieties. The proportion of the content ranged from 17.02% to 41.36%.
3.2. Analysis of O. fragrans and Linalool by E-Nose
3.2.1. PCA and LDA Analyses
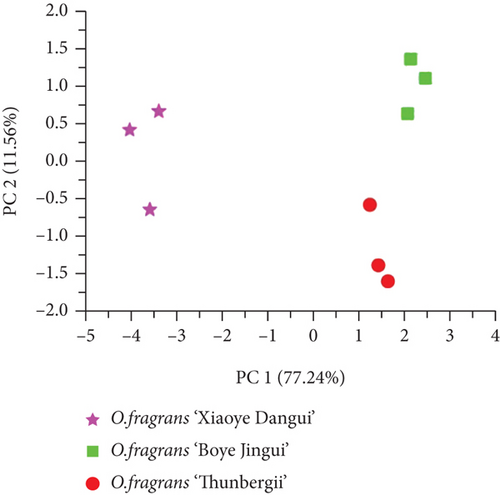
To determine the effectiveness of E-nose in distinguishing different cultivars of O. fragrans, PCA was used to assess the differences in E-nose data from different cultivars of O. fragrans (Figure 3(a)), which could reduce the complexity of the data and describe the differences between samples. The contribution rate of the first principal component (PC1) was 77.24%, and the contribution rate of the second principal component (PC2) was 11.56%. The two principal components explained 88.80% of the total variance. All data sets were located in three nonoverlapping regions; the results show that different cultivars of O. fragrans could be clearly distinguished.
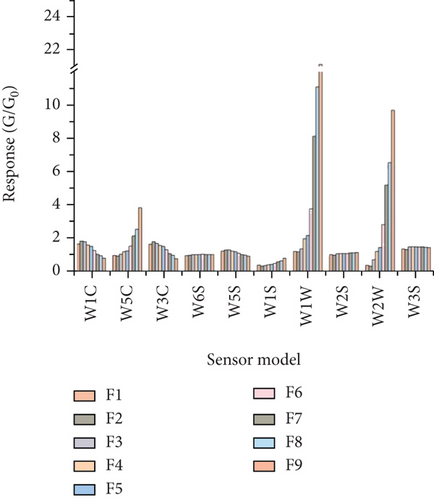

According to the response value of the E-nose to linalool standard solutions with different concentration gradients (F1–F9), different sensors have different responses to different concentrations of linalool. The response values of the 10 sensors were divided into three categories: negative correlation, positive correlation, and uncorrelated (Figure 3(b)). There was a significant negative correlation between the response values of W1C, W3C, and W5S sensors and the concentration of linalool. Conversely, the response values of W5C, W1S, W1W, and W2W sensors were significantly positively correlated with the concentration of linalool. The higher the concentration of linalool, the higher their response value. Among them, W5C, W1W, and W2W had the most dramatic response to linalool. There was no obvious relationship between W6S, W2S, and W3S sensor response values and the concentration of linalool. This result is reasonable because there is almost no corresponding sensitive gas in the standard solution. The E-nose is sensitive to different concentrations of linalool standard solutions, and the sensor response value changes significantly and regularly as the concentration of linalool increases.
Furthermore, PCA was performed on the response values of linalool standard solutions of different concentrations by E-nose sensors. The results show that the contribution rate of the first principal component (99.3%) was represented by the horizontal axis (PC1), and the contribution rate of the second principal component (0.68%) was represented by the vertical axis (PC2). The two-dimensional scatter plot is shown in Figure 3(c). The first two principal components accounted for 99.98% of the total variance, indicating that these two principal components can accurately represent the main information characteristics of the tested sample. The nine concentrations of linalool standard solutions are clearly separated, and the odor intensity decreases along the x-axis, indicating that the E-nose can distinguish linalool standard solutions with different concentrations.
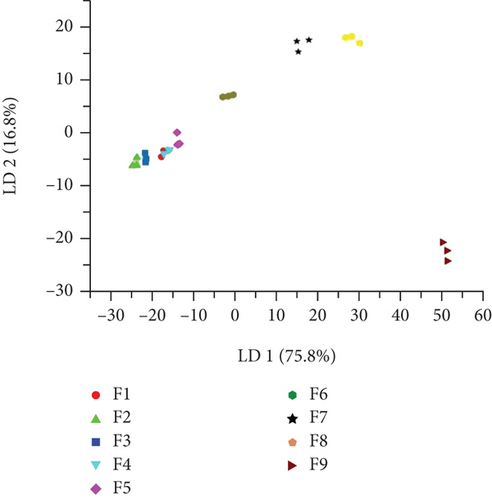
To further study the data of the E-nose, LDA was performed on the response value of the different concentrations of linalool standard solutions through the E-nose sensor (Figure 3(d)). A qualitative discriminant model was constructed to quickly discriminate different concentrations of linalool. LDA is a statistical method that can determine which group a sample belongs to by maximizing the variance between categories and minimizing the variance within categories [36]. From the figure, the contribution rates of discriminant LD1 and discriminant LD2 were 75.8% and 16.8%, respectively, and the total contribution rate was 92.6%, which is slightly lower than the principal component analysis (99.98%). From the LDA, different concentrations of linalool were clearly distinguished. Except for the lowest F1 concentration, the odor intensity increased along the x-axis in a positive direction. However, in LDA, the degree of dispersion between different concentrations of linalool was greater than that of PCA. Therefore, PCA and LDA can be effectively applied to distinguish different concentrations of linalool, but LDA was more effective in distinguishing linalool. The above results provide a reference for further identification.
3.2.2. Featured Sensor Screening
According to Figure 3(b), some sensors contributed little to the response of linalool, implying that optimization of the sensor array was needed to eliminate useless or abnormal sensors and improve the model accuracy. In this study, loading analysis (LA) was used to optimize the sensor array to obtain the characteristic sensors for the determination of linalool concentration.
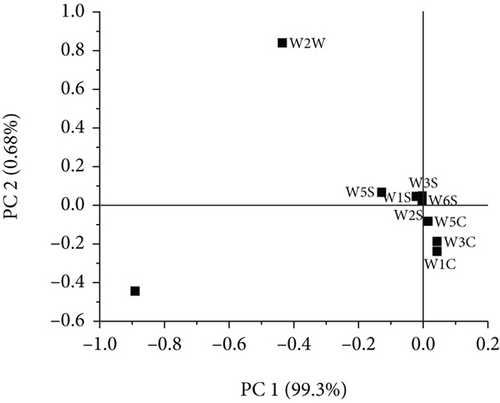
Figure 4 shows a load analysis plot of the sensor response values for different concentrations of linalool. LA was successful in further distinguishing the relative importance of each sensor in the current model. It can be seen from the figure that the W1W, W2W, and W5S sensors on PC1 have higher scores, and the W1W sensor has a contribution value greater than 0.8. Moreover, the W1C, W3C, W5C, W1W, and W2W sensors on PC2 have higher scores, and the W2W sensor has a contribution value greater than 0.8. However, the W3S, W1S, W6S, and W2S sensors have very little contribution to PC1 and PC2, which implies that they were ineffective in identifying the odor variation of different concentrations of linalool. In contrast, the higher contribution values of W1C, W3C, W5C, W1W, W2W, and W5S indicate a strong correlation between the sensors. Thus, they were selected as an optimized array of sensors.
3.2.3. Quantitative Models
A prediction model, based on the PCR and MLR for all sensors and feature sensors of the E-nose, was used to determine the concentration of linalool. Response values at 68–70 s from all sensors and the six feature sensors in the sensor array were extracted to analyze the steady-state signal of the linalool standard solution. In each concentration gradient test, three replicates were analyzed, generating nine concentration gradients totaling 81 sets of test data. These were used as the calibration set. The nine groups of data of the three cultivars of O. fragrans of the E-nose were used as the prediction set. The response values of all sensors and the six feature sensors to the standard solution of linalool were used as the independent variables, and the concentration of linalool was the dependent variable.
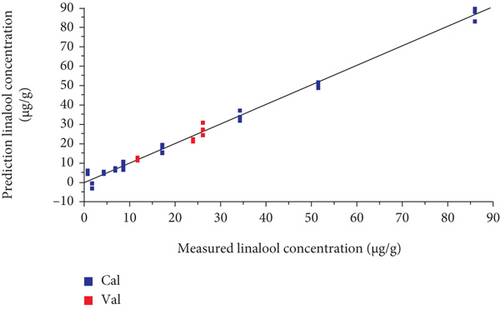
The model prediction results are shown in Table 3. The results show that the prediction of the model based on the MLR method was better than that of the PCR model. The MLR model based on all sensors had better predicted values than the six featured sensors PCR model. The R2_Pre of the model on all sensors was 0.895, and the RMSEP was 2.10 (Figure 5), indicating that the model is effective in predicting the concentration of linalool and fits well to the data. The results show that the volatile compound prediction model based on MLR for all E-nose sensors could effectively predict the linalool concentration. Therefore, the E-nose can be used to quickly and accurately predict the concentration of linalool in O. fragrans.
| Modeling method | Number of variables | R2_Calibration | Root mean square error (RMSE) | R2_Prediction | Root mean square error (RMSE) |
|---|---|---|---|---|---|
| PCR | 10 | 0.986 | 3.06 | 0.736 | 3.98 |
| 6 | 0.986 | 3.04 | 0.685 | 3.83 | |
| MLR | 10 | 0.992 | 2.48 | 0.895 | 2.10 |
| 6 | 0.990 | 2.72 | 0.875 | 3.39 |
To verify the prediction effect of the MLR model, data from 90 samples were grouped and trained by the K-fold cross-validation method, in which K = 9, and each subset of data were used as a prediction set separately. The remaining eight subsets of data were combined as a calibration set and brought into the MLR model for training. The average prediction result was taken as a measure of the prediction ability of the model. The prediction results by training the model are shown in Table 4. The calibration sets MAPE, RMSE, and MAE were 70%, 2.49, and 1.91, respectively; the prediction sets MAPE, RMSE, and MAE were 73%, 2.57, and 2.19, respectively, thus proving that the model was effective in predicting the linalool concentration.
| Modeling method | Calibration set | Prediction set | ||||
|---|---|---|---|---|---|---|
| MAPE/% | RMSE | MAE | MAPE/% | RMSE | MAE | |
| MLR | 70 | 2.49 | 1.91 | 73 | 2.57 | 2.19 |
4. Discussion
O. fragrans is an important fragrant flowering tree species. Most scholars have explored its floral composition, floral release pattern, and antibacterial and antiviral effects of the main components [34]. Related studies have shown that the main components of O. fragrans are trans-β-pyrone, linalool, trans-β-rolene, γ-decalactone, 4-(2,6,6-trimethylcyclohex-2-en-1-ylidene)butan-2-one, and leaf alcohol butyrate, which are consistent with the GC-MS results in the present study. However, the content of the main volatile compounds varies among species [34]. However, studies on the composition are rarely used to distinguish O. fragrans species and the differences in the floral fragrance. In this study, E-nose sensors were used to differentiate O. fragrans cultivars and to predict the main volatile compounds of O. fragrans.
PCA was used to successfully distinguish the scent profiles of different cultivars of O. fragrans. Compared with traditional sensory evaluation of volatile compounds, PCA is more stable and reproducible in addition to being more convenient and cost-effective compared to popular chromatographic techniques. The technique has been applied to distinguish and identify different bamboo shoot species [37], distinguish poplar varieties [38], detect green tea grades [39], and distinguish begonia taxa with different odor intensities [4]. This shows that the technique is feasible in the field of floral fragrance classification and identification.
Although the E-nose is not selective for a particular volatile compound in a complex sample, an E-nose consisting of several sensors with local specificity can construct a database of known odors by training a pattern recognition system with appropriate patterns. In this way, unknown odors can be classified and identified. Lin and Zhang [40], Jiang et al. [41], and Han et al. [42] successfully developed prediction models for alkaloids, such as nicotine in tobacco, fatty acid content in pecans, and eugenol concentration in curdlan (CD) biofilms, using different E-nose methods, all with predictive power exceeding 95%. These studies showed that single component content prediction using E-nose is feasible, providing a good reference for single component content detection in O. fragrans flowers using E-nose. In addition, Zeng et al. [43] showed that the accumulation of free monoterpenes in O. fragrans was proportional to their release. This study provided theoretical guidance for our method to predict the intrinsic content of O. fragrans based on its volatile components. Therefore, we screened the linalool based on the results of O. fragrans floral fragrance testing and the application value of the component. The innovative use of E-nose for component content prediction could be used for the screening of varieties with high concentrations of linalool and provide technical support for the industrial application of O. fragrans flower breeding.
The E-nose-based sensor arrays for volatile compound detection of O. fragrans and linalool standard solutions showed a clear linear correspondence in the response values of most of the sensors for high concentrations of volatile compounds. Sensors W1C, W3C, W5C, W1W, W2W, and W5S were selected as feature sensors for predicting aroma components of O. fragrans by loading factor analysis. However, the prediction model construction revealed that the prediction accuracy using the preferred sensors (R2_Pre =0.685 by PCR; R2_Pre =0.875 by MLR) was lower than using all 10 sensors of the instrument (R2_Pre =0.736 by PCR; R2_Pre =0.895 by MLR). This may be due to the fact that the number of E-nose sensors is smaller than the number of spectral wavelengths, which improves the speed of the prediction model based on all sensors. Therefore, the linalool concentration prediction model based on all sensors by MLR and PCR preserved the original information and improved the prediction accuracy, similar to the results reported in the literature [42].
To be more widely applied to breeding efforts for high linalool concentration in O. fragrans, the proposed linalool concentration prediction model can be considered for future online applications; that is, our final model (equation) will be embedded in a shared platform. This platform allows for data input and output. When the sensor data of the E-nose measured under the same conditions as in this study are given as input to the model, it outputs the final prediction results.
5. Conclusions
This work introduces a fast and accurate method for measuring the concentration of linalool in O. fragrans based on E-nose technology and GC-MS. The results show a correlation between the characteristics of the E-nose sensor and the different volatile compounds identified by GC-MS. Based on PCA and LDA, a discriminant model of O. fragrans and different concentrations of linalool was established. Finally, based on the relationship between the sensor, the linalool standard solution, and the volatile compounds, MLR was used to predict a linalool concentration based on an array consisting of 10 sensors, and the optimal concentration prediction model was established. Through the combination of E-nose and GC-MS with multivariate statistical analysis, the relationship between the concentrations of the main volatile compounds of aromatic plants can be predicted. This is a novel method for evaluating the quality of floral fragrance. However, in this study, the sample size was small in constructing the prediction model of linalool content in O. fragrans. Accordingly, in future studies, the range of model prediction and prediction accuracy could be corrected by further supplementing relevant data and increasing the sample types and numbers.
Conflicts of Interest
The authors declare that there is no conflict of interest regarding the publication of this paper.
Acknowledgments
The authors acknowledge the financial support of the Jiangsu Province Agricultural Science and Technology Independent Innovation Funds project (CX (21) 3175) and the Research Project of Jiangxi Forestry Bureau (No.202121).
Open Research
Data Availability
All original data used to support the findings of this study are included within the article.


