Deformation Control Monitoring of Basement Excavation at Field Construction Site: A Case of Hydraulic Servo Steel Enhancement Geotechnology
Abstract
This study presents two field cases of deep excavation using the hydraulic servo geotechnology as an enhancement to the lateral support. The first excavation process was preceded with numerical simulation to investigate the deformation of excavation pit with and without servo geotechnology. Optimised axial loading capacities from the numerical simulation were adopted at the actual excavation site. On the second excavation site, servo geotechnology was applied directly on the excavation process during actual construction without prior numerical simulation. The results showed that the servo steel support geotechnology restrained above 70% of lateral displacements of the excavated walls, and ground surface influence zone settlements were kept within the acceptable warning limits. Prior application of the numerical simulation before field excavation optimised axial loads and kept the deformation caused by excavation within project limits. The numerical simulation of servo geotechnology deformation control capacity for deep excavation projects is validated, and this study provides a practical and significant reference on similar projects.
1. Introduction
The advancement in geotechnical knowledge has led to the development of enhanced forms of underground construction for metro stations and high-rise buildings. The underground construction process requires deep basement excavation to specified depths. The deep excavation process comes with the challenge of deformation of the excavation pit and adjacent facilities due to the inadequate capacity of the traditional lateral support systems [1, 2]. The safety of the surrounding environment is threatened whenever the deformation occurring caused by excavation is not reasonably restrained [3–7]. Therefore, an in-depth study of the lateral support system is required to improve on the lateral load resistance of the support members on excavation sites.
To solve a deep excavation-induced deformation challenge, several researchers have adopted steel bracing as an excavation internal support system [8–14]. Their efforts have shown the rational and effectiveness of steel bracing in deep basement excavation-induced displacement control. Specifically, Wang [8] and Wu and Yanxia [9] obtained the excavation-induced displacements in the range of 40–125 mm when steel bracing was used on different deep excavation projects of depth ranging over 10 m. However, extra-sized steel sections had to be used, which increased the cost and the bracing labour to meet the required displacement limits imposed on the projects. Studies reported by Nicotera and Russo [12] and Benin et al. [13] adopted the steel bracing to support a deep foundation pit in soft rock and managed to reduce the excavation-induced displacement by 33% on average as compared with using other support members such as concrete struts. Hwang et al. [14] explained that, with the adoption of preloaded steel bracing as a deep excavation internal support structure, the induced deformation of the excavation is controlled to the extent of the predefined stiffness of the steel bracing support. The predefined steel stiffness cannot be increased in a loaded condition [3]. The steel bracing loses axial force in unexpected circumstances where the lateral load exceeds the support stiffness [11]. Eventually, the occurring deformation exceeds the standard limits [1]. This then could lead to construction challenges as well as endangering the adjacent structures [5, 7].
Steel bracing support stiffness enhanced by the hydraulic servo system has been reported by some researchers lately [15–19]. Specifically, Di et al. [15] investigated the deformation control mechanism of steel bracing with servo support and steel bracing without servo support based on simulated measured data. They divided the excavation pit into two parts. The first part was supported with steel bracing alone, while the second one was supported with a servo steel enhanced system. They found that the steel bracing alone in the excavation pit, which was without servo, exhibited a maximum of 86.7% axial force loss. In another study, PLAXIS 3D commercial finite element software was used by Ye et al. [20]. They analysed the basement excavation-induced deformation with respect to the steel bracing support system during the excavation process. Their measurements demonstrated that the steel bracing support without servo exhibited more than 65% loss in axial loading capacity. Ming-Guang et al. [18] adopted the FLAC3D commercial software program for a case study on the Taipei National Enterprise Centre (TNEC). The deep excavation was numerically modelled to assess the effectiveness of hydraulic servo steel-supported excavation-induced deformation control, and their results were consistent with the determinations of Di et al. [15] and Ye et al. [20].
Furthermore, Ming-Guang et al. [18] pointed out that the application of servo method in deep excavations is based on engineers’ experience and depends wholly on the available commercial software programs such as PLAXIS 3D and FLAC3D. Servo geotechnology is affected by slenderness ratio of steel struts, cross-section shape of steel struts, end conditions of steel struts, geometry of excavation, earth retaining wall type, construction procedure, and servo axial load application process [21]. Controlled experimental work for analytical-based solution to comprehensively consider these factors is a challenge [16]. Thus, simple and practical experimental-based analytical solutions cannot fully predict the excavation-induced deformation for servo method application [16]. Even though numerical simulation is capable of properly modelling the excavation complexity and the forenamed factors, the servo steel geotechnology support modelling process requires extensive computations and the simulation procedure in itself is complicated in practice [18]. The precision of numerical simulation is significantly affected by the choice of parameters. The preferred parameters primarily depend on the test method and are practically difficult to determine [19]. Comparatively, field construction site cases provide a suitable approach and first-hand experience to explore the servo steel supported system in excavation-induced deformation control of the excavation pit and surrounding environment [17]. Presently, there are few studies on the servo geotechnology application in deep excavation, and the limited available studies are based on numerical simulation [19]. With the process of urbanization, there are more deep excavation projects adjacent to structures and a strict requirement for excavation-induced deformation control. Thus, research regarding this phenomenon is still required. Therefore, this research takes two actual field projects and seeks to augment the actual field construction site applications of servo geotechnology with the numerical results to confirm the strength of servo method in deformation control caused by excavation in soft soil urban environment.
In this paper, case studies of two real field construction site application of hydraulic servo steel enhanced support geotechnology were carried out. The two construction site processes were monitored. The results from actual field works were compared well with previous research works based on numerical simulations on analysing the capacity of servo geotechnology enhanced supported system. In the first case scenario, a 16.5 m deep excavation of a subway station “Shenzhen Metro Rail Transit Line 12” (SMRTL_12) project in Shenzhen city, China, was analysed by measuring the excavation pit displacement with respect to the application of servo steel axial loading lateral support capacities from the numerical simulation results. The second case study was a 14.2 m deep basement excavation of “Triumph Unit” (TU) high-rise building block project in Hangzhou city, China. The field study was carried out by observing the actual displacement with respect to the inclusion of servo geotechnology directly at the construction site during the excavation works.
2. The Hydraulic Servo Capacity Steel Enhancement Geotechnology
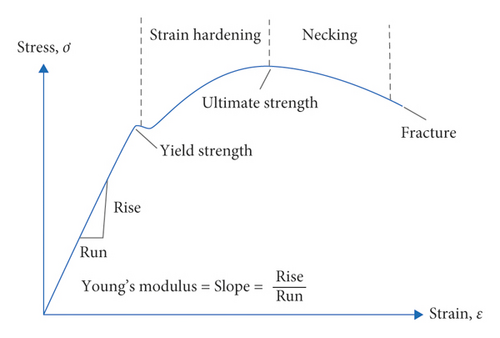
A deep braced excavation commonly consists of a retaining wall and lateral support such as steel struts. The lateral support is enhanced by the hydraulic servo system for the increased axial loading capacity. Figure 1 shows the stress-strain curve of a low carbon steel strut under typical phases of deformation when loaded to failure. With the initial stage of loading, the steel experiences elastic deformation up to the yield strength point. As the steel stress goes beyond yield point, it reaches the ultimate strength point. Beyond this point, the steel reduces in capacity and fractures. To overcome this phenomenon, the servo geotechnology is included to the steel bracing support in this study to increase the composite capacity of the lateral support system without increasing the steel support section.
Servo geotechnology comprises an automatic controlled computerised unit and a hydraulic module. The hydraulic module contains a hydraulic jack together with a hydraulic pump station. The hydraulic jack is set between the basement excavation pit wall and the end of steel bracing. The hydraulic pump station has a pressure transmitting system. The pressure transmitting system is connected to a computerised unit via an adjustable connector. Figure 2 shows the field application arrangement and working principle of the servo steel system linked to a computerised control system and station. Figure 3 shows the schematic diagram of the servo system hydraulic jack pressed between the retaining wall and the end of steel bracing support.
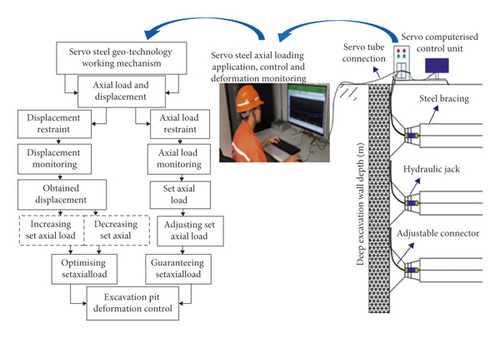
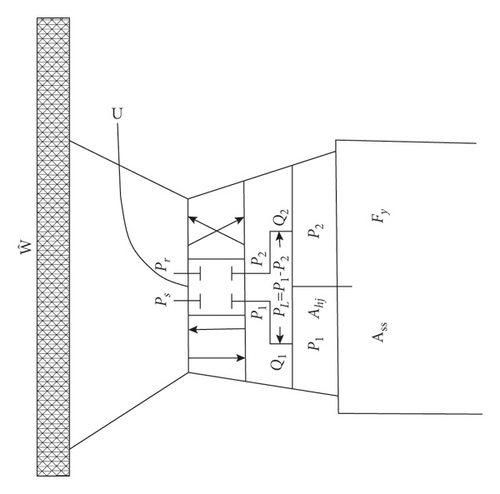
Thus, the computerised control station monitors the retaining wall displacement ϔ to trace any desired wall displacement as intimately as possible while providing feedback through an adjustable connector, U, which controls the inertial load. Then, the combined steel and servo load lateral support in (1) works together to control the deformation within the set limit. When this limit is exceeded and the retaining wall moves to the inside of the excavation pit, then the support loading capacity is raised in an automatic control system module via an adjustable connector, U. If the retaining wall moves away from the excavation pit, then the set support loading capacity is reduced, hence controlling the wall deformation within acceptable project warning limit.
One of the major advantages of servo capacity steel enhancement geotechnology application is that it increases the lateral support capacity through the application of extra support axial loading capacity. However, the servo support system application has some disadvantages. The timing of loading of servo steel bracing is based on engineers’ judgement [18]. In preloaded situations, the servo can cause puncture localised deformation when excess load is applied. If the servo load is applied after the steel strut has passed the ultimate loading stage, then the effect of the servo load cannot be optimised and the expected support capacity may not be reached [17]. The effect of servo steel enhanced support geotechnology on actual construction site displacement control is not comprehensive. This is because of the limited field construction site application of servo geotechnology [19].
3. Analysis of SMRTL_12 Subway Station Excavation Project: A Case of Numerical Simulation and Field Study
3.1. Project Description
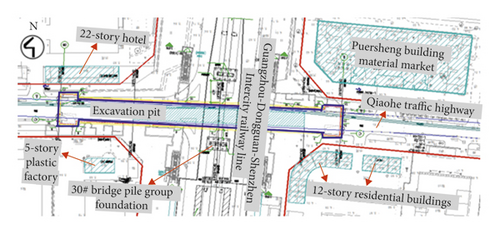
Hydraulic servo geotechnology applied to the SMRTL_12 subway station excavation pit in Shenzhen city, China, was investigated in this section. This case was preferred for analysis because the excavated pit was only 7.8 m away from a bridge pile group foundation. The high-rise buildings and pipelines were within the enclave of the excavation. Hence, there is a strict requirement for the safety of the surrounding environment. To understand the behaviour of subway excavation prior to actual excavation, numerical simulation was performed. The load carrying capacity of the support system at various levels of excavation was optimised during the simulation. Optimal servo axial loading capacities were adopted and applied to the actual excavation.
The subway excavation pit type was a braced, narrow-rectangular-shaped underground excavation, with a depth of 16.5 m, length of 230.5 m, and standard width of 21.1 m. It passed through a 14.1 m overhead height of Guangzhou-Dongguan-Shenzhen intercity railway line which was under construction. Figure 4 shows the plan view of project location and surrounding structures to the excavation pit. Project construction requirement for the maximum wall displacement was 0.15% of H (16.5 m; representing 25 mm). H refers to the excavation depth. The warning limits for retaining wall shear force, axial force, and bending moment were 3000 kN, 1200 kN, and 800 kN-m, respectively. The maximum ground surface settlement limit was 0.06% of H (16.5 m; representing 10 mm). The ground surface settlement influence zone limit was 1.09% of H (16.5 m; representing 18 m). The allowable displacement limit on adjacent 30# bridge pile group foundation was 3.0 mm maximum. The project standards conformed to various technical codes for excavation pit construction and protection of adjacent structures in railway transit urban environment [22–27].
Soil samples were obtained from the site by the drilling and sample survey method. A total of 46 machine drill holes were arranged at the sides and corners of the project site [28]. Laboratory soil tests such as Atterberg limit, plasticity index, and California bearing ratio as well as the in-situ dynamic penetrometer test, standard penetration test, and single-hole shear wave velocity test were performed on the soil samples. According to the test results, the soil stratum within the depth of 62 m has primarily soft silt to silty clayey properties, as shown in Tables 1 and 2.
| Soil layer no. | Soil layer name | Average thickness (m) | Unit weight γ (kN/m3) | Cohesive force C (kPa) | Internal friction angle f (°) | Poisson’s ratio |
|---|---|---|---|---|---|---|
| ① | Miscellaneous fill | 9.9 | 18.5 | 9.3 | 22.0 | 0.21 |
| ② | Silt | 5.4 | 17.4 | 7.5 | 9.0 | 0.3 |
| ③ | Silt | 13.8 | 18.9 | 18.8 | 23.9 | 0.3 |
| ④ | Silty clay | 2.7 | 19.3 | 25.0 | 15.0 | 0.24 |
| ⑤ | Sandy clay | 11.0 | 18.5 | 27.0 | 21.0 | 0.20 |
| ⑥ | Weathered granite rock | 22.1 | 21.0 | 536.0 | 34.1 | 0.17 |
| Soil layer no. | Soil layer name | Average thickness (m) | Stiffness | Permeability coefficient K (m/d) | ||
|---|---|---|---|---|---|---|
| E50ref (kN/m2) | Eoedref (kN/m2) | Eurref (kN/m2) | ||||
| ① | Miscellaneous fill | 9.9 | 2.325e4 | 3.123e4 | 9.957e4 | 21.4 |
| ② | Silt | 5.4 | 2.23e4 | 2.791e4 | 9.474e4 | 8.8 |
| ③ | Silt | 13.8 | 2.23e4 | 2.791e4 | 9.474e4 | 8.8 |
| ④ | Silty clay | 2.7 | 3.24e4 | 3.750e4 | 11.24e4 | 5.0 |
| ⑤ | Sandy clay | 11.0 | 3.0e4 | 3.310e4 | 10.93e4 | 0.1 |
| ⑥ | Weathered granite rock | 22.1 | 3.04e4 | 3.451e4 | 11.55e4 | 1.6 |
3.2. The Numerical Model
3.2.1. Procedure
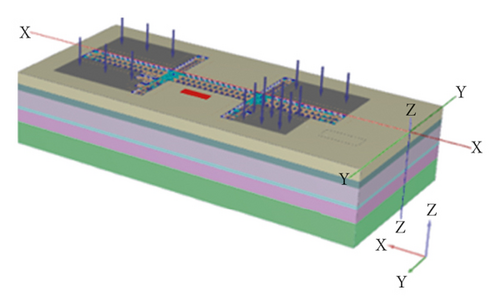
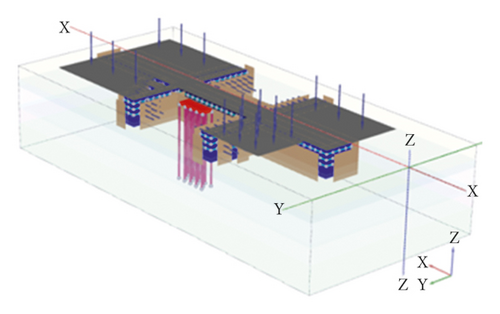
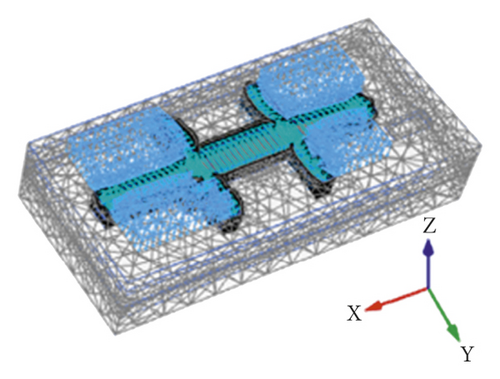
The excavation and support process was modelled in PLAXIS 3D FEM software, version 20.0. The working model was 310 m long, 150 m wide, and 62 m deep. Model top boundary condition was freely laid. Model bottom boundary condition was fixed, and lateral boundary condition was entirely placed on normal axis direction.
The HS-small material property was preferred as a soil constituent model, as shown in Tables 1 and 2. This was because the HS-small model takes into account stress dependence, thereby providing nonlinear elastic unloading/reloading behaviour [20]. It provides both qualitative and quantitative realistic deformation pattern and good bottom heave independent of model depth. This is attributed to small strain stiffness behaviour and more realistic settlements through behind retaining wall that is narrower and deeper [20]. The adopted numerical model parameters are given in Table 3, the numerical modelling steps are presented in Table 4, and the whole numerical model overview is shown in Figure 5.
| Parameters of plate element | ||||
|---|---|---|---|---|
| Parameter | Name | Sheet pile wall | Units | |
| Behaviour | Type | Elastic; nonisotropic | — | |
| Thickness | d | 1.00 | M | |
| Height | H | 24.00 | M | |
| Unit weight | Y | 2.75 | kN/m3 | |
| Young’s modulus | E1 | 14.60E6 | kN/m2 | |
| E2 | 73.00E4 | kN/m2 | ||
| Poisson’s ratio | v | 0.20 | — | |
| Parameters of beam element | ||||
| Parameter | Name | Steel strut | Units | |
| Material type | Type | Elastic | — | |
| Young’s modulus | E | 210.00E6 | kN/m2 | |
| Unit weight | Y | 78.50 | kN/m3 | |
| Cross-section area | A | 0.008682 | m2 | |
| Moment of inertia | I1 | 0.00 | m4 | |
| I2 | 0.000366 | |||
| I3 | 0.0001045 | |||
| Parameters of embedded beam element | ||||
| Parameter | Name | 30# bridge pile group | Units | |
| Young’s modulus | E | 30.00E6 | kN/m2 | |
| Unit weight | Y | 8.00 | kN/m3 | |
| Beam type | Predefined | Massive circular | ||
| Axial skin resistor | Type | Linear | ||
| Diameter | d | 2.00 | m | |
| Step | Action |
|---|---|
| 1 | Set up the adjacent 30# bridge pile group foundation. |
| 2 | Set up retaining wall, interfaces, and 20 kN working load [20]. |
| 3 | Excavation to −5.1 m. |
| 4 | Set the excavated area dry. Adapt pore pressure above the undrained layer by assuming the hydraulic condition and by interpolating the undrained layer. (Phreatic level behind retaining wall and below undrained layer remains unchanged since soil is blind to excavation.) |
| 5 | Set up the first steel-servo support at −4.5 m. |
| 6 | Excavation to −8.1 m. |
| 7 | Repeat Step 4. |
| 8 | Set up the second steel-servo support at −7.5 m. |
| 9 | Excavation to −11.1 m. |
| 10 | Repeat Step 4. |
| 11 | Set up the third steel-servo support at −10.5 m. |
| 12 | Excavation to −14.1 m. |
| 13 | Repeat Step 4. |
| 14 | Set up the fourth steel-servo support at −13.5 m. |
| 15 | Excavation to −16.5 m (formation level). |
| 16 | Repeat Step 4. |
| 17 | Construct 1.0 m bottom concrete slab at −15.5 m as a waterproof curtain. |
| 18 | Return original water state condition to normal (global water level). |
3.3. Numerical Simulation Results
3.3.1. Steel Bracing Support Alone
Figures 6–9 show the calculated wall displacement, structural forces, ground surface settlement profile, and the deformation profile of 30# bridge pile, respectively, when the excavation pit was supported with the steel struts alone. The maximum wall displacement equalled 0.51% of H (16.5 m; representing 84 mm), as shown in Figure 6. The maximum wall shear force, axial force, and bending moment were 3240 kN, 2100 kN, and 1250 kN-m, respectively, as depicted in Figure 7. The maximum ground surface settlement was 12.1 mm, and ground surface settlement influence zone reached 27.2 m behind the wall, as presented in Figure 8. The maximum displacement on 30# bridge pile was 3.4 mm, as shown in Figure 9.
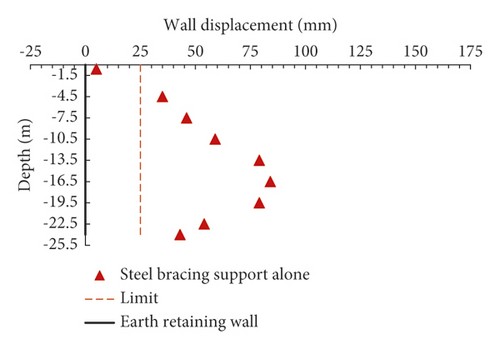
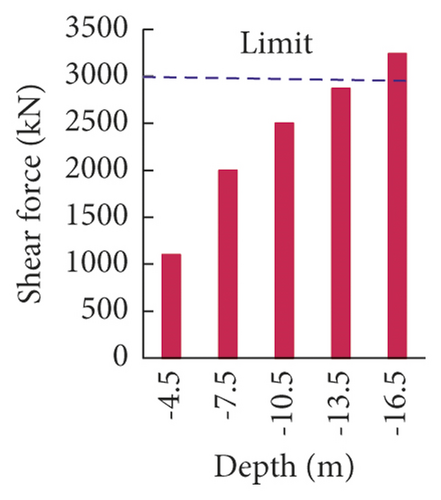
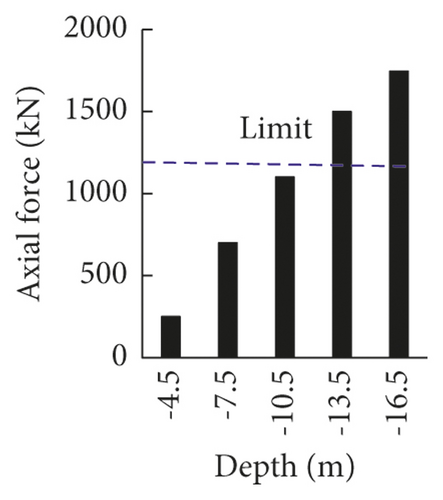
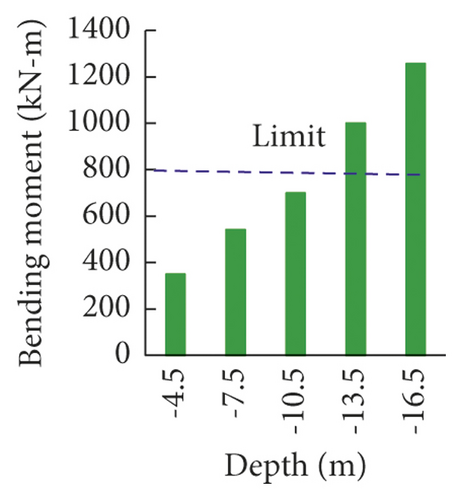
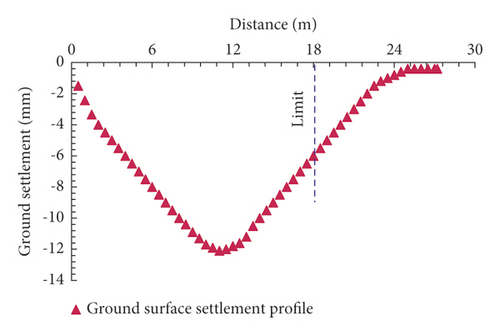
From Figures 6–9, the results exceeded project acceptable warning limits with the application of steel bracing support alone. Thus, the project model was not sufficient based on calculated results at the limit of project deformations. Hence, the servo method is included to enhance the load carrying capacity of steel support members.
3.3.2. Steel Bracing Support with Servo Axial Load Capacity Enhancement
During the numerical modelling, the servo load was modelled as a point load element which was pressed between the end of steel bracing and the retaining wall to enforce the lateral support mechanism [18]. The servo working principle in a numerical model involved setting initial estimated axial load capacity at current excavation stage and calculating the model to obtain corresponding deformation of support structure and adjacent structures. The corresponding deformation was then compared with the acceptable limit, optimised or adjusted, and recalculated until the satisfactory results were obtained.
(1) Retaining Wall Lateral Displacement. Figure 10 shows the calculated wall displacement results due to the inclusion of the servo method in a numerical modelling analysis. From Figure 10, the optimum servo steel axial loading capacities on wall displacement control were determined after 4 case attempts.
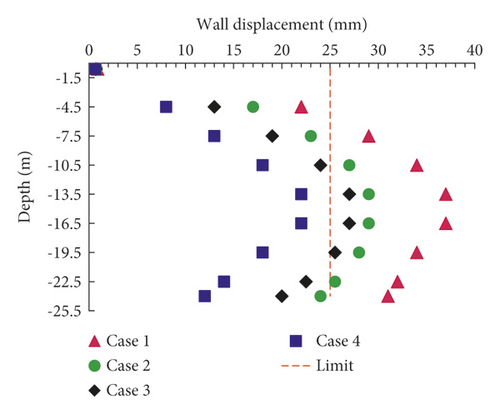
In case 1, the steel bracing was incorporated with a servo axial load of 2000 kN capacity in all elevations. The initial applied 2000 kN axial load was as estimated and provided by the project design institute. The maximum displacement of 0.23% of H (16.5 m; representing 37 mm) was obtained at case 1, which declined by 56% as compared with maximum displacement calculated when the pit support was steel bracing alone. Although there was tremendous percentage reduction of displacement, the calculated maximum displacement exceeded the allowable limit. Thus, 2000 kN servo load was only adopted at −0.5 m elevation, where the displacement fell within the limit at case 1, as demonstrated in Figure 10.
In case 2, the higher 2200 kN servo load was incorporated at −7.5 m, −10.5 m, and −13.5 m elevations, while the 2000 kN servo load was maintained at −4.5 m elevation. The calculated maximum displacement was 0.18% of H (16.5 m; representing 30 mm), as shown in Figure 10. The maximum displacement had dropped by 64% when comparison is made with steel struts support alone. The displacement was exclusively within allowable limit at −4.5 m and −7.5 m elevations, and this limit was exceeded as excavation depth increased.
In case 3, the higher servo load of 2400 kN was incorporated at −10.5 m and −13.5 m elevations where the displacement limit was exceeded at case 2. Concurrently, the 2000 kN and 2200 kN axial load capacities were maintained at −4.5 m and −7.5 m stages, respectively, where the displacement fell within the limit at case 2. The calculated maximum displacement was 0.164% of H (16.5 m; representing 27 mm), as shown in Figure 10. The maximum displacement had declined by 68% as compared with the displacement results obtained when the support was steel bracing alone. However, the maximum displacement at −13.5 m and −16.5 m elevations exceeded the allowable limit.
In case 4, the higher 2600 kN servo load was incorporated at −13.5 m elevation only. The 2000 kN, 2200 kN, and 2400 kN servo loads remained unchanged at −4.5 m, −7.5 m, and −10.5 m elevations, respectively, where the displacement fell within the limit at case 3. The calculated maximum displacement became 0.13% of H (16.5 m; representing 22 mm), which declined by 74% compared with the calculated maximum displacement when the support was steel bracing alone. The calculated results satisfied the requirement at the limit of displacement of 0.15% of H (16.5 m; representing 25 mm). Thus, the inclusion of the servo method enhanced the wall displacement control at case 4 numerical calculation.
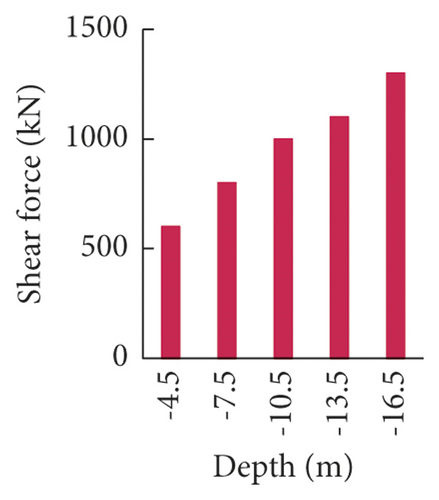
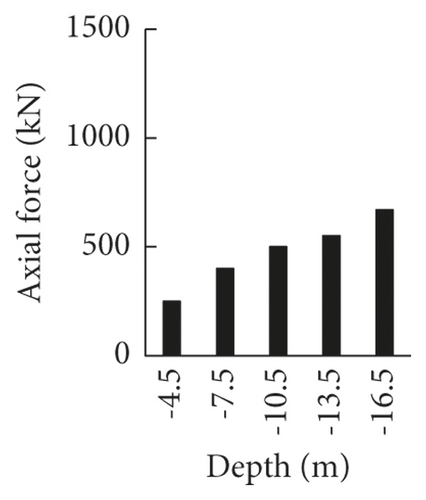
(2) Retaining Wall Structural Forces. The shear forces, axial forces, and bending moments of the retaining wall were investigated when the 2000 kN, 2200 kN, 2400 kN, and 2600 kN axial loading support capacities were, respectively, applied at −4.5 m, −7.5 m, −10.5 m, and −13.5 m elevations.
Figure 11 shows the calculated maximum shear force, axial force, and bending moment of 1270 kN, 650 kN, and 440 kN-m, respectively. From Figure 11, we can see that the shear force, axial force, and bending moment fell under the project acceptable limits. The shear force had reduced by 60.8%, the axial force had dropped by 69%, and the bending moment had decreased by 71.6%. Thus, the structural forces had declined significantly compared with the calculated structural forces when the support was steel bracing alone. Hence, the model was sufficient enough based on structural forces’ dataset.
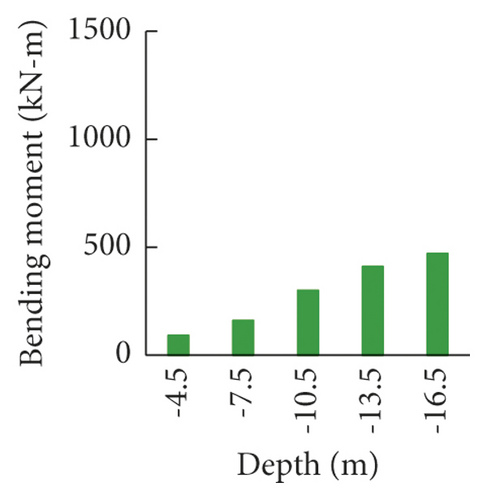
(3) Ground Surface Influence Zone Settlement. The ground surface influence zone settlement was investigated with the respective application of servo load capacities of 2000 kN, 2200 kN, 2400 kN, and 2600 kN at −4.5 m, −7.5 m, −10.5 m, and −13.5 m elevations. Figure 12 shows the calculated ground surface influence zone settlement profile.
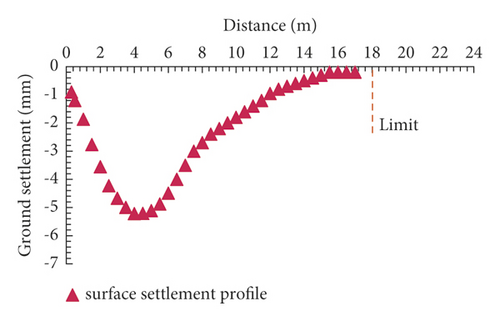
From Figure 12, we can see that the maximum ground surface settlement was 5 mm and was within the project acceptable limit of 0.06% of H (16.5 m; representing 10 mm). The influence zone was kept at 17 m behind the wall as required. The maximum ground surface settlement had reduced by 59%, and the settlement influence zone had dropped by 37.5%. This was as compared with the calculated ground surface influence zone settlement profile when the support was steel bracing alone. Thus, with the application of servo loads, the ground surface settlement and the influence zone were controlled desirably.
(4) Adjacent 30# Bridge Pile Group Foundation. The next step was to investigate the deformation on the adjacent 30# bridge pile if satisfactory due to the effect of the excavation-induced ground surface settlement profile. If not satisfactory, then the optimisation process was to be repeated with other set of servo loads until the requirement was met. This was done to examine the safety of a 7.8 m closest 30# bridge pile prior to the actual excavation.
Figure 13 shows that the 30# bridge pile experienced a maximum displacement of 0.015% of H (16.5 m; representing 2.4 mm), which declined by 29.4% as compared with the calculated maximum displacement when the support was steel bracing alone. The calculated maximum displacement was very minimal and within the project allowable limit. Thus, the project excavation posed almost negligible impact on the 30# bridge pile with the inclusion of the servo method [1]. This result agreed well with the finding of Ming-Guang et al. [18], which demonstrated the strong control capacity of servo steel geotechnology on surrounding environment relative deformation caused by excavation.
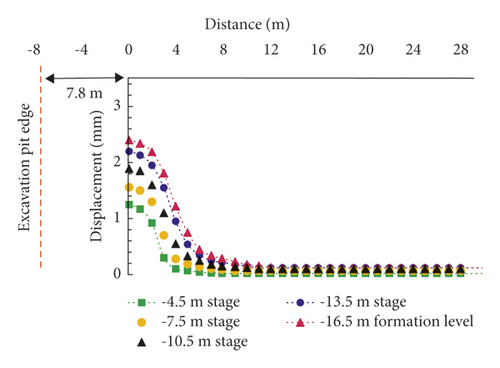
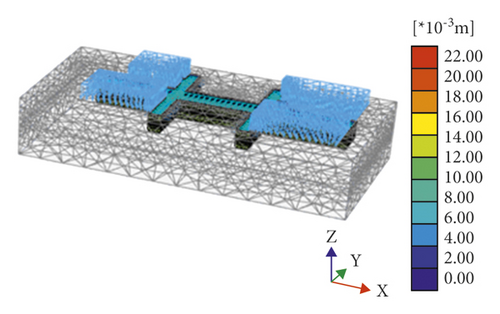
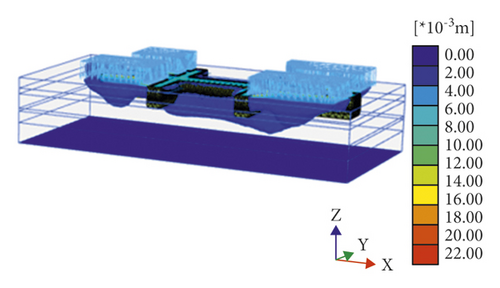
Therefore, the optimum servo steel bracing axial loading capacities were 2000 kN at −4.5 m excavation stage, 2200 kN at −7.5 m excavation stage, 2400 kN at −10.5 m excavation stage, and 2600 kN at −13.5 m excavation stage. With the application of the optimum results, the deformation caused by excavation was restrained as required. Moreover, Figure 14(a) shows the influence of the optimum axial load application on the whole project model displacement. Figure 14(b) shows the numerical model displacement pattern isosurface which details the inside of the soil model. The displacement pattern isosurface significantly demonstrated that there was unloading soil material behaviour. This phenomenon was mainly influenced by vertical unloading at excavation bottom depth and horizontal unloading behind the wall [20]. Vertical unloading behaviour of the soil was attributed to the influence of 20 kPa working load, earthwork excavation, and lateral support application, eventually resulting to the lateral forces and exposure of retaining wall to earth and hydrostatic pressure. Moreover, the excavation pit was stable enough based on PLAXIS 3D analysis. Failure due to heaves was not encountered.
3.4. Actual Field Works at SMRTL_12 Subway Station Construction Site
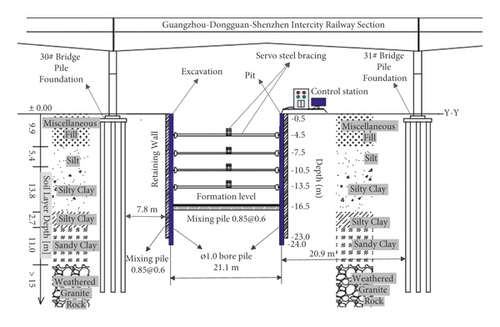
Four steel bracing levels were erected as the internal support structure. The bracing was a straight steel tube support with a diameter of 609 mm and thickness of 16 mm. It was horizontally and vertically spaced 10 m and 3 m apart in all elevations, respectively. The steel bracing had a stiffness of 500 MN/m, resistance of 9000 kN, and adjustment coefficient of 1.0. It had movable ends for prestress application and was erected at −4.5 m, −7.5 m, −10.5 m, and −13.5 m elevations. Optimum servo steel bracing axial loads of 2000 kN, 2200 kN, 2400 kN, and 2600 kN as determined during numerical simulation were applied at each steel elevation, respectively.
The retaining structure construction preceded the steel servo support erection. It included the enclosed bored piles (Ф1000@1000, length 24 m, C35). 1019 (Ф850@600, length 23 m) high-pressure rotary jet piles surrounded the excavation pit as waterproof curtain. For geotechnical condition, the soil strata at the site are shown in Tables 1 and 2. Figure 15 shows the profile of the excavation cross-sectional view. Table 5 presents the actual excavation field works.
| Construction sequence | Activity | Depth (m) |
|---|---|---|
| 1 | Installation of earth retaining support system | |
| 2 | Excavation process | −5.1 |
| 3 | Install the first optimum servo steel support | −4.5 |
| 4 | Excavation process | −8.1 |
| 5 | Install the second optimum servo steel support | −7.5 |
| 6 | Excavation process | −11.1 |
| 7 | Install the third optimum servo steel support | −10.5 |
| 8 | Excavation process | −14.1 |
| 9 | Install the fourth optimum servo steel support | −13.5 |
| 10 | Excavation process to formation level | −16.5 |
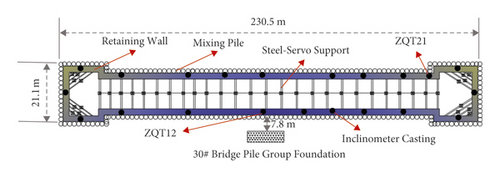
The excavation pit was instrumented with the inclinometer castings to trace the excavation-induced behaviours. Figure 16 shows the subway station excavation pit plan view, with the inclinometer castings buried in the retaining wall to measure the wall lateral displacement and ground movement behind the wall. The inclinometers were cautiously calibrated and were often checked to avoid measurement inaccuracy [29].
During the actual field study, only the influence of servo steel loading support application on the selected two inclinometer pile bodies’ horizontal displacement and ground surface influence zone settlement profile was investigated. This was done to portray the strength of servo steel enhanced support geotechnology in deep excavation-induced displacement control on an actual construction site application basis. The influence of servo steel loading support application on retaining wall structural forces and on 7.8 m closest 30# bridge pile group foundation was not investigated.
The ZQT21 and ZQT12 were preferred for monitoring analysis. The ZQT21 was opted to get the excavation pit 3D corner effect behaviour since it was established at the corner of the pit. The ZQT12 was preferred because it was adjacent to the 30# bridge pile group foundation. The proximity of 30# bridge pile eventually helped in getting the actual maximum wall displacement due to the distribution of pressure in the soil mass which influenced the soil movement [7, 10].
3.4.1. Field Monitoring Results
Figure 17 shows the measured pile body cumulative horizontal displacement development pattern over the excavation stages of each of the two selected monitoring points. Figure 17(a) indicates that the ZQT21 experienced a maximum horizontal displacement of 0.099% of H (16.5 m; representing 16.3 mm) at 0.41 H (6.8 m) elevation during earthwork excavation to −13.5 m elevation. The minimal horizontal displacement on ZQT21 can be attributed to the excavation pit 3D corner effect behaviour resulting from the reduced displacement development inside the excavation area [7, 10]. Similarly, Figure 17(b) demonstrates that the ZQT12 experienced a maximum horizontal displacement of 0.109% of H (16.5 m; representing 17.9 mm) at the top of the pile during excavation advancement to −13.5 m elevation. Moreover, the measured maximum horizontal displacement on both ZQT21 and ZQT12 satisfied this project requirement at the limit of displacement of 0.15% of H (16.5 m; representing 25 mm). The higher horizontal displacement on ZQT12 pile top can be attributed to the closeness of 30# bridge pile group foundation, thereby influencing the ground surface movement, which led to the distribution of pressure across the ground [10].
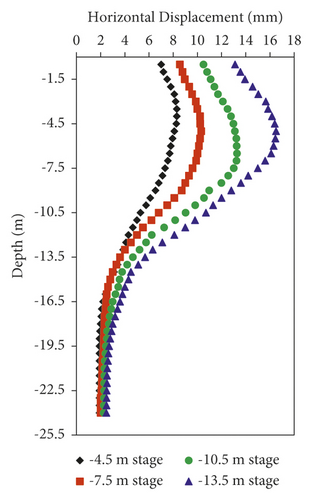
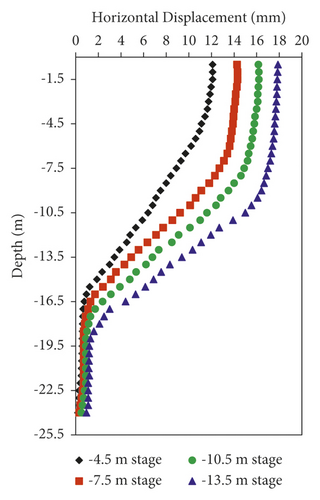
With the erection of servo steel axial load support in all elevations, the increase in horizontal displacement on both ZQT21 and ZQT12 stopped. The stoppage of pile bodies’ cumulative horizontal displacement confirmed the strength of servo steel enhanced support geotechnology in restraining wall displacement caused by excavation.
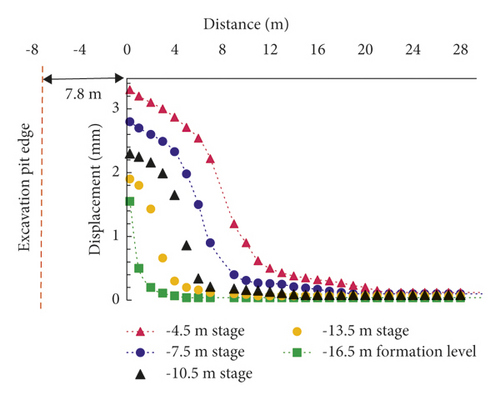
Figure 18(a) shows the measured maximum ground surface settlement on ZQT21 of 1.85 mm at 4 m distance, which got to zero at 12.5 m behind ZQT21 wall. The maximum ground surface settlement on ZQT12 was 2.8 mm at 4 m distance, which reached zero at 14.9 m behind ZQT12 wall, as shown in Figure 18(b). The more ground surface influence zone settlement behind ZQT12 can be attributed to the project site working loading condition close to ZQT12 inclinometer point. Some of the construction materials were stockpiled near ZQT12 inclinometer, eventually experiencing more ground surface settlement from the additional loading. However, the ground surface influence zone settlements on both ZQT12 and ZQT21 were restrained within the project acceptable warning limits with the application of the optimum servo steel axial loading capacities.
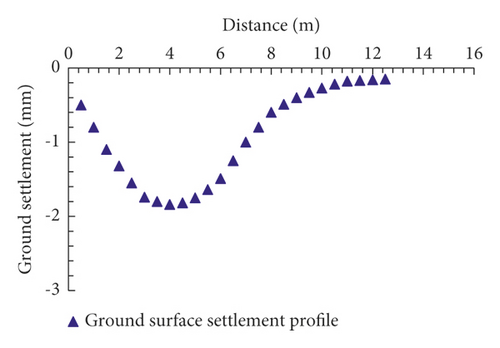
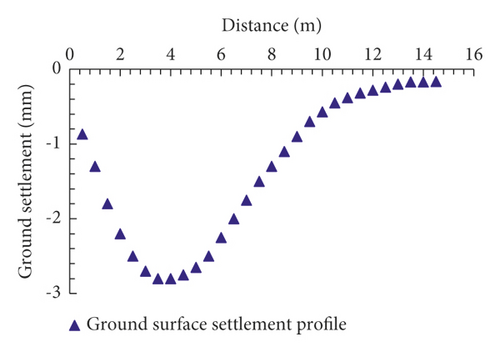
Comparatively, the measured field data at SMRTL_12 was consistent with the calculated numerical model data. Prior numerical simulation provided a superior site working conditions. First, it helped in the speedy execution of actual excavation works, since the steel servo axial load support capacity was known beforehand. Errors on the project were significantly reduced, since the optimum construction sequence of field works was known in advance. Project execution safety standards were improved, since the excavation pit and the surrounding environment relative deformations caused by excavation were known prior to actual works. The obtained results clearly justified the use of PLAXIS 3D numerical simulation solutions for field excavation site servo geotechnology enhanced support application.
4. Analysis of Triumph Unit Basement Excavation Project: A Case of Field Study
4.1. Project Description
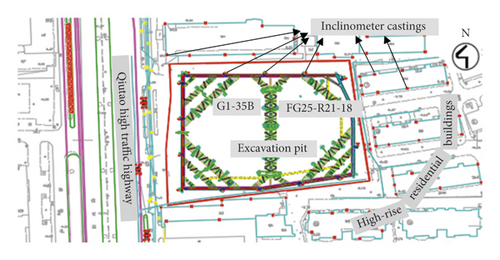
Another field excavation study application of servo steel enhanced support geotechnology was a deep foundation pit of Triumph Unit, FG25-R21-18 Jing-fang demolition resettlement house and the west side G1-35B park green space project in Hangzhou city, Zhejiang Province, China. This case was preferred for analysis because it provided a first-hand information of the real-time direct application of the servo method. The TU building block basement was internally supported with a hydraulic servo steel bracing system, and the servo loadings were applied, adjusted, and optimised directly at the construction site during the project construction.
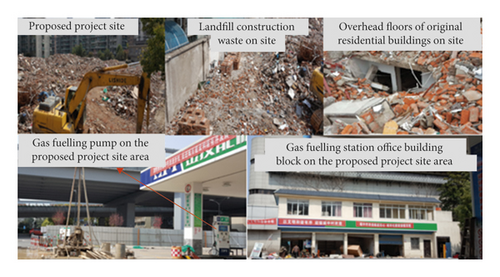
The project excavation pit was a braced, wide-pentagon-shaped underground excavation with a depth of 14.2 m and standard area of 2334.5 m2. It was located within the enclave of existing high-rise residential buildings and a high traffic highway. Figure 19 shows the project site location and the surrounding environment. Furthermore, there were many existing facilities at the proposed project site, as shown in Figure 20. The existing buildings were demolished and levelled completely. The underground fuel gas tanks were relocated to a 207 m nearby gas station with all necessary precautions taken accordingly [30].
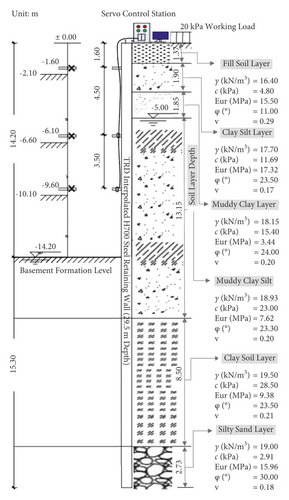
Soil samples were obtained from the site by the drilling and sample survey method. A total of 15 machine drill holes were arranged at the sides and corners of the project site [28]. Laboratory soil tests such as Atterberg limit, plasticity index, California bearing ratio as well as the in-situ dynamic penetrometer test, standard penetration test, and single-hole shear wave velocity test were carried out on the soil samples. The soil strata at the project construction site were primarily of soft clay according to the test results. Figure 21 shows the project site soil parameter layers’ name, depth, unit weight γ (kN/m3), cohesive force c (kPa), stiffness Eur in (MPa), internal friction angle f (°), and the unit less Poisson ratio v, within the first 29.50 m retaining wall soil depth.
Because of the strict requirement for protection of project site surroundings, the required project construction standards were stipulated and followed during the actual works. One of the project construction stipulated standards specified the warning limit for both wall lateral displacement and ground surface settlement to not exceed 0.21% of H (14.2 m; representing 30 mm). The stipulated standards also limited ground surface settlement influence zone to 1.41% of H (14.2 m; representing 20 m). The project standards conformed to various technical codes for deep excavation pit construction and surrounding environment safety in Zhejiang Province and surrounding cities [22–27, 31].
Monitoring instruments such as inclinometers were placed on surrounding buildings to ensure their safety while the project was being carried out. The various wall lateral displacements and ground movements were monitored to ensure safety.
4.2. Triumph Unit Excavation Pit Support Structure Construction
The excavation pit retaining wall included the thermal-reactive diffusion (TRD) interpolated H700 steel pile wall. The pile wall had a maximum depth of 29.50 m. The pile type was a section steel. The steel grade was Q235 with a material parameter of HN700 × 300. The compression, shear, and bending resistance of the pile wall was 215 MPa. Its plastic development coefficient was 1.05. Figure 21 shows a cross-sectional view of the excavation pit section support.
Three internal steel bracing support levels were constructed. The steel bracing support had 800 mm diameter with 16 mm thickness and was diagonally spaced 5 m apart at the corners of each elevation. The steel bracing vertical spacing was 1.60 m, 4.50 m, and 3.50 m, respectively. All the three steel bracing supports were preloaded with 1520 kN axial loading capacity. The steel stiffness was 500 MN/m, with a resistance of 9000 kN, and the adjustment coefficient was 1.0. The steel bracing supports had movable ends for prestress application and were erected at −1.60 m, −6.10 m, and −9.60 m elevations. At each erection stage, the steel support was incorporated with the hydraulic servo system to enhance the steel bracing lateral support mechanism. Table 6 details the actual basement excavation and support structure construction sequences.
| Construction sequence | Activity | Depth (m) |
|---|---|---|
| 1 | Install the earth retaining support structure | |
| 2 | Excavation process | −2.10 |
| 3 | Erect the first steel bracing support | −1.60 |
| 4 | Add and optimise the servo load to the first steel support | −1.60 |
| 5 | Excavation process | −6.60 |
| 6 | Erect the second steel bracing support | −6.10 |
| 7 | Add and optimise the servo load to the second steel support | −6.10 |
| 8 | Excavation process | −10.10 |
| 9 | Erect the third steel bracing support | −9.60 |
| 10 | Add and optimise the servo load to the third steel support | −9.60 |
| 11 | Excavation process to the basement formation level | −14.20 |
4.3. Triumph Unit Field Monitoring Results
4.3.1. Wall Lateral Displacement
The measured field works were examined for three different application cases of servo steel bracing axial loading capacities, with the excavation profile unchanged in all three cases.
In the first case, steel bracing with a predefined axial load of 1520 kN was applied in all elevations at −1.6 m, −6.1 m, and −9.6 m. The measured maximum displacements were 27 mm, 44 mm, and 61 mm at −1.6 m, −6.1 m, and −9.6 m elevations, respectively, as demonstrated in Figure 22(a). The obtained displacement data satisfied the limit of displacement of 0.21% of H (14.2 m; representing 30 mm) at −1.6 m stage. As the excavation depth increased, this limit was exceeded. This was confirmed by the results at depths of −6.1 m and −9.6 m.
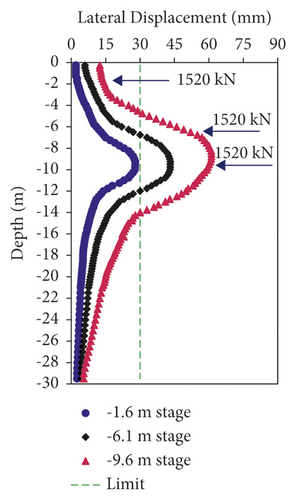
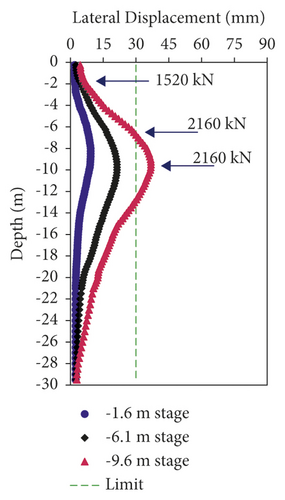
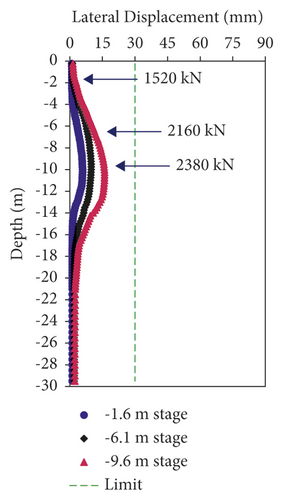
In the second case, a servo loading with 640 kN capacity was incorporated at depths of −6.1 m and −9.6 m where the predefined steel bracing with 1520 kN axial load was erected. This made the total load applied at −6.1 m and −9.6 m stages in the second case increased to 2160 kN capacity. The predefined steel stiffness with 1520 kN axial load was left unchanged at −1.6 m elevation. Then, the measured maximum displacements became 9 mm, 22 mm, and 37 mm for all three elevations, as shown in Figure 22(b). The displacement measurement was above the project allowable limit at −9.6 m elevation.
In the third case, the 640 kN servo load applied at −9.6 m stage where the incurred displacement exceeded the required limit was adjusted with another servo load of a greater capacity of 860 kN. The servo loading with 640 kN capacity was still incorporated at −6.1 m elevation. The predefined steel bracing with 1520 kN axial load was maintained in all support elevations. This eventually made the total support axial loading of 1520 kN at −1.6 m stage, 2160 kN at −6.1 m stage, and 2380 kN at −9.6 m stage. After support erection, the measured displacements were 6 mm, 10 mm, and 16 mm at −1.6 m, −6.1 m, and −9.6 m stages, respectively, as depicted in Figure 22(c). The maximum displacement was 0.11% of H (14.2 m; representing 16 mm) at −9.0 m depth when the excavation earthwork was advanced to −9.6 m elevation in the third case. The measurements were within the limit of 0.21% of H as required by the project standards. Compared with the measured maximum displacement in the first case, the displacement in the third case declined by 74%, 77%, and 78% at −9.6 m, −6.1 m, and −1.6 m excavation stages, respectively. Thus, the displacement reduced by 76% on average with servo steel enhanced support geotechnology application. This field result was consistent with the previous findings of Di et al. [15].
From Figure 22, the displacements that were obtained in the first case were restrained adequately but not to the extent of meeting the project expected limit in all basement excavation stages. The obtained displacement satisfied the project allowable limit at −1.6 m elevation. This finding agreed well with Wu et al. [9] determination which depicted that the steel support is effective for lateral support of shallow excavations. When estimated and applied appropriately, steel bracing support in shallow foundations reduces excavation-induced deformation as required [9].
Moreover, with the incorporation of servo loading at −6.1 m in the second case, the displacements were further restrained. The measurements were satisfactory for project required displacement limit at −1.6 m and −6.1 m elevations but not satisfactory at −9.6 m elevation. With higher servo axial force application at −9.6 m elevation in the third case, the displacements were controlled remarkably to meet the limit of displacement as required by the project standards. Hence, increasing the applied force in the servo steel bracing helped to limit the displacement induced by the excavation stage to meet the limit of required displacement. This showed that the larger the servo steel enhanced the axial load support application in subsequent basement pit elevations, the greater the wall lateral displacement reduction. Therefore, the servo geotechnology placed at deeper depth optimised the axial loading capacity and reduced the soil body displacement desirably.
4.3.2. Ground Surface Influence Zone Settlement
The influence of servo steel enhanced support geotechnology application on the profile of ground surface settlement was analysed at TU project site. This was done to investigate the servo steel method application effect on the surrounding environment relative deformation. Figure 23 shows the measured ground surface settlement profile for the steel and servo method application in the first, second, and third case scenarios.
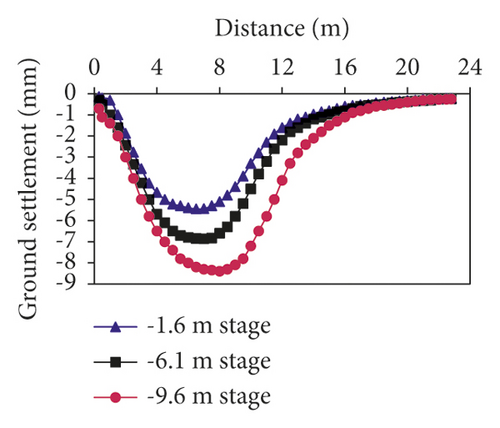
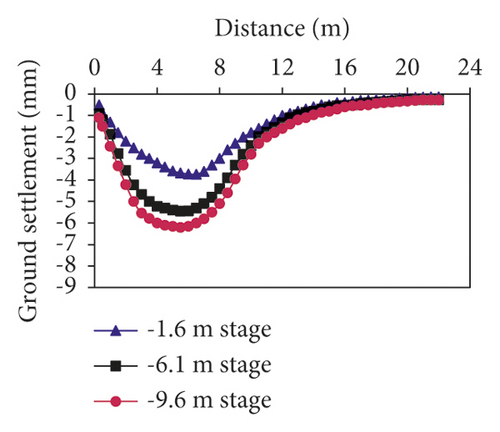
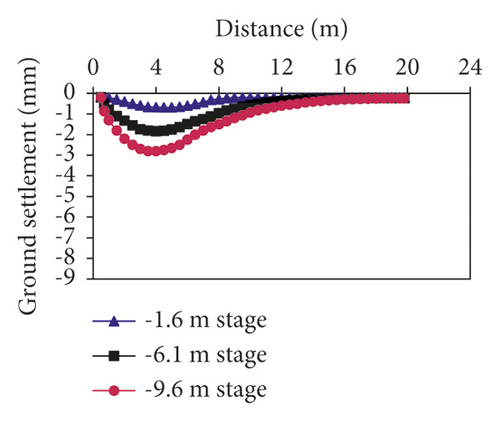
From Figure 23, we can see that the maximum ground surface settlement was 8.5 mm (representing 0.061% of H), 6.2 mm (representing 0.044% of H), and 2.8 mm (representing 0.020% of H) in the first, second, and third cases, respectively. The measured maximum ground surface settlement was within the acceptable project ground surface settlement limit of 0.21% of H (14.2 m; representing 30 mm) in all three cases. The ground surface settlement increased gradually as the excavation depth increased. The ground surface settlement in the third case dropped by 67% as compared with the measured ground surface settlement in the first case when the support was steel bracing alone. With higher servo load application in subsequent excavation elevations during the third case, the ground surface settlement declined significantly. This finding corroborated well with the determination of Ming-Guang et al. [18] during their numerical simulation measurements, which showed the effectiveness of servo support application on ground surface settlement control.
Furthermore, during the first case, the ground surface settlement increased up to a maximum value of 8.5 mm at a distance of 8.9 m away from the basement pit when the excavation earthwork was advanced to −9.6 m stage, as shown in Figure 23(a). This confirmed that the ground surface settlement increases as excavation depth increases [32]. After the application of steel support alone, in all elevations in the first case, the ground surface settlement declined rapidly and got to zero at 22.9 m distance away from the excavation pit. This finding correlated well with the determinations of Liang et al. [5] and Wang [8], which described that the steel support alone in excavation is capable of reducing the ground surface influence zone to a certain degree. However, the measured ground surface settlement influence zone limit of 1.41 H (14.2 m; representing 20 m) as required by this project was exceeded in the first case.
In the second case, the maximum ground surface settlement occurred at 5.0 m distance during excavation to −9.6 m elevation and reached zero at 22.0 m distance away from the excavation edge, as shown in Figure 23(b). As compared with the first case, the ground surface settlement influence zone reduced by 0.9 m from 22.9 m to 22.0 m. The effect of servo load application at −6.1 m stage in the second case on ground surface settlement influence zone control was unnoticeable and minimal. The project stipulated a ground surface settlement influence zone limit of 1.41 H which was exceeded.
With the application of higher servo load capacity at a subsequent deeper elevation of −9.6 m in the third case, the ground surface settlement influence zone reduced by 5.1 m from 22.9 m to 17.8 m (compared with the first case) and by 4.2 m from 22.0 m to 17.8 m (compared with the second case). The maximum ground surface settlement occurred at 4.0 m distance and got to zero at 17.8 m distance behind the wall, as depicted in Figure 23(c). Moreover, the ground surface settlement influence zone result in the third case was restrained greatly within the acceptable limit of 1.41 H (14.2 m; representing 20 m) as required by the project. This implies that the incorporation of higher servo load capacity in the third case played a remarkable role in the ground surface influence zone settlement control.
Unlike the first SMRTL_12 subway station excavation project where the prior numerical simulation provided beforehand site working experience, at TU excavation project, some lapses were exposed in the direct application of the servo method on-site without prior numerical simulations. The exact needed servo axial load support was not known in advance; hence, there is the need to apply trial servo loads. If the servo load was overestimated and applied, the localised punching damage on the support structure would have occurred [32]. Therefore, the general method of application as used at this project was to start from a lower servo load as estimated by the project engineers and increase it gradually until the displacement was within the limits for the support walls. This method could have also posed a risk of having irrecoverable displacements on supported walls and settlements on existing structures within the influence areas beyond the required limits [30]. Nonetheless, the direct application of the servo geotechnology at TU project site restrained the displacement of the excavation on-site desirably. The application of the servo steel geotechnology in both projects was beneficial. The excavation-induced deformations were restrained within the respective project acceptable warning limits, the safety of surrounding environment was ensured, and both projects were completed successfully.
Moreover, the results from the two projects validated well with the servo numerical simulation application results from previous studies of Di et al. [15], Ming-Guang et al. [18], and Sun [19]. Specifically, Ming-Guang et al. [18] study restrained the wall displacement to 95 mm and ground surface settlement influence zone to 60 m distance behind an excavation pit of depth 19.7 m maximum. This was achieved after application of 2600 kN and 4000 kN servo load capacities at the middle and final excavation stages, respectively. Similarly, a research conducted by Di et al. [15] observed that a 24.8 m deep excavation pit, which was supported with a servo system, controlled the wall displacement by 71% on average. It reduced the ground surface settlement by 62% on average and limited the maximum ground surface settlement influence zone to 15 m away from the excavation pit. This was achieved in comparison with the measurements of the section of the same pit which was supported with steel bracing alone. In their conclusion, Di et al. [15] stated that the incorporation of higher servo load capacity of more than 2131.5 kN in later subsequent excavation stages controlled the displacements efficiently in the section that was supported with a servo system. A study conducted by Sun [19] concluded that employing higher servo axial loading capacity at depths of more than 10 m during the excavation process results in greater displacement reduction by up to more than 60% compared with employing steel bracing support alone. Thus, the present numerical simulation literature data substantiate well with both SMRTL_12 subway station and TU basement construction field data. They all demonstrate the strong capacity of servo steel enhanced support geotechnology in restraining the deformation caused by excavation.
5. Conclusion
- (1)
On the SMRTL_12 subway station project, the servo axial loading capacities were first simulated and optimised in a numerical model. Then, the optimum servo axial loads were adopted and applied during the actual construction. On the TU high-rise building basement project, the servo axial loading capacities were applied and adjusted directly at the construction site during the construction process.
- (2)
Servo steel enhanced support geotechnology deep basement internal support application was able to increase the load carrying capacity of the support structures at various levels of excavations. The stiffness of the support structure was increased by the application of the hydraulic servo.
- (3)
With the application of servo load capacities to the two field case studies, the deep basement excavation induced cumulative displacements were kept within the limit of displacements as required by each respective project. Specifically, the measured maximum wall displacement of TU high-rise building block basement excavation was reduced by up to 76% on average.
- (4)
Comparing the SMRTL_12 calculated numerical model results with the measured field data, the prior numerical simulation of the required servo capacity provided an efficient site working condition by increasing the safety on both the project and the 7.8 m adjacent 30# bridge pile group foundation from the effect of the excavation-induced deformations. The works involved with the use of servo on-site were significantly reduced. Hence, the application of numerical simulation before actual field works was justified.
- (5)
The measured data at the TU field project demonstrated that the servo steel axial loading support enhancement geotechnology is a suitable option for application to actual construction of deep excavation projects with strict deformation control requirements. This actual construction application validated previous research works based on numerical simulations.
- (6)
This research could not substantiate the effect of servo steel enhanced excavation pit support pre- or postloading on the displacement of the excavation. It is recommended that future works could investigate this phenomenon to optimise the servo geotechnology field construction site application process.
Conflicts of Interest
The authors declare that there are no conflicts of interest regarding the publication of this paper.
Acknowledgments
This work was supported by the Shenzhen Metro Group Co., Ltd., China, and Archtectural Design Research Institute of Zhejiang University. Their support is greatly acknowledged.
Open Research
Data Availability
The data used to support the findings of this study are included within the article.


