A Low-Cost Online Data Acquisition and Processing System for Industrial Pollutants’ Monitoring
Abstract
Recently, the prevention and control of industrial pollution has attracted extensive attention. Many studies based on emission data have achieved great success, but there are relatively few studies on the emission data acquisition. To this end, we propose a data acquisition and processing system (DAPS) for online monitoring of industrial pollutants. The system receives real-time emission data through the RS485, automatically generates periodic data, and saves it in the SQL Server database. Real-time Ethernet (RTE) is used to transmit control signals between the system and programmable logic controllers (PLCs). Emission data is transmitted to local industrial control systems and remote monitoring centers (RMCs) via a wireless network. We tested the acquisition function and communication function of the system through experiments and evaluated the overall performance of the system by observing the memory and CPU usage. The system is characterized by simple implementation and versatility and can be applied to continuous monitoring of various industrial pollutants.
1. Introduction
While industrialization promotes rapid economic growth, air pollution, such as PM, sulfur dioxide (SO2), and carbon dioxide (CO2), has also brought serious harm to the living environments and adversely affected human health [1, 2]. Industrial flue gas emitted from coal combustion is one of the chief causes of air pollution in an industrial city. More and more scholars pay attention to the pollution prevention and control of industrial cities [3, 4].
Continuous emission monitoring system (CEMS) is made up of sampling equipment, process control equipment, and DAPS, which is used to implement online monitoring of pollutants [5]. Some scholars have performed research on the application of CEMS. Through field investigation and literature analysis, the authors studied the operation and management of CEMS in China from a holistic perspective and summarized the problems, such as inconsistent installation and certification, lack of on-site inspection, and incomplete monitoring and maintenance plan [6]. Reference [7] used CEMS data to compile a comprehensive and real-time emission inventory, which provides a reliable reference for the formulation of pollution control policies. In [8], the authors studied the trends in PM, SO2, and nitrogen oxide (NOx) emissions during sintering in China based on CEMS data, and the results confirmed the effectiveness of current emission control policies and standards in the steel industry. Through the study of CEMS data from China’s coal-fired power industry, it was found that the online measurement data-based evaluation method can better capture air pollutant emissions than the traditional inventory-based evaluation method [9]. In [10], the author uses CEMS and satellite measurement data to evaluate the impact of air pollution standards on sulfur dioxide emissions. Through analysis, it is found that there are problems, such as inaccurate CEMS data and data fraud, and data supervision should be strengthened to ensure the authenticity of the data.
The hardware equipment in CEMS (various analyzers and auxiliary sampling equipment) is responsible for collecting emission data. Due to the lack of a unified standard, DAPS must be compatible with analyzers provided by different manufacturers, and scalability must be fully considered in the design of DAPS [11]. The data during equipment maintenance, repair, and failure is usually meaningless. Additionally, software failures can also lead to missing data. Missing data recovery is a vital component of DAPS. In [12], the authors used the average availability model to determine the maintenance interval period and form a maintenance program to reduce hardware equipment failures and prevent data loss through planned maintenance. Predictive emission monitoring system (PEMS) solves the problem of missing data from a software perspective [13].
Both CEMS and PEMS can be used for industrial pollutants emission monitoring. The PEMS system is software-based, low-cost, and uncomplicated maintenance. Reference [12] analyzed PEMS and CEMS, indicated advantages and disadvantages, respectively, and proved the financial advantages of PEMS with examples. PEMS is an expert system that takes process variables (e.g., ambient temperature, humidity, pressure, etc.) as input and predicts emissions values using a model trained on historical data [14]. There are various algorithms used to build a good and robust PEM model, such as machine learning [14–16] and deep learning [17–19]. Although PEMS has the characteristics of low cost and uncomplicated maintenance, it also has some problems. First of all, models trained based on deep learning or machine learning algorithms still lack generalization and interpretability, and changes in operating parameters or equipment may require retraining the model [20]. These problems prevent PEMS from being widely used in practice. Secondly, PEMS needs to use measured data to model, which usually comes from ICS. If the enterprise does not have an ICS, PEMS cannot be implemented. Finally, PEMS has not been recognized by the world, and some countries, such as China, have not promulgated relevant standards. The PEMS can be used as a supplement to the CEMS and the PEMS is responsible for monitoring pollutant emissions when the CEMS fails or the analyzer is maintained.
Stable, reliable, safe, and efficient communication technology is an important guarantee for the authenticity and effectiveness of emission data. In recent years, many scholars have studied the communication technology in the monitoring system and achieved gratifying results [21–24]. Reference [21] proposed a lossless data aggregation technique to reduce redundant information of industrial sensing and embed managerial and control data. Reference [22] provided a review of recent research on the fundamental limitations of integrated sensing and communication. Reference [23] combined machine learning with communication technology and used support vector machine to detect malicious network nodes. A monitoring area coverage optimization algorithm based on a perceptual mathematical model had been proposed in [24]. By calculating the motion scheme of the nodes, the aggregated nodes move to the area with low node density to achieve the maximum coverage of the monitoring area.
DAPS is an important part of CEMS. The main modules include acquisition, processing, storage, display, and communication. Through the analysis of the literature, we believe that the reliability, security, maintainability, and expansibility of the DAPS should be fully considered in the design. This paper introduces the DAPS for industrial pollutants monitoring, focuses on the design and implementation of the acquisition, storage, and communication functions, and evaluates the system performance through simulation experiments. The rest of the article is structured as follows. Section 2 presents the method used in this research. The main experimental results are presented in Section 3. Lastly, conclusions are presented in Section 4.
2. Materials and Methods
2.1. The Overall Architecture of DAPS
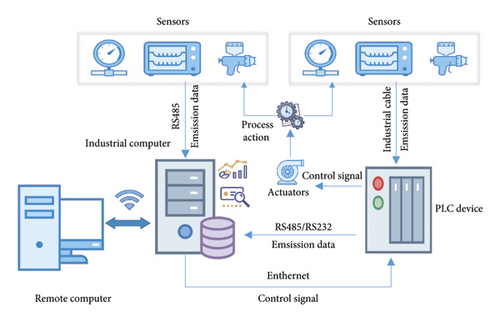
CEMS uses gas analyzers (O2, SO2, and NO), soot analyzers (PM), and auxiliary parameter analyzers (temperature, humidity, pressure, and flow rate) to extract emissions from combustion equipment and measure their values. There are two main output modes of the analyzer: current signal output and serial port output. All analyzers support current signal output, but some analyzers do not provide serial port communication due to cost constraints. To improve the usability of the system, two collection methods are proposed. In the first method, the analyzer is directly connected to the industrial personal computer (IPC) via the serial port. The second method is that the analyzer is connected to the PLC through the cable to transmit the current signal. The Analog-to-Digital Converter (ADC) converts the analog signal processed by the PLC into a digital signal and transmits it to the IPC through the serial port. The analog signal has the advantages of intuitive and easy to implement, while the disadvantages are weak anti-interference ability, short transmission distance, and a small amount of transmission data. Compared to the analog signal, the response speed of a serial port is slower, but it can transmit more data content each time, the transmission distance is longer, and the anti-interference ability is strong. In practical applications, the corresponding acquisition method can be selected according to the function of the analyzer and the situation on-site.
DAPS transmits control signals (blowback, analyzer span calibration, analyzer zero calibration, etc.) to the PLC, and the PLC controls the analyzer, auxiliary equipment, and pollution control facilities to perform corresponding processing actions. The IPC communicates with the RMC through the wireless network and performs data upload and other interactive operations. The high-level architecture of the proposed system is shown in Figure 1.
2.2. Data Acquisition System (DAS)
As discussed in the previous section, the DAS is responsible for receiving the emission data collected by the analyzer. For analyzers that do not support serial bus, PLC is used to receive the metered value, and then RS485 is used to transmit them to DAS. Analyzers that support serial port can directly transmit monitored data to DAS via RS485. For DAS, the two methods actually use RS485 to receive the actual measurement value; the difference is that the collected value comes from one slave or multiple slaves.
The schematic diagram of the acquisition operation and the related database structure is shown in Figure 2.
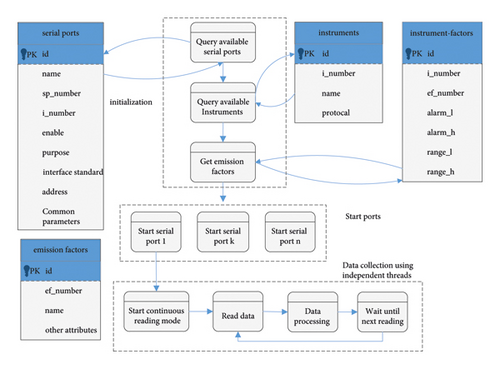
The first step in the acquisition process is initialization. Its main task is to confirm the serial ports information participating in the acquisition operation and the protocol and emission factor information corresponding to these serial ports. The second step is to create serial ports object and start them according to the information obtained from the initialization. Finally, the serial port management object executes the receiving work in its thread, reads out the data in the receiving buffer, processes the data according to the corresponding protocol class, and saves it in memory.
DAS uses the SerialPort Class provided by C# for serial port control. When the PLC or analyzer sends data to the serial port, the data received event is triggered, the data is stored in the buffer, and the delegate is called to perform data reception. The pseudocode of the data reception and process are depicted in Algorithms 1 and 2.
It is worth noting that this event is also triggered when the pin changes and the error received occurs, which may interrupt the currently executing receive operation to process these events. Because the transmission speed of the serial bus is much lower than the processing speed of the IPC, an appropriate delay should be added to the receiving process to ensure that the data can be received completely and correctly. The delay setting must consider the theoretical transmission time, the time it may consume to process pin changes and errors received, and the time it takes to switch events.
-
Algorithm 1: Receiving data using serial port.
-
\documentclass[11pt]{article}
-
\usepackage{CJK}
-
\usepackage[top=2cm, bottom=2cm, left=2cm, right=2cm]{geometry}
-
\usepackage{algorithm}
-
\usepackage{algorithmicx}
-
\usepackage{algpseudocode}
-
\usepackage{amsmath}
-
\usepackage{indentfirst}
-
\floatname{algorithm}{Algorithm}
-
\renewcommand{\algorithmicrequire}{\textbf{Input:}}
-
\renewcommand{\algorithmicensure}{\textbf{Output:}}
-
\begin{document}
-
\begin{CJK∗}{UTF8}{gkai}
-
\begin{algorithm}
-
\caption{Receiving Data using Serial Port}
-
\begin{algorithmic}[1] %每行显示行号
-
\Require $port:$SerialPort Object
-
\State $count \gets $ number of bytes of data in the receive buffer
-
\State delay
-
\While{number of bytes of receive buffer$ > $0}
-
\While{$(count < $number of bytes of receive buffer) \textbf{and} (number of bytes of receive buffer$ < $preset cache size)}
-
\State $count \gets $ number of bytes of receive buffer
-
\State $delay$
-
\EndWhile
-
\State store received data
-
\State process received data
-
\EndWhile
-
\end{algorithmic}
-
\end{algorithm}
-
\end{CJK∗}
-
\end{document}
-
Algorithm 2: Process received data.
-
\documentclass[11pt]{article}
-
\usepackage{CJK}
-
\usepackage[top=2cm, bottom=2cm, left=2cm, right=2cm]{geometry}
-
\usepackage{algorithm}
-
\usepackage{algorithmicx}
-
\usepackage{algpseudocode}
-
\usepackage{amsmath}
-
\usepackage{indentfirst}
-
\floatname{algorithm}{Algorithm}
-
\renewcommand{\algorithmicrequire}{\textbf{Input:}}
-
\renewcommand{\algorithmicensure}{\textbf{Output:}}
-
\begin{document}
-
\begin{CJK∗}{UTF8}{gkai}
-
\renewcommand{\thealgorithm}{2}
-
\begin{algorithm}
-
\caption{Process Received Data}
-
\begin{algorithmic}[1] %每行显示行号
-
\Require $enumber:$analyzer number ,$buf:$byte array containing received data
-
\State $factors \gets$ get factors by analyzer number
-
\State $length \gets buf[2]/2 $
-
If {$length \neq factors.Length$}
-
\State $return$
-
\EndIf
-
\State $index \gets 3 $
-
\For{$i=0$ to $length$}
-
\State $tempbuf \gets$ new byte[2]
-
\State $tempbuf \gets$ copy buf from index to index+2
-
\State $val \gets $ bytes array to unit16
-
\State $[rangeH,rangeL] \gets$ get range of current factor
-
\State $temp \gets (rangeH - rangeL) ∗ val / 65535 +rangeL;$
-
\State Update the dictionary used to store collected data
-
\EndFor
-
\end{algorithmic}
-
\end{algorithm}
-
\end{CJK∗}
-
\end{document}
2.3. Data Storage System (DSS)
The main task of DSS is to save the received real-time values to database and automatically generate periodic records. DAS obtains the measured value according to the sampling time and stores it in memory in the form of key value after filtering and processing. It should be noted that the data storage structure should be designed as a thread-safe (or lock mechanism) to prevent data errors or missing data caused by concurrent operations. DSS reads the data stored in the memory according to the storage interval and saves them to the database after processing (outlier, alarm, nitrogen oxide calculation, etc.). The scheduled thread is responsible for generating periodic records (minutes, hours, and days) and storing them in the corresponding table.
- (i)
Scalability: When a new monitoring item needs to be added, the design based on row storage must modify the basic structure of the related table and the corresponding processing program. These modifications are likely to bring new hidden dangers to the original stable system. The design using the key-value storage method is more adaptable to such changes and hardly needs to be changed.
- (ii)
Visibility: Row storage can directly observe the emission information at a certain time. Column storage puts the emission data collected at the same time into multiple rows and requires a column-to-row operation to observe all emission information. The latter is significantly inferior to the former in fetch time and visibility.
- (iii)
Storage space: Column storage stores timestamps and key values in each row, so there is redundancy, and the storage space occupied is relatively large.
Although the column storage-based method is weaker than the row-based storage method in terms of visibility and storage space, stability and scalability are more important for the proposed system.
2.4. Data Communication System (DCS)
In CEMS, the PLC is responsible for executing the control commands issued by DAPS. The communication mode between PLC and DCS can use RS485, Ethernet (IEEE802.3), and wireless network. For control processing, real-time performance and security are usually required. The slow transmission speed of RS485 obviously cannot meet this requirement. Compared with Ethernet, wireless network has poor anti-interference ability and security. Therefore, the proposed system chooses Ethernet to realize the control signal transmission between DCS and PLC.
- (i)
On Top of IP: Modbus/TCP, Ethernet/IP, FF SHE
- (ii)
On top of Ethernet: Ethernet Powerlink, Ethernet for Plant Automation
- (iii)
Modified Ethernet: PROFINET IO, EtherCAT
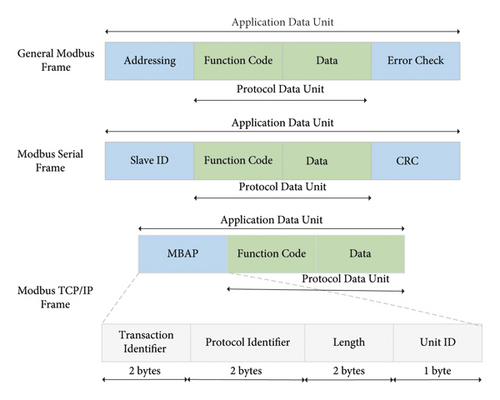
The control functions of the proposed system include timing switch, zero calibration, control of flue gas sampling probe temperature, and control of timing blowback. These control signals have low delivery time requirements, which can be met by using standard systems with TCP/IP communication channels without many problems. Therefore, on top of IP is chosen, and the communication protocol is Modbus/TCP. The Modbus protocol was published by Modicon in 1979 for PLC communication. At present, Modbus has become the industry standard for communication protocols in the industrial field and is now a commonly used connection method between industrial electronic devices. Figure 3 illustrates the structure of a Modbus frame. Transmission over the TCP/IP Ethernet, Modbus/TCP data frame includes three parts: message header, function code, and data. The header includes the following fields: the Transaction Identifier is used to identify the request/response frame. The Protocol Identifier is always set to 0, indicating that the Modbus protocol is used, and the Length field is used to identify the length of the subsequent data to be sent. Finally, the Unit Identification is used to specify the slave address.
Communication between DCS and RMC is different from communication between ADS and PLC. The main purpose of the latter is device control, so real-time and security requirements are high. The former takes data transmission as its main purpose and its main characteristics are low real-time requirements (>100 ms), long transmission distance, high delay, high tolerance to errors, and a relatively large amount of data transmitted. Compared to RTE, wireless network has the advantages of less cost, convenient installation and maintenance, strong diffraction ability, flexible networking structure, and large-scale coverage [26–29]. Based on the above analysis, this paper realizes data communication between DCS and RMC through a low-value wireless network.
Socket communication technology is a powerful engine that can realize real-time and bidirectional communication of various communication mechanisms. The application layer organizes the transmitted data into fragments, which are a block of bytes that contain request or response data. Figure 4 illustrates the structure of the fragment. The fragment consists of the following fields: a start field which marks the start of the frame; the length field, which indicates the size of the data; the data segment field, which contains request or response data; CRC field, which is used to detect or verify errors that may occur after data transmission; and an end field, which marks the end of the frame.

- (i)
Timeout retransmission: If no response is received within the specified time after the request is sent, it will be regarded as a timeout, and it will be resent after the timeout. If no response is received after the retransmission exceeds the specified number, it will be regarded as a communication failure and the communication will end.
- (ii)
Buffer management: The SocketAsyncEventArgs (SAEA) object is provided by.NET Framework and is mainly used to implement high-performance data sending and receiving processing. SAEA has a corresponding cache space in memory. When the number of SAEA objects gradually increases, the cache space of these SAEA objects will become larger and larger. They are not continuous in the system memory, causing many memory fragments, and these caches cannot be reused. When creating and destroying SAEA objects, this will cause extra CPU consumption and affect performance. By creating an SAEA pool, SAEA objects can be reused, and free SAEA objects are taken from the pool when needed and put back into the pool when not in use. Doing so can make reasonable use of memory for better performance.
- (iii)
Duplex communication: An SAEA object can only complete one task at a time, receive data, or send data. The monitoring system may have multiple data sending operations at the same time (send real-time data, send minute data), and one SAEA object certainly cannot meet the demand. Therefore, the client needs to cooperate with multiple SAEAs; at least one is used for receiving, and the others are used for sending.
The pseudocode of DCS and RMC communication is shown in Algorithms 3 and 4.
-
Algorithm 3: Send data to RMC.
-
\documentclass[11pt]{article}
-
\usepackage{CJK}
-
\usepackage[top=2cm, bottom=2cm, left=2cm, right=2cm]{geometry}
-
\usepackage{algorithm}
-
\usepackage{algorithmicx}
-
\usepackage{algpseudocode}
-
\usepackage{amsmath}
-
\usepackage{indentfirst}
-
\floatname{algorithm}{Algorithm}
-
\renewcommand{\algorithmicrequire}{\textbf{Input:}}
-
\renewcommand{\algorithmicensure}{\textbf{Output:}}
-
\begin{document}
-
\begin{CJK∗}{UTF8}{gkai}
-
\renewcommand{\thealgorithm}{3}
-
\begin{algorithm}
-
\caption{Send Data to RMC}
-
\begin{algorithmic}[1] %每行显示行号
-
\Require $client:$asynchronous socket client, $cp: $command parameter, a string contains the data to be passed,$reply:$need reply, $saphores:$global variables, dictionary structure used to store semaphores
-
\State $data \gets$ packs the cp to data package
-
\State send data to RMC using client
-
\If {$reply \neq True $}
-
\State $return$
-
\EndIf
-
\State $saphore \gets $ new AutoResetEvent
-
\State add saphore to saphores
-
\State waiting for saphore reset
-
\While{not reset}
-
\If {not exceeded number of retransmission}
-
\State retransmission
-
\EndIf
-
\EndWhile
-
\end{algorithmic}
-
\end{algorithm}
-
\end{CJK∗}
-
\end{document}
-
Algorithm 4: Recieve data from RMC.
-
\documentclass[11pt]{article}
-
\usepackage{CJK}
-
\usepackage[top=2cm, bottom=2cm, left=2cm, right=2cm]{geometry}
-
\usepackage{algorithm}
-
\usepackage{algorithmicx}
-
\usepackage{algpseudocode}
-
\usepackage{amsmath}
-
\usepackage{indentfirst}
-
\floatname{algorithm}{Algorithm}
-
\renewcommand{\algorithmicrequire}{\textbf{Input:}}
-
\renewcommand{\algorithmicensure}{\textbf{Output:}}
-
\begin{document}
-
\begin{CJK∗}{UTF8}{gkai}
-
\renewcommand{\thealgorithm}{4}
-
\begin{algorithm}
-
\caption{Recieve Data from RMC}
-
\begin{algorithmic}[1] %每行显示行号
-
\Require $data: $recieved data
-
\State $packet \gets$ parse data
-
\If {$packet∼error$}
-
\State $return$
-
\EndIf
-
\State $cn \gets$ get command no.
-
\State $cata \gets$ get command catagory throught cn
-
\If{$cata = 0$}
-
\State reset saphore
-
\EndIf
-
\If{$cata = 1$}
-
\State process request
-
\EndIf
-
\end{algorithmic}
-
\end{algorithm}
-
\end{CJK∗}
-
\end{document}
3. Results and Discussion
To analyze the performance of the proposed system, we conducted three sets of experiments: one set was used to evaluate the data acquisition operation reliability; the second set tested the system’s communication capabilities, and the last set by observing memory and CPU usage situation to evaluate the overall performance of the system.
3.1. Data Acquisition Test
DAS collects and records a set of real-time emission data according to the sampling interval. The collection items include oxygen content, flow rate, temperature, static pressure, humidity, PM concentration, NO concentration, and SO2 concentration. Data are collected through RS485 and stored in the SQL Server database, and the communication protocol is the Modbus RTU standard. The Modbus RTU protocol defines a simple protocol data unit independent of the lower communication layer, including address, function code, data, and CRC. On a Modbus RTU serial link, the address field contains only the slave address. The function code indicates what operation to perform, and the subsequent data of the function code is the request or response data field. The error check field is the result of the cyclic redundancy check calculation of the message data. Table 1 presents the Modbus RTU data frame.
| Address code | Function code | Data | CRC |
|---|---|---|---|
| 8 bits | 8 bits | N∗8 bits | 16 bits |
| Baud rate | Parity | Data bits | Stop bits | Number of bytes transmitted |
| 9600 bps | None | 8 | 1 | 20 bytes |
| Sampling interval | Delay time | Number of samples | ||
| 1 s | 100 ms | 1000 | ||
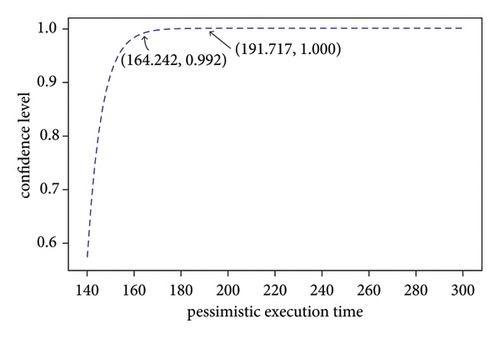
The experimental results (Figure 5) show that the estimated value of the DAS is less than or equal to 164.24 ms with 99% confidence and less than or equal to 191.7 ms with 100% confidence. Clearly, the latency of the DAS meets the specified time requirement of industrial pollutants monitoring system.
3.2. Data Transmission Test
| Bandwidth (Mbits/sec) | Transfer (Mbytes) | Time delay (ms) | Bytes transmitted | Packet length (bytes) | Handling time (ms) |
| 92.5 | 112 | 3 | 2 | 16 | 0.04 |
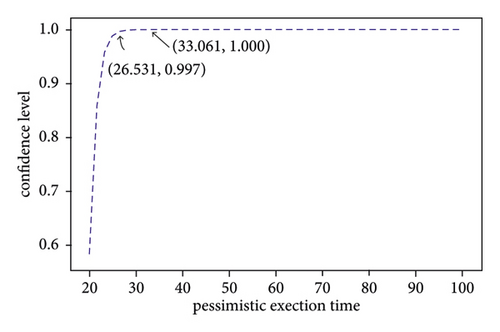
From the experimental results (Figure 6), it can be seen that the transmission time is less than or equal to 33 ms with 100% confidence. That can fully meet the low-speed class for control with delivery times around 100 ms.
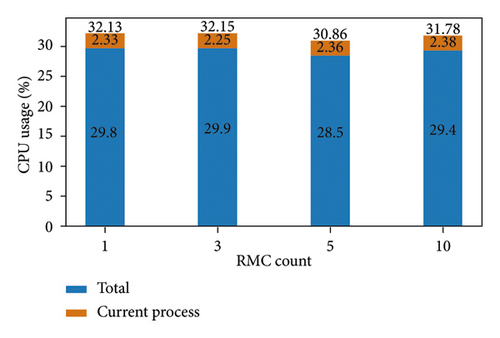
DTS communicates with RMC through a wireless network. DTS uploads periodic data according to the specified time interval. The sending interval for real-time data in this experiment is set to 5 s and the average data length is 387 bytes. To evaluate the performance of DTS in the case of multithreaded concurrency, we set up 1, 3, 5, and 10 RMCs, and DTS transmits the collected data to RMCs respectively. The experimental results are shown in Figure 7. We observed that the CPU occupancy rate of the current process is around 2.3%, which does not increase with the increase of transmitted threads. The experimental results show that the proposed DTS performs well.
3.3. Evaluation of Overall Performance
This experiment uses the performance calculator provided by DOTNET to run continuously for 14 hours with 15 s sample intervals to observe the usage of CPU, GC, and memory to evaluate the overall performance of the proposed system. The experimental results are shown in Figure 8.
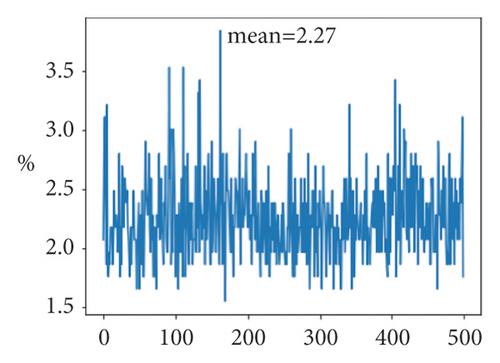

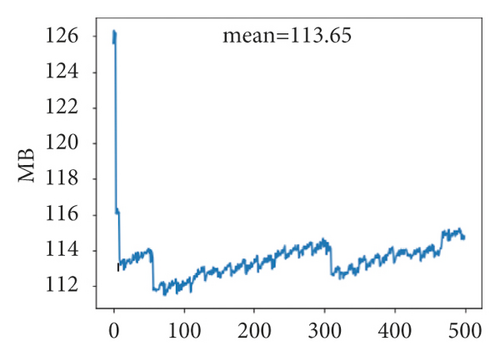
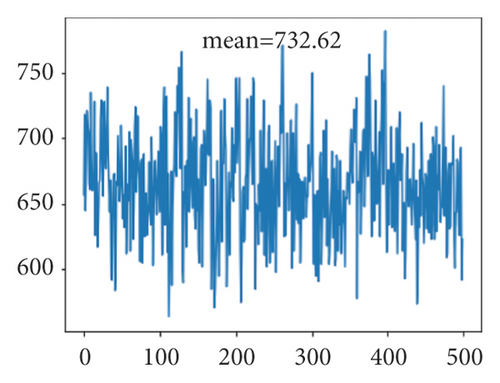

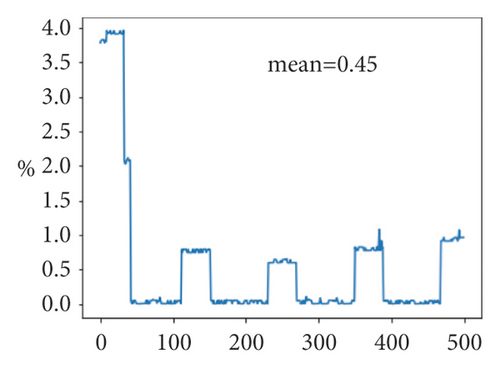
From Figure 8(a), we can see that the average CPU occupancy rate is 2.3%, the minimum value is 2.0%, and the maximum value is 3.2%. Most of the values are near the average value. The results show that the current system consumes less CPU time and remains relatively stable during operation. It can be seen from Figure 8(d) that the number of threads started by the current system is between 600 and 850, and the average is 732, which does not increase with time, which means that the system has no handle leak problem. The private bytes and pool paged bytes of this system are shown in Figures 8(b) and 8(e). The average number of private bytes is 32.7 MB and the range is 1 MB; the average number of pooled pages is 0.37 MB and the range is 0.04 MB. They are relatively stable throughout the operation period, and there are no rapid increase and decrease, which indicates that there is no memory leak problem. Figures 8(c) and 8(f) observe the memory usage from an overall perspective. Figure 8(c) indicates the current memory allocated in bytes on the garbage collection heaps. From the figure, the usage of the heap is reasonable, and no abnormal situation occurs. From Figure 8(f), it can be seen that the GC operation of DOTNET is not frequent, and the CPU time is also low. From the above usage of CPU, memory, and GC, it can be seen that the performance of the proposed system is better and there is no obvious performance bottleneck.
4. Conclusions
In this paper, we have proposed the design of DAPS for industrial pollutants monitoring. Usually, DAPS adopts a sampling interval higher than 1 s to obtain real-time emission information, so the analyzer or PLC can transmit the collected data to DAPS through the low-speed serial port. For control signal transmission, the real-time and stability of transmission are very important. The system chooses an improved Ethernet based on TCP/IP to realize the transmission of the control signal. DAPS uses the SQL Server database to save collected data and generates minute data, hourly data, and daily data regularly. At the same time, it communicates with the RMC through the wireless network and transmits the monitoring data to the RMCs. We tested the acquisition system and transmission system, respectively, and observed the usage of CPU and memory through the performance counter. The experiments confirmed that the proposed system can meet the design requirements and can perform acquisition and transmission stably and reliably.
However, the experiments and evaluations we do are based on simulated environments, which are quite different from real production environments. In the following research, we will apply the system to the actual production environment to further verify the performance of the system.
Conflicts of Interest
The authors declare that there are no conflicts of interest regarding the publication of this article.
Acknowledgments
This work was supported by “Innovation and entrepreneurship training program for College Students” Project (Operation no. 202110146018) and financed by Liaoning University of Science and Technology.
Open Research
Data Availability
The labeled dataset used to support the findings of this study is available from the corresponding author upon request.


