Effect of Welding Sequence and Constraint on the Residual Stress and Deformation of Thick Welded Butt Joint Made of Q345qD Steel
Abstract
In this paper, the residual stress and deformation of 32 mm thick welded butt joints made of Q345qD steel using gas metal arc welding (GMAW) are studied by using the thermoelastic-plastic finite element analysis (FEA). Element birth and death technique is used to simulate the deposition of the welding consumables, and the volume heat source in double-ellipsoidal distribution is used. An in-house python code is developed to enable the volume heat source movement. After the finite element model was verified against the experimental results, the effects of five welding sequences and two types of boundary constraint conditions on the residual stress and deformation of the thick welded butt joints were investigated. Results of the experimental measurement and the numerical simulation are in good agreement. The transverse residual stress and the vertical deformation can be significantly reduced by increasing the alternating times of the welding beads in two halves of the weld. The transverse residual stress and the vertical deformation can be reduced by 21.4% and 87.4%, respectively. In addition, the residual stress and deformation of the thick welded butt joints are significantly affected by the applied constraints. Increasing the constraint significantly increases the overall level of the transverse residual stress but can decrease the maximum longitudinal residual stress by 51.8% and the vertical deformation by 65.9%.
1. Introduction
Welding is a common connection method in the modern industry and is widely used in many engineering fields [1]. Most welding methods involve local heating and, thus, welding residual stress and deformation are generated for welded structures. Welding residual stress and deformation affect many mechanical properties of welded structures, such as the fatigue performance, stiffness, and compressive stability. In addition, welding deformation is unfavourable to the fabrication accuracy and dimensional stability of welded structures. Therefore, it is very necessary to minimize the welding residual stress and deformation by optimizing the welding process.
The welding residual stress and deformation of welded structures produced by using different welding processes can be measured through the experimental testing. However, usually only the stress data at several points of a welded structure will be measured because it is difficult to measure the residual stress distribution of the entire structure. Numerical methods can be used to simulate and optimize the welding process [2]. Compared to experimental testing, it is much more convenient and cost-effective to optimize the welding process via numerical simulation to reduce welding deformation and residual stress.
In the early 1970s, Ueda and Hibbit et al. [3, 4] proposed the thermoselastic-plastic finite element analysis (FEA) to simulate the welding temperature field, residual stress, and deformation. Nowadays, many scholars use finite element analyses to simulate the welding process so as to study the welding residual stress distribution and deformation of welded joints. For instance, Fu et al. [5] studied the effect of welding sequences on the welding residual stress distribution of tube sheet joints made of the 6061 thin-walled aluminum alloy. It was found that the optimized welding sequence can effectively reduce the residual stress of the welded joints investigated. Azad et al. [6] studied the influence of welding sequences on the deformation of ship deck and analysed the influence of eight different welding sequences on the deformation of six wire plates. Results show that different welding sequences affect both the shape and the size of the welding deformation. Zhu et al. [7] studied the influence of welding sequences on the deformation and transverse residual stress of fillet welded T-joints. Results show that, for the fillet welded T-joints, opposite-direction welding for the two welding beads leads to less angular deflection compared to the same-direction welding. The transverse residual stresses on the side of the first weld bead were lower according to the thermoelasto-plastic FEA results. Fahlström et al. [8] studied the influence of welding sequences on the welding deformation of ultrathin and ultrahigh strength steel U-beams. Results show that the welding direction has an insignificant influence on the welding deformation, and the welding deformation appears to mainly depend on the welding consumable volume. Carrizalez-Vazque and Pérez-Medina [9] simulated the welding process of butt joints made of DP600 steel thin plate considering different welding sequences. It was found that the welding residual stress and deformation caused by the segmented continuous welding were much smaller compared to the single-pass welding under the same heat input. Fu et al. [10] studied the influence of welding sequences on the residual stress and deformation of welded T-joints. Results show that the welding deformation generated in the single-side welding is larger compared to the double-side welding. Wang et al. [11] studied the influence of welding sequences on the residual stress distribution and deformation of Q345 steel H-beam butt joints. Results show that welding deformations of the welded joints are nearly the same for three different welding sequences, and the residual stress of the welded joints with the web welded before the flange is the smallest. Woo et al. [12] introduced an effective method to determine the optimal welding sequence leading to the minimum deformation of a general ship side panel. Results show that the optimal welding sequence can be determined by properly dividing the groups of the welding lines. Taraphdar et al. [13] analysed the influence of different welding sequences on the residual stress of equal double V-groove weld. Results show that the residual stress generated in weld bead alternative welding is smaller. In contrary, weld bead unidirectional welding causes a higher tensile residual stress level in the weld area. Yang et al. [14] studied the effect of three welding sequences on the residual stress of SA738Gr.B thick plate. It was found that the transverse stress of double-sided alternating symmetrical welding is 17% lower compared to the nonalternating welding.
In addition to the welding sequence, the constraint applied to the welded joints also has a significant effect on the welding residual stress and deformation of the joints. For instance, Kohandehghan and Serajzadeh [15] analysed the effect of the clamp and the welding sequences on the distribution and magnitude of welding residual stress of butt joints welded using the gas tungsten arc welding. It was found that the maximum transverse residual stress of the welded joint with the clamp is increased by about 76%, and the optimal welding sequence reduces the maximum longitudinal residual stress by about 44%. Aalami-aleagha and Eslampanah [16] studied the effect of four types of constraint on the welding residual stress and deformation of fillet welded T-joints. It was found that increasing mechanical constraints could reduce the deformation but increase the residual stress. The maximum residual stress increased as the constraint level increased. Deng et al. [17] analysed the influence of external constraints on the welding deformation of welded thin plate joints based on experimental and numerical results and discussed the mechanism of out-of-plane deformation of the investigated joints. Results show that external constraints can not only reduce the in-plane and out-of-plane deformation but also change the mode of the out-of-plane deformation. Besides, external constraints can reduce the welding deformation of thin plate welded joints to a very small level but cannot eliminate it completely. Venkatkumar and Ravindran [18] studied the effect of five constraint conditions on the welding residual stress and deformation of 316 stainless steel welded butt joints. It was found that the welding residual stress and deformation are significantly affected by the constraint conditions. In the case of complete constraint, the residual stress in the longitudinal direction is higher than that without any constraint. Liu and Zhang [19] analysed the influence of external constraint on the welding residual stress and compared the numerical results of the displacement constraint model to the multibody coupling model. It was found that the transverse residual stress at the welding centreline is significantly changed with the constraint increase, and the transverse residual stress obtained from the displacement constraint model is larger than that of the multibody coupling model. Heinze et al. [20] studied the effect of the transverse shrinkage constraint on the welding residual stress. It was found that, under the transverse shrinkage-constraint condition, the transverse residual stress near the weld reaches 400 MPa. Wang and Yi [21] analysed the influence of the welding sequence and the tack welding clamping constraint on the welding deformation. It was concluded that the optimized welding sequence can reduce the out-of-plane welding deformation by about 38%, while the clamping constraint can decrease by 56%. Tomków et al. [22] reported that using more tack welds leads to a larger angular deformation of AISI 441 steel fillet welded joints.
As mentioned above, many scholars have studied the influence of the welding sequences and boundary constraints on the welding residual stress and deformation of welded joints using numerical simulation, but there are few studies that focus on thick-plate welded butt joints made of Q345qD steel, which is normally used for constructing steel bridges in China. To optimize the welding process of thick-plate welded butt joints made of Q345qD steel, in this paper, the effects of five welding sequences and two types of constraint on the welding residual stress and deformation of thick-plate welded butt joints made of Q345qD steel are investigated through experimental testing and FEA.
2. Experiment
2.1. Materials and Welding Process
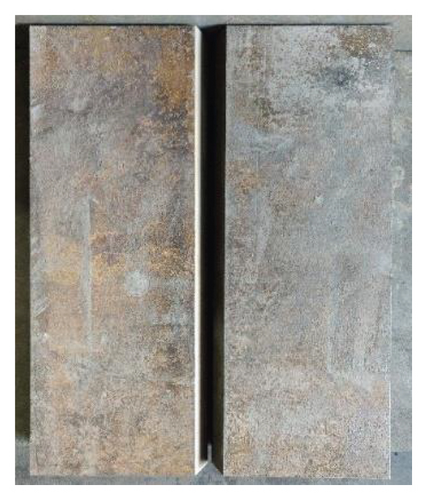
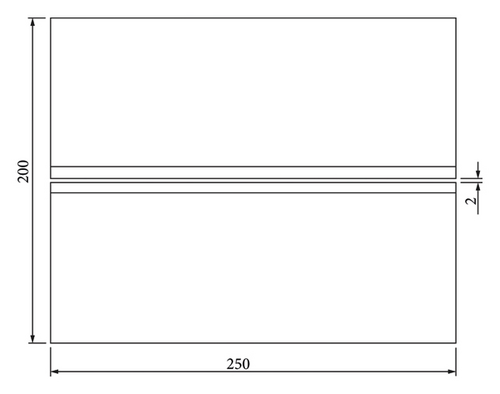
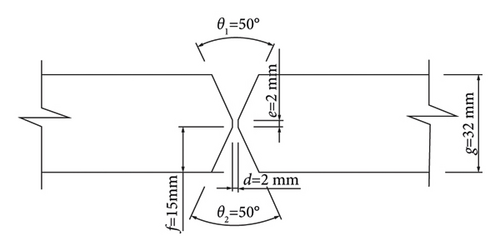
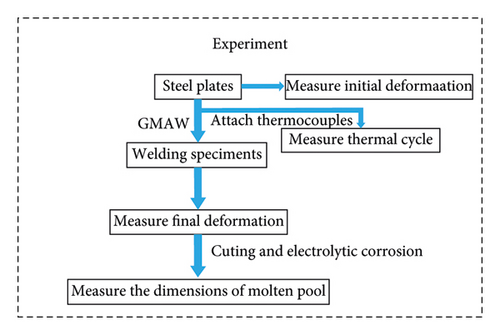
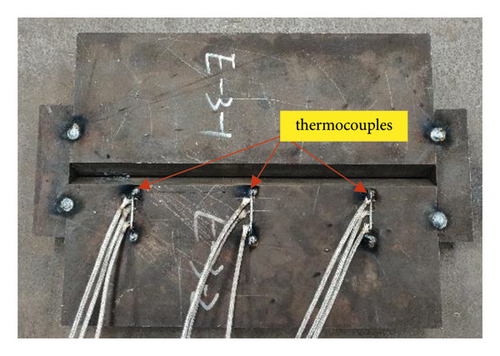
Three welded butt joint specimens were fabricated in this study. The material of the three specimens is Q345qD steel, and its chemical compositions provided by the manufacturer are shown in Table 1. The geometry and dimensions of three specimens are shown in Figures 1(a)–1(c), and the groove parameter values are shown in Figure 1(c). For the three specimens, manual gas metal arc welding (GMAW) was adopted using the type ER50-6 welding wire with the diameter of 1.2 mm. The chemical compositions of the ER50-6 welding wire provided by the manufacturer are shown in Table 2, and the shielding gas is CO2. The welding parameters including the current used for fabricating the three butt joint specimens are shown in Table 3. The cooling time between different weld beads is 120 s for the welded joints. The diagram of the experimental system is shown in Figure 2. Tack welding was used to facilitate welding the specimens as shown in Figure 3(a).
| C | Si | Mn | P | S | Cr | Ni | Cu |
|---|---|---|---|---|---|---|---|
| 0.20 | 0.55 | 1.60 | 0.025 | 0.025 | 0.30 | 0.30 | 0.40 |
| C | Mn | Si | P | S | Ni | Cr | Mo | V | Cu |
|---|---|---|---|---|---|---|---|---|---|
| 0.06 | 1.40 | 0.80 | 0.025 | 0.025 | 0.15 | 0.15 | 0.15 | 0.03 | 0.05 |
| Pass | Current I (A) | Voltage V (V) | Welding speed v (mm/s) | Heat input Q (kJ/mm) |
|---|---|---|---|---|
| 1–12 | 140 | 23 | 4 | 0.805 |
2.2. Thermal Cycle Measurement
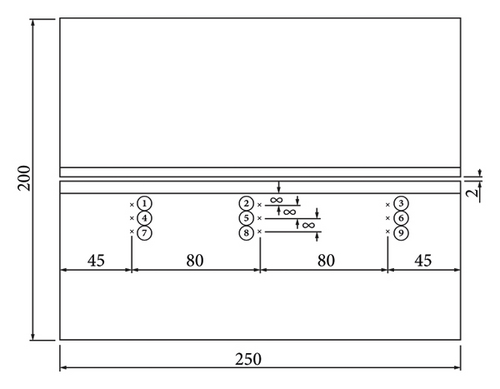
To monitor the thermal history during the welding process, nine K-type thermocouples (measurement range 0–1000°C with an accuracy of ±1°C) were attached to the upper surface of each welded specimen as shown in Figure 3(a). Positions of all measuring points are shown in Figure 3(b), and the other end of the thermocouples is connected to the R7100 paperless recorder (16 channels, accuracy 0.1°C) for data collection.
2.3. Deformation Measurement
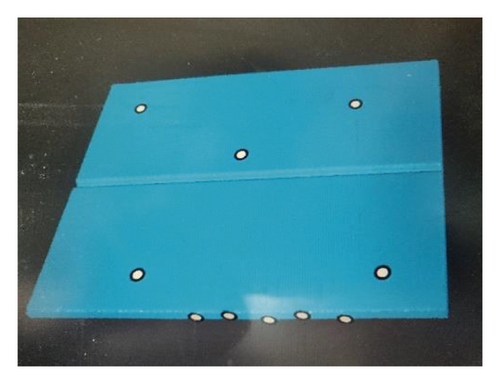
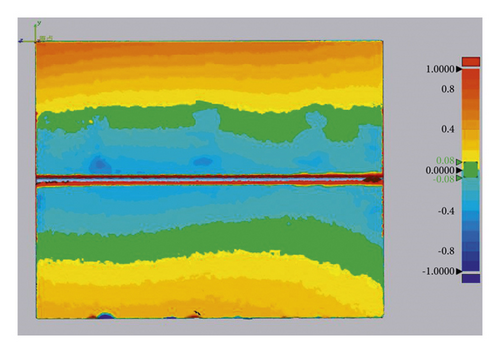
The deformation of each welded joint was measured by using a laser portable 3D scanner (FreeScan UE, with an accuracy of 0.02 mm). The two plates of each specimen with marked points were scanned before welding and the scanned model is displayed in the FreeScan UE software as shown in Figure 4. After welding, each specimen was scanned again. The scanned data is processed in the Geomagic Control 2014 and Geomagic Control X 2018 software to form the deformation cloud diagram shown in Figure 5. Finally, the extracted cloud point data is imported and plotted to show the angular deformation of each specimen.
3. Finite Element Modelling
3.1. Geometric Model and Mesh Generation
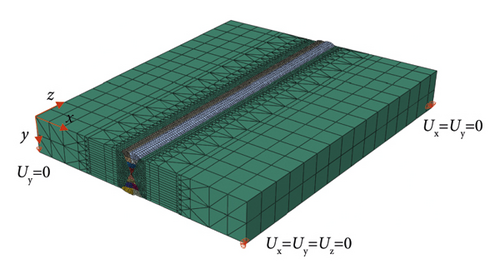
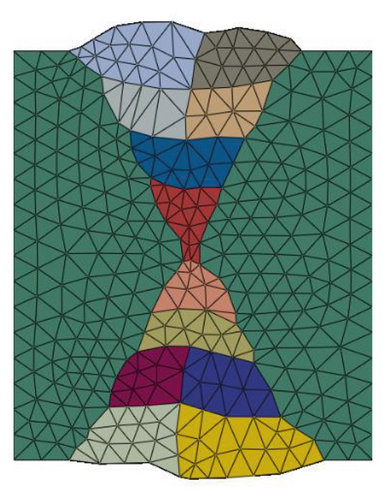
To ensure calculation accuracy and save calculation time, fine mesh was used around the weld bead (inclusive) and coarse mesh was used at other regions [23]. The mesh model is shown in Figure 6. The welding simulation adopts the thermoelastic-plastic sequential coupling method in which the thermal analysis is completed first and then the obtained temperature data is inputted into the mechanical analysis as thermal load. The element types for the thermal and the mechanical analysis are DC3D6 and C3D6, respectively, and the numbers of elements and nodes are 92067 and 49010, respectively.
3.2. Thermal Analysis
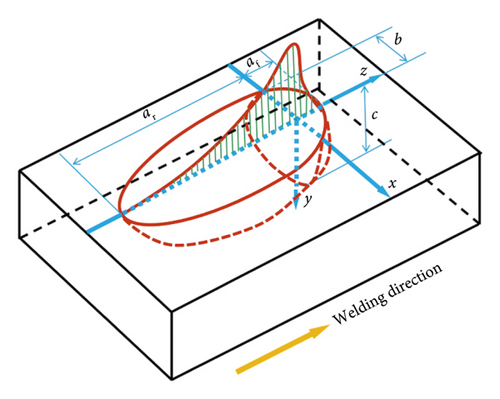
| b (mm) | C (mm) | af (mm) | ar (mm) |
|---|---|---|---|
| 5.25 | 5.90 | 2.00 | 5.00 |
3.3. Mechanical Analysis
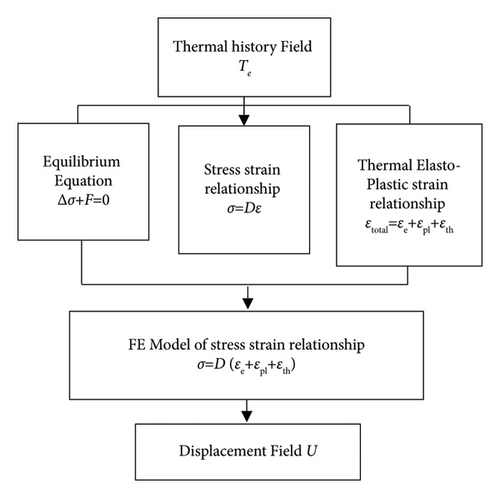
3.4. Steel Material Properties
The thermophysical properties of steel are related to temperature [30]; therefore, the material properties of Q345qD steel incorporating the effect of temperature must be used. The specific parameters [31] are shown in Table 5. In the FEA, the influence of the latent heat of phase transformation is considered. The latent heat of fusion is 270000 J/kg, and the steel is fused between the solid phase temperature of 1460°C and the liquid phase temperature of 1530°C [32].
| Temperature (°C) | Thermal conductivity (W/mm·K) | Density (kg/mm3) | Coefficient of expansion (×10−5/°C) | Elastic modulus (N/mm2) | Yield stress (N/mm2) | Specific heat capacity (J/kg·K) | Poisson’s ratio |
|---|---|---|---|---|---|---|---|
| 20 | 50 × 10−3 | 7850 × 10−9 | 1.10 | 2.05 × 10⁵ | 3.15 × 10² | 460 | 0.28 |
| 100 | 49 × 10−3 | 7850 × 10−9 | 1.05 | 1.97 × 10⁵ | 3.1 × 10² | 465 | 0.28 |
| 250 | 47 × 10−3 | 7850 × 10−9 | 1.22 | 1.87 × 10⁵ | 2.75 × 10² | 480 | 0.29 |
| 500 | 40 × 10−3 | 7850 × 10−9 | 1.39 | 1.5 × 10⁵ | 2.4 × 10² | 575 | 0.31 |
| 750 | 27 × 10−3 | 7850 × 10−9 | 1.48 | 7.0 × 10⁴ | 40 | 625 | 0.35 |
| 1000 | 30 × 10−3 | 7850 × 10−9 | 1.35 | 2.0 × 10⁴ | 20 | 675 | 0.40 |
| 1500 | 35 × 10−3 | 7850 × 10−9 | 1.33 | 1.0 × 10² | 1 | 650 | 0.45 |
| 2000 | 145 × 10−3 | 7850 × 10−9 | 1.31 | 1 | 1 | 820 | 0.49 |
3.5. Element Birth and Death Technique
In Abaqus software, the element birth and death technique is used to simulate the addition of deposited metal to the base metal [33, 34]. When adding materials to the base metal, related elements must be activated by using the element birth and death technique. All elements of the weld are disabled before welding, and elements for each welding pass will be activated in an appropriate loading step. In this study, an in-house Python code is developed to set the loading steps to apply element birth and death technique.
4. Verification of the Finite Element Model
4.1. Molten Pool
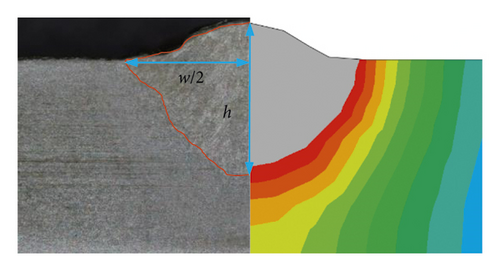
The three specimens were cut through at the middle perpendicular to the weld line and a digital tool measuring microscope with 2k resolution was used to measure the dimensions of the molten pool. According to the report of Tomków et al. [35], cold cracks were observed in the HAZ of wet welded high-strength low-alloy steel. For the three specimens fabricated in this study, no cracks were observed at the HAZ region. The experimental and numerically simulated molten pool contours are in good agreement as shown in Figure 9. The predicted and measured dimensions of the molten pool of one welded joint are shown in Table 6. The differences of the height and width of the molten pool between the FEA and experimental measurement are 1.02% and 5.62%, respectively. The above comparison shows that the thermal analysis model used for predicting the temperature field of the butt joint is reliable.
| h (mm) | w (mm) | |
|---|---|---|
| Experimental results | 5.90 | 10.50 |
| Numerical results | 5.84 | 9.91 |
| Error (%) | 1.02 | 5.62 |
4.2. Thermal Cycle
The thermal history at points 1, 2, 5 and 9 shown in Figure 2 is investigated to verify the FEA. Thermocouple at point 3 was damaged during testing, and, hence, no valid data was measured. The comparison between the experimental data and the numerical results is shown in Figures 10(a)–10(d). Temperature at the measured points was about 20°C before welding. Every time the heat source approaches, temperature at the measured point rises rapidly and then enters the cooling and heat dissipation stage. After all welding passes are completed, the whole weldment enters the cooling state, and temperature at the measured point continues decreasing to the room temperature. When the heat source of the weld bead 5 passes by, temperatures at the measured points 1 and 2 reach the peak value. The maximum temperatures at the measured point 1 obtained from the experimental test and FEA are 300°C and 311°C, respectively. At the measured point 2, temperatures measured and obtained from the FEA are identical and reach 313°C. It also can be observed that peak temperature is lower at the measured point further away from the molten pool, such as the measured point 9. The maximum temperature obtained from the FEA is 2909°C. Comparison in Figure 10 shows that the thermal analysis model used in this study is accurate and reliable.
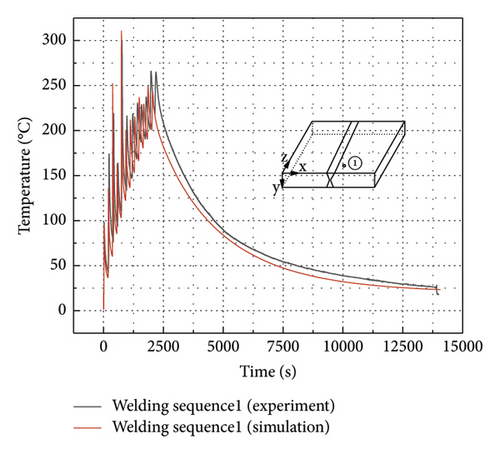
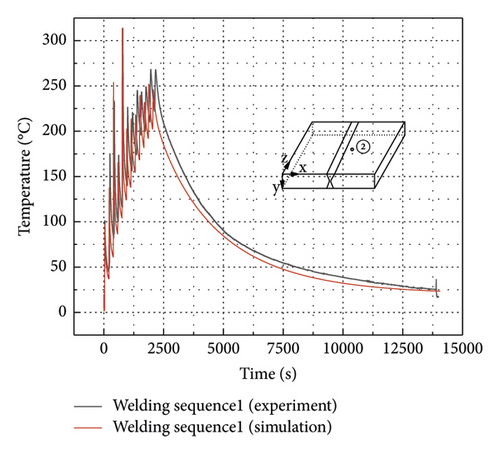
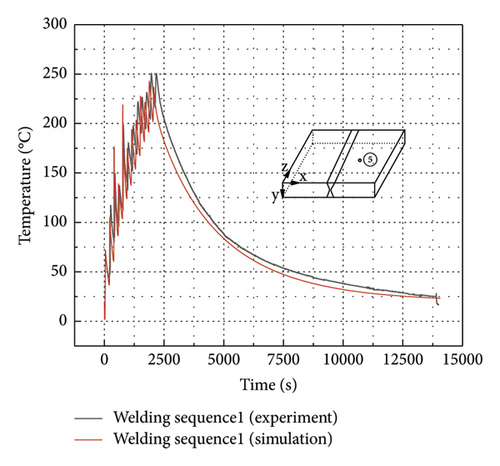
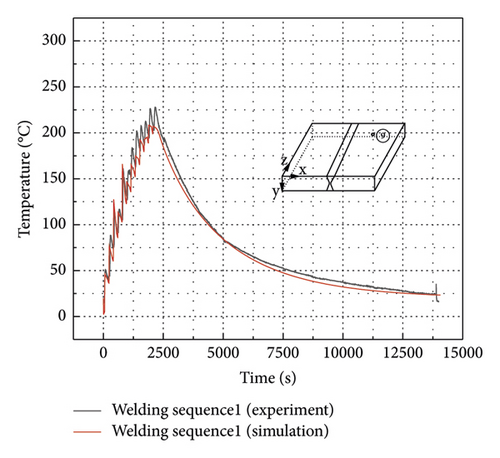
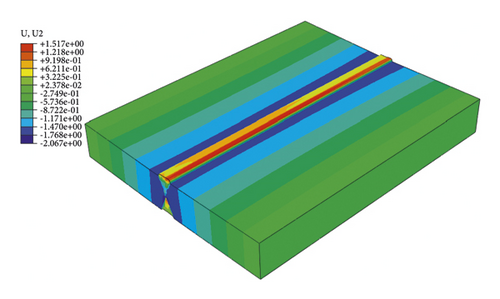
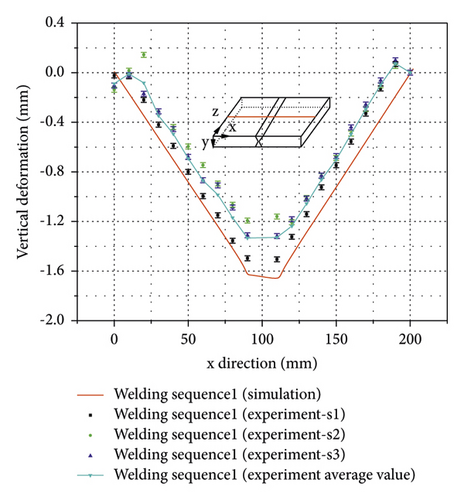
Figure 11 shows the cloud map distribution of the vertical deformation of specimen s1, and the deformation scaling factor is 1. Figure 12 shows the comparison of the vertical deformation of three specimens between the measured values and the results obtained from FEA. For the three specimens, the vertical deformations of 21 points on the red line highlighted in Figure 12 were measured. The red line is 120 mm offset from the welding start position and perpendicular to the weld line. From Figure 12, it can be found that the experimental measurement and the numerical simulation results are in good agreement. Deformation curves of the experimental testing and the FEA have the same trend, and the curves are in a V-shape. The measured maximum vertical deformations for three specimens are 1.51 mm, 1.21 mm, and 1.32 mm, respectively, and the FE result is 1.67 mm. The difference of the maximum vertical deformation between the FE and the experimental results is in the range of 10.60%–38.01%. It can be seen from Figure 12 that the measured vertical deformation curves of the three specimens are also discrete, and the maximum vertical deformation difference among three specimens is 24.79%. The above results show that the established mechanical analysis model could be reliable.
5. Finite Element Analysis
5.1. Welding Sequence and Constraint Scheme
- (1)
Unidirectional welding: 1, 2, 3, 4, 5, 6, 7, 8, 9, 10, 11, 12
- (2)
Unidirectional welding: 1, 7, 2, 8, 3, 9, 4, 10, 5, 11, 6, 12
- (3)
Reverse welding: 1, 2, 3, 4, 5, 6, 7, 8, 9, 10, 11, 12
- (4)
Reverse welding: 1, 7, 2, 8, 3, 9, 4, 10, 5, 11, 6, 12
- (5)
Unidirectional welding: 1, 2, 3, 7, 8, 10, 4, 5, 6, 9, 12, 11
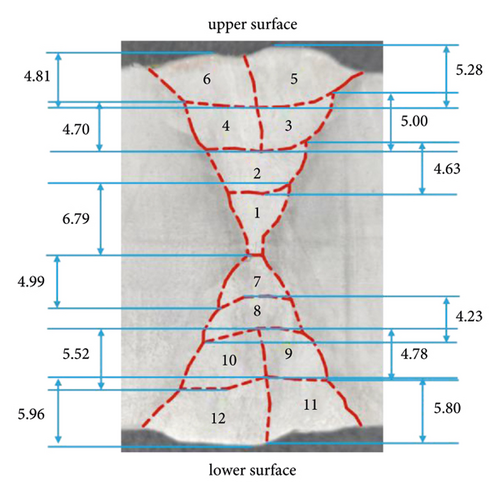
Unidirectional welding means that all weld beads are welded along the same direction, while reverse welding means that the adjacent weld beads are welded in the opposite direction. Three butt joint specimens were welded using the welding sequence 1.
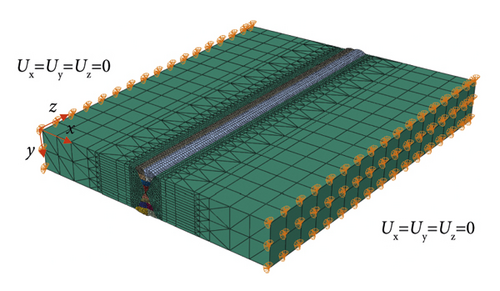
In the mechanical analysis, the two types of constraints applied to the finite element models are investigated. The first type of constraint is shown in Figure 6, in which six degrees of freedom of the three nodes at the corner of the finite element model are constrained. The first type of boundary condition applies minimal constraints to the welded butt joints to prevent rigid body movement [36]. Figure 14 shows the second type of constraint applied to the welded joints, in which all nodes on the two sides of the finite element model are constrained in three translate directions.
5.2. Influence of the Welding Sequence on the Residual Stress
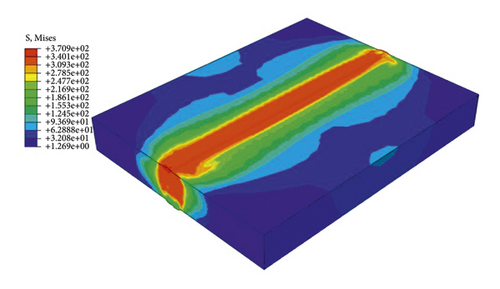
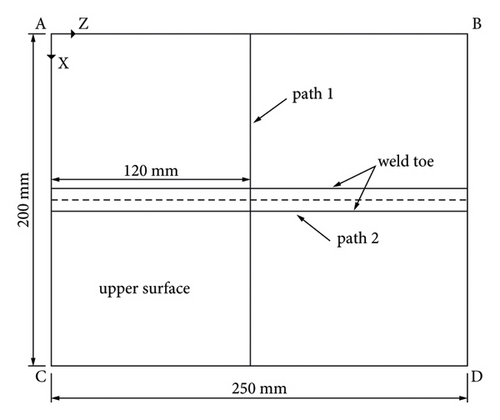
Figure 15 shows the residual stress (von-Mises) distribution of a specimen welded using the welding sequence 1. It can be found that the weldment and the heat affected zone (HAZ) are in the places where the residual stress is higher, with the maximum reaching 370.9 MPa. The residual stress away from the HAZ is smaller. Figure 16 shows two paths where the residual stress is investigated in this study. Path 2 refers to one weld toe and path 1 is perpendicular to the weld line. In this study, longitudinal and transverse directions refer to the welding direction and the one perpendicular to the weld, respectively.
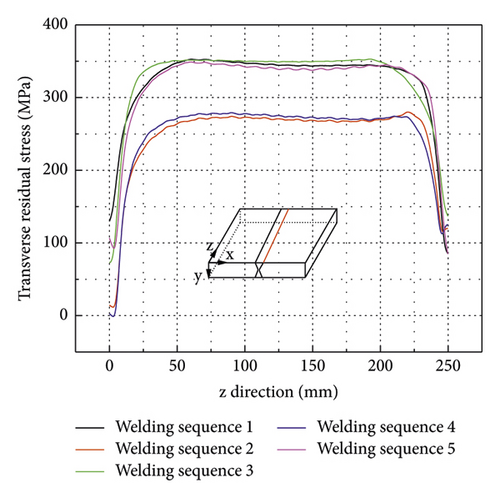
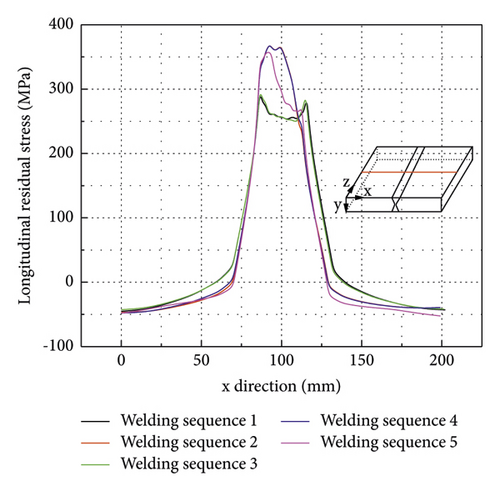
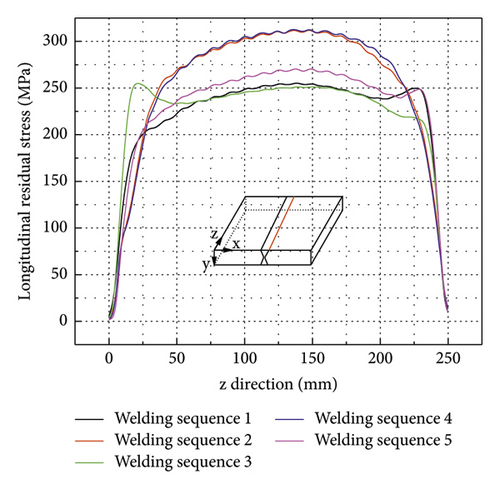
The residual stress curves are plotted for nodes on path 1 and path 2. As shown in Figures 17(a), 17(b), 18(a), and 18(b), the residual stress curves of welding sequences 1 and 3 are very close. Also, the residual stress curves of welding sequences 2 and 4 almost overlap with each other. Therefore, changing the welding direction of the weld bead has minor effect on the residual stress distribution.
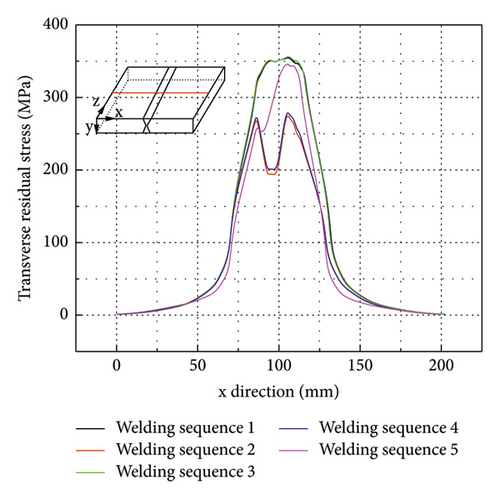
As shown in Figure 17(a), the transverse residual stress is the largest near the weld toe and decreases quickly as it gets away from the weldment. The transverse residual stress curves of welding sequences 2 and 4 are M-shaped, while the transverse residual stress curves of welding sequences 1, 3, and 5 are inverted U-shaped. Compared to welding sequence 1, the maximum transverse residual stress of the FE model using welding sequence 2 decreases from 355 MPa to 279 MPa, decreasing by about 21.4%, and the maximum transverse residual stress of the FE model using welding sequence 5 decreases from 355 MPa to 347 MPa, decreasing by about 2.3%. This means that alternating welding such as welding sequences 2 can significantly reduce the transverse residual stress at the weldment and the HAZ.
As shown in Figure 17(b), the transverse residual stress curves along the weld toe are flat in the middle segment (from −100 to 100 mm region). At the welding start and end regions (about 25 mm from the start and end point of the weldment), the transverse residual stress decreases rapidly. From the comparison of five curves, it can be concluded that alternating welding can significantly reduce the transverse residual stress at the weld toe in the middle segment. Compared to welding sequence 1, the maximum transverse residual stress at the weld toe using welding sequence 2 decreases from 353 MPa to 281 MPa, decreasing by about 20.4%, and the maximum transverse residual stress at the weld toe using welding sequence 5 decreases slightly, from 353 MPa to 349 MPa.
As shown in Figure 18(a), the longitudinal residual stress is the largest near the weld toe along path 1, and it decreases as it gets further away from the weldment and becomes compressive stress near the two edges of the FE models. The residual stress curves of welding sequences 1 and 3 are M-shaped, while the residual stress curves of welding sequences 2, 4, and 5 are inverted U-shaped. Compared to welding sequence 1, the maximum longitudinal residual stress of the FE model along path 1 using welding sequence 2 increases from 301 MPa to 368 MPa, increasing by about 22.3%, and the maximum longitudinal residual stress of the FE model along path 1 using welding sequence 5 increases from 301 MPa to 358 MPa, increasing by about 18.9%. It means that alternating welding such as welding sequence 2 can significantly increase the longitudinal residual stress at the weldment and the HAZ.
As shown in Figure 18(b), the longitudinal residual stress distribution along path 2 appears in an inverted U-shape. At the welding start and end regions, the longitudinal residual stress decreases rapidly to the minimum. Compared to welding sequence 1, the maximum longitudinal residual stress of the FE model along path 2 using welding sequence 2 increases from 255 MPa to 312 MPa, increasing by about 22.4%, and the maximum longitudinal residual stress of the FE model along path 2 using welding sequence 5 increases from 255 MPa to 271 MPa, increasing by about 6.3%. This means that alternating welding such as welding sequence 2 can significantly increase the maximum longitudinal residual stress at the weld toe.
From the above analyses, it can generally be concluded that alternating welding can reduce the transverse residual stress but increase the longitudinal residual stress at the weldment and the HAZ regions. In engineering practice, it is better to choose a reasonable welding process according to the design requirement. For example, if the welded butt joint was subjected to fatigue loading, it would be preferable to use alternating welding such as welding sequence 2. However, too many alternating welding times generally lead to a higher cost and lower productivity. Therefore, it is recommended to use the welding sequence with less alternating times.
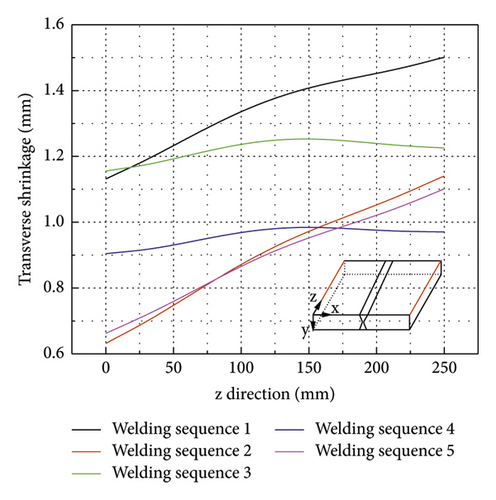
Influence of the welding sequence on the welding deformation: as shown in Figure 16, in this study, the transverse shrinkage is defined as the relative displacement between nodes on lines CD and AB, while the longitudinal shrinkage is defined as the relative displacement between nodes on lines AC and BD. The vertical deformation is defined as the Y-direction displacement of nodes on path 1 shown in Figure 16.
As shown in Figure 19, the transverse shrinkage (relative displacement between nodes on lines CD and AB in Figure 16) is larger on one side and smaller on the other due to the asymmetry constraints applied (refer to Figure 6). Transverse shrinkage curves of FE models using reverse welding sequence 3 and 4 are flatter compared to others. In addition, alternative welding such as welding sequences 2, 4, and 5 leads to a smaller transverse shrinkage. The transverse shrinkage of FE model using welding sequence 1 is between 1.13 and 1.5 mm, and the average is about 1.32 mm.
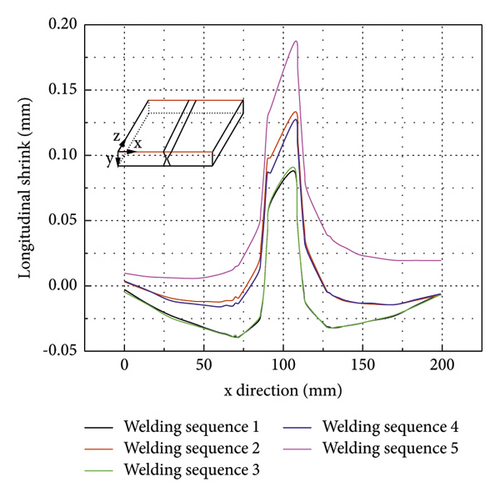
As shown in Figure 20, the longitudinal shrinkage (relative displacement between nodes on lines AC and BD in Figure 16) distribution of the welded thick plate is W-shaped. The longitudinal shrinkage at the weldment and the HAZ are much larger compared to other regions. Overall, the longitudinal shrinkage is much smaller compared to the transverse shrinkage using different welding sequences. The longitudinal shrinkage curves of welding sequences 1 and 3 are very close. Also, the longitudinal shrinkage curves of welding sequences 2 and 4 are almost overlapping with each other. Therefore, alternative welding has a minor effect on the longitudinal shrinkage distribution of the welded thick plate. Compared to others, welding sequence 1 produces the smallest longitudinal shrinkage and the maximum at the weldment is only 0.09 mm.
As shown in Figure 21, the vertical deformation curves of welding sequences 1 and 3 are V-shaped, while the vertical deformation curves of welding sequences 2, 4, and 5 are very flat. Compared to the FE model using welding sequence 1, the maximum vertical deformations of FE models using alternative welding sequences including welding sequences 2, 4, and 5 are much smaller. This implies that alternative welding can effectively reduce the vertical deformation of welded thick plate. For example, the maximum vertical deformation of FE model using welding sequence 5 decreases by about 87.4% compared to the one using welding sequence 1.
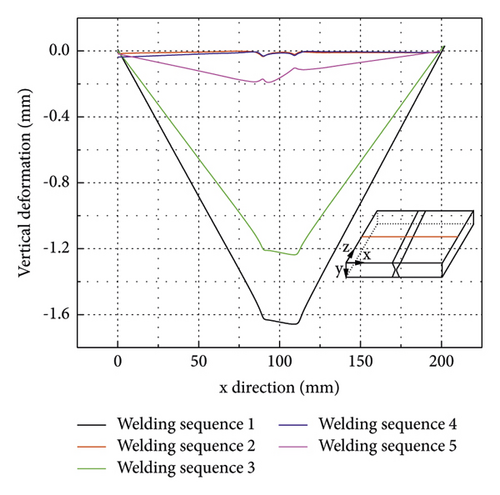
From the above analyses, it can be concluded that, generally, alternating welding can significantly reduce the transverse shrinkage and vertical deformation but increase the longitudinal shrinkage. As the magnitude of the longitudinal shrinkage is much smaller, it is recommended to use the alternative welding to control the transverse shrinkage and the vertical deformation of the welded thick butt joint. Considering the welding productivity and cost, it is recommended to use the alternative welding with limited alternating times such as welding sequence 5. Besides, changing welding direction of adjacent weld beads has less effect to the welding deformation compared to the welding sequences of different weld beads.
5.3. Influence of the Constraint Condition on the Residual Stress
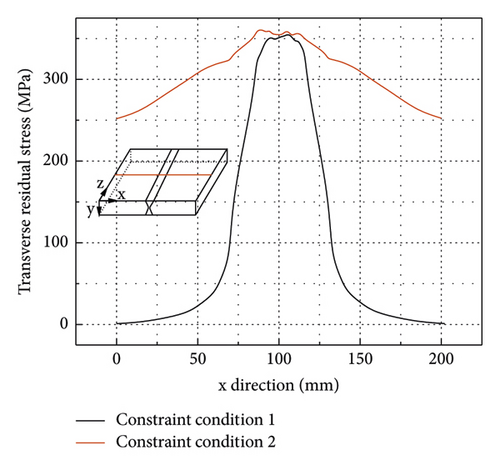
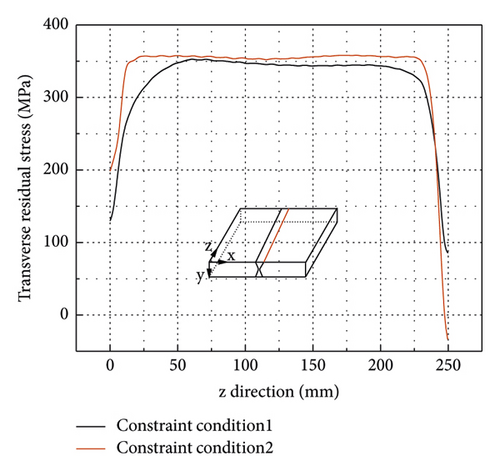
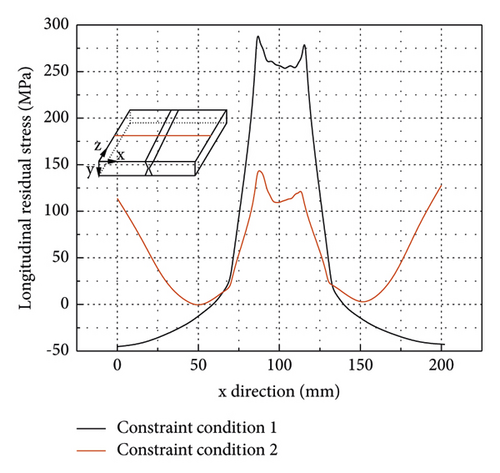
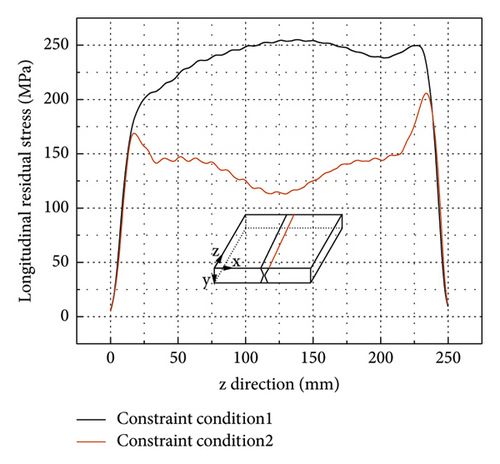
The welding residual stress and deformation of the welded thick butt joint using welding sequence 1 are analysed to investigate the effect of the constraint conditions. Constraint conditions 1 and 2 investigated in this study are shown in Figures 6 and 14, respectively. Figures 22(a) and 22(b) show the effects of the constraint conditions on the transverse residual stresses along path 1 and path 2 (weld toe) shown in Figure 16. It can be seen that constraint conditions have an ignorable effect on the maximum transverse residual stress at the weldment along path 1. Also, constraint conditions have a negligible effect on the transverse residual stress at the weld toe. It can be concluded that the constraint conditions have a negligible effect on the transverse residual stress at the weldment and the HAZ regions. However, a stronger constraint (constraint condition 2) applied to the welded thick butt joint can significantly reduce the longitudinal residual stress at the weldment and the HAZ regions as shown in Figures 23(a) and 23(b). For example, the maximum longitudinal residual stress for the FE model applying constraint condition 2 decreases from 289 MPa (for constraint condition 1) to 145 MPa at the weldment and the HAZ regions as shown in Figure 23(a).
Theoretically, constraint condition 2 can completely omit the transverse shrinkage of the welded thick butt joint because it forbids any movement of all nodes on lines AB and CD. The longitudinal shrinkage and vertical deformation of the welded thick butt joints analysed are shown in Figures 24 and 25, respectively. As shown in Figure 24, a stronger constraint (constraint condition 2) applied to the FE model can significantly increase the longitudinal shrinkage. However, the longitudinal shrinkage under constraint condition 2 is still very small and less than 0.37 mm.

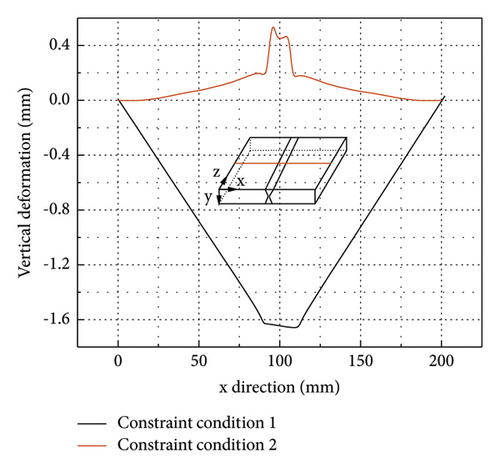
As shown in Figure 25, the vertical deformation curve under constraint condition 1 is V-shaped, while the curve under constraint condition 2 is inverted V-shaped. By increasing the constraints, the maximum vertical deformation decreased from 1.67 mm to 0.57 mm, decreasing by about 65.9%. Change of constraint conditions may not only affect the deformation magnitude but also change the deformation mode. However, a very strong constraint like constraint condition 2 cannot eliminate the vertical deformation at the weldment.
6. Conclusions
- (1)
Generally, alternating welding (welding sequences 2, 4, and 5 in this study) can reduce the transverse residual stress by 20.4% but increase the longitudinal residual stress by 22.4% at the weld toe for the thick welded butt joints investigated. In engineering practice, it is better to choose a reasonable welding process according to the design requirement. For example, if the welded butt joints were subjected to fatigue loading, it would be preferable to use alternating welding such as welding sequence 2. However, too many alternating welding times generally lead to a higher cost and lower productivity. Therefore, it is recommended to use the welding process with limited welding alternating times.
- (2)
Alternating welding can significantly reduce the transverse shrinkage by about 24%–46.9% (comparison between results of welding sequences 1 and 2 in Figure 19) and the vertical deformation by 87.4%; however, it can increase the longitudinal shrinkage. As the magnitude of the longitudinal shrinkage is much smaller, it is recommended to use alternative welding to control the transverse shrinkage and the vertical deformation of the welded thick butt joint. Considering the welding productivity and cost, it is recommended to use alternative welding with limited alternating times.
- (3)
Generally, reverse welding, that is, changing the welding direction of adjacent weld beads, has a negligible effect on the transverse residual stress, longitudinal residual stress, and longitudinal shrinkage of the thick welded butt joints investigated. However, it may significantly reduce the transverse shrinkage and the vertical deformation.
- (4)
A strong boundary constraint such as the one shown in Figure 14 may slightly increase the transverse residual stress but significantly reduce the longitudinal stress at the weld toe for the thick welded butt joints investigated.
- (5)
The strong boundary constraint shown in Figure 14 can completely omit the transverse shrinkage for the thick welded butt joint investigated. Meanwhile, the strong constraint can minimize the longitudinal shrinkage and the vertical deformation.
Conflicts of Interest
The authors declare that they have no conflicts of interest.
Acknowledgments
The authors appreciate the financial support provided by the National Natural Science Foundation of China (no. 51908437), the Fundamental Research Funds for the Central Universities of China (WUT: 2019IVA024 and 2020IVB0090), and the research fund provided by China Construction Third Bureau First Engineering CO. LTD.
Open Research
Data Availability
The data used to support the findings of this study can be obtained from the corresponding author upon request.


