Single-Object-Based Region Growth: Key Area Localization Model for Remote Sensing Image Scene Classification
Abstract
Remote sensing image scene classification is a challenging task due to the large differences within the same classes and a large number of similar scenes among different classes. To tackle this problem, this paper proposes a single-object-based region growth algorithm to effectively localize the most key area in the whole image, so as to generate more discriminative local fine-grained features for the image scene. Concurrently, a local-global two-branch network is designed to utilize the features of the images from multiple perspectives, respectively. Specially, the global branch extracts global features (such as contour, texture) from the whole image, and local branch extracts more local features from the local key area. Finally, the global and local classification scores are integrated to make the final decision. Experiments are performed on three publicly available data sets, and the results show that this method can achieve higher accuracy compared to most existing state-of-the-art methods.
1. Introduction
With the continuous progress of remote sensing technology and the upgrading of imaging equipment, acquisition of high-resolution remote sensing images is easier than before. High-resolution remote sensing images contain rich scene semantic information, which is beneficial to the interpretation of remote sensing images. As an important means of remote sensing image interpretation, remote sensing image scene classification has received increasingly attention in recent years. However, the complex background and a large number of irrelevant scene information in remote sensing images pose great challenges to the classification.
Feature extraction has always been a research hotspot as the core problem of image classification. However, the large intraclass differences and subtle interclass differences in remote sensing images make it difficult to extract discriminating features. A key point to solving the above problem is to find the local subtle differences, and most existing methods first locate local regions and then extract local features for classification. In order to accurately locate local key areas, image patches containing objects need to be generated first. Selective search [1] combines the advantages of exhaustive search and segmentation and can search and capture all possible object regions in a variety of ways. Zhang et al. [2] used selective search to generate part proposals, and the average recall of parts is 95% on the bird data set. However, this unsupervised method requires additional annotation, which is time-consuming and labor-consuming. To address this problem, researchers proposed weak supervised learning without labeled information. Zhang et al. [3] used CNN to generate multiscale part proposals (all part proposals are clustered) and then calculate an importance score of each part cluster, and those parts with high scores are selected as the useful areas. Despite the computational cost savings, a number of proposals lead to overlap in the selected parts.
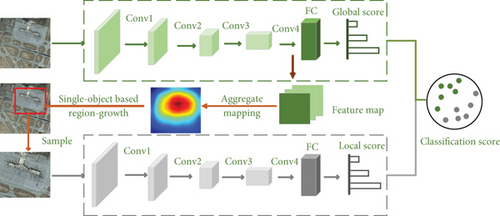
To tackle the above issues, we present a single-object-based region growth algorithm to locate the most key areas. Meanwhile, a global-local two-branch model as shown in Figure 1 is designed to extract discrimination features from the whole image and local key areas, respectively. Finally, the classification scores of the two branches are fused to complete the final decision. Experimental results on the RSSCN7, AID, and NWPU-RESISC45 data sets show that the proposed method has excellent performance in terms of accuracy.
- (1)
A single-object-based region growth algorithm is proposed, which can effectively discover and localize the most important areas. More importantly, the method does not require additional annotation information during training and testing
- (2)
Unlike the traditional region growth algorithm, this method treats the entire image as a region and requires only one seed point. Furthermore, the saliency value size of the pixels around the seed is taken as a determination condition to incorporate the new regions
- (3)
Most existing methods ignore the connection between global and local. This paper designs a two-branch model that combines the global and local scores to promote each other
The remainder of this paper is covered as below. Section 2 briefly describes the related work of remote sensing image scene classification and salient object detection. In Section 3, the proposed method is described in detail. In Section 4, the data sets, experimental results and analysis are presented. Section 5 summarizes this paper.
2. Related Work
2.1. Remote Sensing Image Scene Classification
Traditional classification methods rely on some manually designed low-level feature descriptors, such as texture descriptors [4], histograms [5], and scale-invariant feature transform (SIFT) [6]. However, there is an insurmountable semantic divide between low-level and high-level features, which makes classification results unsatisfactory. To solve this problem, the bag-of-visual-words (BoVW) model [7] is proposed to extract more discriminating mid-level features. BoVW technology can integrate local features of an image into a global representation by clustering, encoding, etc. On this basis, Chen and Tian [8] proposed a pyramid of spatial relations (PSR) model for the land cover classification. The PSR model adopts a new concept of spatial relation to merge both absolute and relative spatial information into the BoVW, which can effectively deal with the problems of translation and rotation in remote sensing image. Although these methods have achieved good results, handcrafted features cannot effectively deal with various challenges in remote sensing image classification.
In recent years, the convolutional neural network (CNN) has been widely used in computer vision tasks, such as image classification [9], target detection [10], and object tracking [11]. Different from the features designed manually, the CNN model can learn more discriminatory deep features from images. Consequently, CNN-based methods have gradually become the mainstream of remote sensing image scene classification. Zhao et al. [12] proposed an object-based deep learning method, deep features are computed from the fixed receptive window using a five-layer CNN, and features are extracted using three different segmentation scales. In order to extract more hidden information from the features of different layers, Li et al. [13] proposed a multiscale feature fusion strategy for remote sensing image scene classification. Xue et al. [14] used three popular CNNs to extract features and performed classification after fusion of these features.
2.2. Salient Object Detection
As one of the important preprocessing methods in computer vision tasks, saliency object detection is widely used in video object segmentation [15], scene classification [16], and object detection [17], etc.
Early methods mainly detected salient objects by manually extracting features. For example, Itti et al. [18] extracted color, orientation, and brightness features of the image under different scales to calculate the saliency map. Yan et al. [19] treated the product of global color contrast with the central prior as saliency under a single scale. With the development of deep learning, the combination of salient object detection and the convolutional neural network has also achieved great success. Li and Yu [20] used the multiscale features extracted by the convolutional neural network to calculate the saliency map. Zhang et al. [21] proposed a multilayer feature aggregation network, which can integrate multilevel features into multiple resolutions. Then, combine these feature maps at each resolution and predict the saliency map with the combined features. Moreover, different from the multiscale feature fusion approach, Wei et al. [22] proposed selective convolutional descriptor aggregation (SCDA) for salient object detection. First, the output feature map of the last convolutional layer is aggregated in the depth direction. Then, multiple object regions are found based on a threshold segmentation method and finally retained the largest connected region to locate the local image.
For remote sensing images, it is crucial to find the unique region from complex scenes. Motivated by the idea of convolution-descriptor aggregation in SCDA, we propose a single-object-based region growth to find the boundary of key area, which can be used to sample local images.
3. Proposed Method
In this section, we first introduce the important components of the baseline network. Then, the extraction process of the local key area is described in detail. Finally, the global-local two-branch network shown in Figure 1 is designed to extract the global and local features separately.
Deep convolutional neural networks have powerful learning capabilities, but their performance degrade substantially with increasing depth. The proposal of the residual network [23] solves this problem to some extent and achieves marvelous performance in image recognition. This experiment mainly uses the 18-layers residual network (ResNet18) as the baseline network.
3.1. Baseline
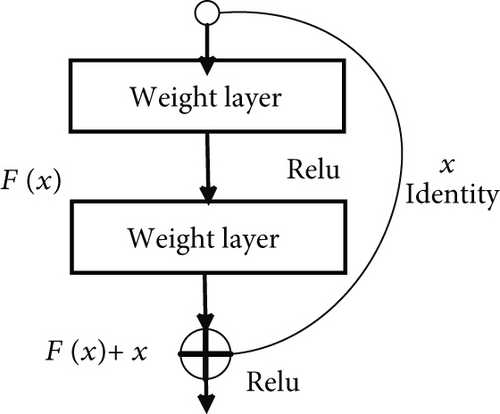

As the network deepens, when the residual F approximates 0 infinitely, the residual block is equivalent to complete a simple identity mapping, which will not degrade network performance.
3.2. Extract Local Key Areas
3.2.1. Aggregate Mapping
3.2.2. Single-Object-Based Region Growth Algorithm
If E[x1 : x2, y1 : y2] > T × E[H, W], the region [x1 : x2, y1 : y2] is considered to be the most key area for image recognition. T is a hyperparameter in the range of (0, 1]. In order to find the most critical region quickly and accurately, the single-object-based region growth algorithm is proposed, which mainly consists of the following steps:
Step 1. initialization. Firstly, find the coordinate of the maximum value in and take it as the starting position[xs, ys]. Then, the initial boundary of the salient region can be marked as [xs, xd, ys, yd], where xd = xs + 1, yd = ys + 1
Step 2. single-object-based region growth. The initial boundary is continuously expanded until reaches the termination condition. Some implementation details are shown in Algorithm 1.
Step 3. scale the boundary. Scaling the values of the boundary to range [0, 1]
-
Algorithm 1: Single-object-based region growth
-
Input:
-
1: For example: xs = 0 and ys = 0
-
2: xd = xs + 1, yd = ys + 1
-
3: Ts = E[xs, xd, ys, yd]/E[H, W]
-
4: while Ts < T then
-
5: if E[xs, xd + 1, ys, yd] > E[xs, xd, ys, yd + 1] do
-
6: xd = xd + 1
-
7: else
-
8: yd = yd + 1
-
9: Ts = E[xs, xd, ys, yd]/E[H, W]
-
10: return [xs, xd, ys, yd]
3.2.3. Local Area Sampling
3.3. Visualization of Single-Object-Based Region Growth
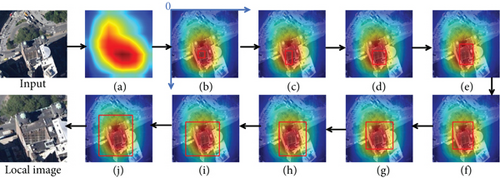
The whole process of single-object-based region growth is shown in Figure 3, which can help understand the Algorithm 1. For convenience, the image size is set to 10 × 10 and the hyperparameter T is set to 0.5.
As shown in Figure 3, the class of the input image is the industrial region. The initialized bounding box is shown in Figure 3(b), and the result is [6, 4, 7, 5]. Then, in order to rapidly increase the total saliency value within the region, the bounding box expands one step in a specific direction each time after discrimination. After the region stops growing, the bounding box as shown in Figure 3(j) is [3, 2, 9, 7]. The final result can be seen that a large amount of background noise in the global image is eliminated, and the local image almost contains the key object.
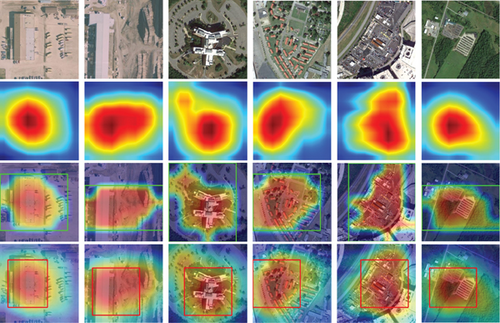
Further, to more intuitively evaluate the effect of local regional localization, the method in this paper is compared with SCDA, and the result is shown in Figure 4. It is obvious from the results that the single-object-based region growth can locate key areas more precisely, and the obtained local regions contain less background noise.
3.4. Classification
4. Experiments
4.1. Data Sets and Evaluation Metric
In order to verify the effectiveness of the proposed method, experiments are carried out on three public remote sensing image data sets. The basic information of each data set is listed in Table 1.
| Data sets | Image size | Spatial resolution (m) | Total | Classes |
|---|---|---|---|---|
| RSSCN7 | 400 × 400 | — | 2800 | 7 |
| AID | 600 × 600 | 0.5-8 | 10000 | 30 |
| NWPU-RESISC45 | 256 × 256 | 0.2-30 | 31500 | 45 |
RSSCN7 data set has 7 categories, including grass land, forest, farm land, parking lot, residential region, industrial region, and river and lake. These images come from different seasons and weather changes and are sampled with different scales.
Aerial image data (AID) set split into 30 categories, that is, airport, bare land, baseball field, beach, bridge, center, church, commercial, dense residential, desert, farmland, forest, industrial, meadow, medium residential, mountain, park, parking, playground, pond, port, railway station, resort, river, school, sparse residential, square, stadium, storage tanks, and viaduct. There are a lot of similar features between these images.
The NWPU-RESISC45 data set is grouped into 45 classes, including airplane, airport, baseball diamond, basketball court, beach, bridge, chaparral, church, circular farmland, cloud, commercial area, dense residential, desert, forest, freeway, golf course, ground track field, harbor, industrial area, intersection, island, lake, meadow, medium residential, mobile home park, mountain, overpass, palace, parking lot, railway, railway station, rectangular farmland, river, roundabout, runway, sea ice, ship, snow berg, sparse residential, stadium, storage tank, tennis court, terrace, thermal power station, and wetland. The NWPU-RESISC45 data set is currently the largest data set with small class differences and large intraclass differences.
4.2. Experiment Setup
To facilitate comparison with other methods, two different training ratios are used for each data set. For the RSSCN7 data set and AID, the training ratios are fixed at 20% and 50%. For the NWPU-RESISC45 data set, the ratios are fixed at 10% and 20%. During training, two different methods are used to process the input images. For the global branch, the input images are resized to 224 × 224 and flipped horizontally at random. For the local branch, the input images are resized to 448 × 448. Besides, a total of 50 epochs are trained in this experiment. In the training process, Adam algorithm is selected as the optimizer, the initial learning rate is set to 1e − 4, and the attenuation is 0.1 every 20 epochs.
For reliable experimental results, we performed five experiments based on the RSSCN7, AID, and NWPU-RESISC45 data sets and calculate the mean value and standard deviation of the experimental results. All experiments are conducted on the open-source machine learning library PyTorch [24], and a GTX 1060Ti GPU is used for acceleration.
4.3. Experimental Results and Analysis
4.3.1. RSSCN7 Data Set
In order to verify the performance of the proposed method and find a satisfactory hyperparameter T, a great quantity of experiments based on this method are performed on the RSSCN7 data set. The results are shown in Table 2.
| Methods | 20% training | 50% training | ||||
|---|---|---|---|---|---|---|
| 0.4 | 0.5 | 0.6 | 0.4 | 0.5 | 0.6 | |
| ResNet18 | 92.30 | 92.30 | 92.30 | 94.90 | 94.90 | 94.90 |
| Ours | 93.79 | 94.13 | 93.90 | 96.43 | 96.63 | 96.50 |
According to the results, compared with ResNet18 model, the accuracy of the proposed method is significantly improved. Meanwhile, a large number of experiments show that the size of the local region will directly affect the classification results. As can be seen from Table 2, when the threshold T is set to 0.5, the results are the best regardless of the training ratio. Therefore, in all experiments below, T is set to 0.5 by default.
Further, to analyze the spatial and temporal complexity of the methods presented in this paper, the size and test time of the model are calculated. It can be seen from the results in Table 3 that although the model size is twice as big as ResNet18, the test time is less than twice cost of ResNet18. Thus, the computational complexity of the single-object-based region growth algorithm is relatively low.
| Methods | Model size | Test time (s) |
|---|---|---|
| ResNet18 | 89 MB | 0.0097 |
| Ours | 89 × 2 MB | 0.0151 |
In addition, the overall accuracy is compared with other ten methods. From Table 4, the classification overall accuracy of the proposed method has been significantly improved regardless of the training ratio. Compared with EfficientNetB3-attn [25], the classification accuracy of this method is improved by about 0.83% under the training ratio of 20% and 0.33% under the training ratio of 50%.
| Methods | Training ratio | Training ratio |
|---|---|---|
| 20% | 50% | |
| CaffeNet [26] | 85.57 ± 0.95 | 88.25 ± 0.62 |
| VGG-VD-16 [26] | 83.98 ± 0.87 | 87.18 ± 0.94 |
| ResNet50-TEX-Net-LF [27] | 92.45 ± 0.45 | 94.00 ± 0.57 |
| VGG-M-TEX-Net-EF-6 [27] | 86.77 ± 0.76 | 89.61 ± 0.54 |
| VGG-M-TEX-Net-EF-6 [27] | 85.65 ± 0.79 | 88.70 ± 0.78 |
| Fine-tune MobileNet V2 [28] | 89.04 ± 0.17 | 92.46 ± 0.66 |
| SE-MDPMNet [28] | 92.65 ± 0.13 | 94.71 ± 0.15 |
| Contourlet CNN [29] | — | 95.54 ± 0.71 |
| Dual Attention-Aware Net [30] | 91.07 ± 0.65 | 93.25 ± 0.28 |
| EfficientNetB3-attn [25] | 93.30 ± 0.19 | 96.17 ± 0.23 |
| Ours | 94.13 ± 0.06 | 96.50 ± 0.11 |
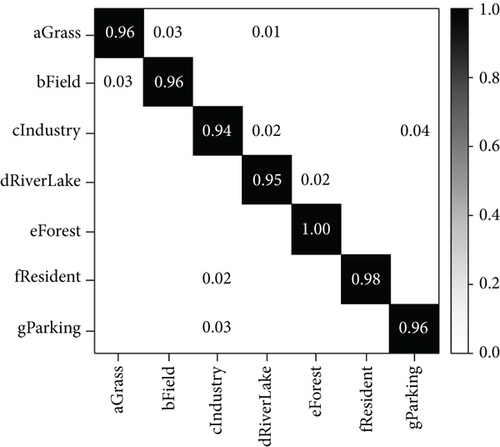
Figure 5 shows the confusion matrix for the global-local two-branch model on the RSSCN7 data set with a training ratio of 50%. Among them, the blank space means “0.” From the figure, resident, industry, and parking are more likely to be misclassified. In addition, using the RSSCN7 data set as an example, we display the loss of the training procedure and the accuracy during the test procedure in Figure 6.

4.3.2. AID Data Set
Our method is compared with the others on the AID data set. Table 5 reports the classification accuracy of different methods. The experimental results show that the proposed method obtains the highest classification accuracy of 94.67% and 97.10% for 20% and 50% training ratios, respectively. Compared with other methods, the classification accuracy of this method is 0.31 higher than of dual attention-aware Net [30] for 20% training ratio and is 0.49 higher than of ResNet101+SENet [31] for 50% training ratio.
| Methods | Training ratio | Training ratio |
|---|---|---|
| 20% | 50% | |
| VGG-VD-16 [26] | 86.59 ± 0.29 | 89.64 ± 0.36 |
| VGG-TEX-Net-LF [27] | 90.87 ± 0.11 | 92.96 ± 0.18 |
| ResNet50-TEX-Net-LF [27] | 93.81 ± 0.12 | 95.73 ± 0.16 |
| Fine-tune MobileNet V2 [28] | 94.13 ± 0.28 | 95.96 ± 0.27 |
| Dual Attention-Aware Net [30] | 94.36 ± 0.54 | 95.53 ± 0.30 |
| EfficientNetB3 [25] | 93.43 ± 0.33 | 95.37 ± 0.41 |
| ResNet101+SENet [31] | 93.69 ± 0.35 | 96.61 ± 0.21 |
| CNN-CapsNet [32] | 93.79 ± 0.13 | 96.32 ± 0.12 |
| RADC-Net [33] | 88.12 ± 0.43 | 92.35 ± 0.19 |
| MG-CAP(Sqrt-E) [34] | 93.34 ± 0.18 | 96.12 ± 0.12 |
| Ours | 94.67 ± 0.07 | 97.10 ± 0.09 |
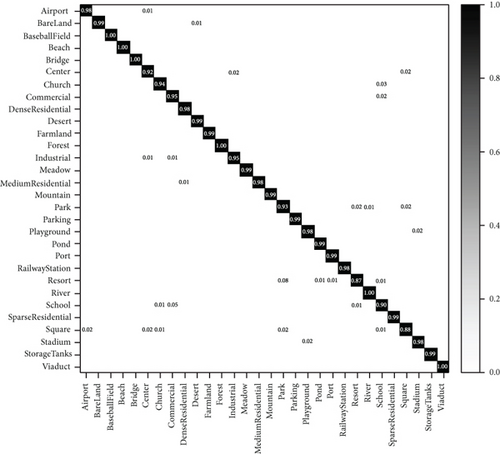
When the training ratio is 50%, the confusion matrix of experimental results is displayed in Figure 7. As can be seen from the figure, resort and school are less than 90% accurate because they are easily misclassified as other scenarios. In addition, center, school, park, and square are all prone to misclassification. Finding the discriminative features between the classes is a key way to further improve the classification performance.
4.3.3. NWPU-RESISC45 Data Set
From Table 6, it can be seen the classification accuracy of our method is the highest compared with other advanced methods, which proves its validity. When the training ratio is 10%, the accuracy of this method is 90.71%, which is 0.54% higher than the second highest MF2Net [35]. When the training ratio is 20%, the accuracy of this method is 93.25%, which is 0.52% higher than MF2Net.
| Methods | Training ratio | Training ratio |
|---|---|---|
| 10% | 20% | |
| ResNet101 [31] | 89.41 ± 0.16 | 92.52 ± 0.17 |
| VGG-16-CapsNet [32] | 85.08 ± 0.13 | 89.18 ± 0.14 |
| Inception-v3-CapsNet [32] | 89.03 ± 0.21 | 92.60 ± 0.11 |
| RADC-Net [33] | 85.72 ± 0.25 | 87.63 ± 0.28 |
| MG-CAP(bilinear) [34] | 89.42 ± 0.19 | 91.72 ± 0.16 |
| Fine-tune VGG16 [36] | 87.15 ± 0.45 | 90.36 ± 0.18 |
| Fine-tune GoogLeNet [36] | 82.57 ± 0.12 | 86.02 ± 0.18 |
| GANet [37] | 87.96 ± 0.23 | 91.36 ± 0.18 |
| MF2Net [35] | 90.17 ± 0.25 | 92.73 ± 0.21 |
| ResNet34 + SFFM [38] | 86.28 ± 0.34 | 91.11 ± 0.13 |
| DS-CapsNet [39] | 89.27 ± 0.22 | 91.62 ± 0.18 |
| Ours | 90.71 ± 0.13 | 93.25 ± 0.09 |
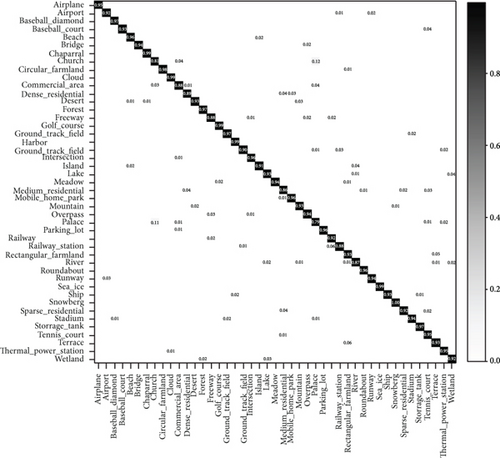
When the training rate is 20%, the confusion matrix of NWPU-RESISC45 data set is shown in Figure 8. The NWPU-RESISC45 data set contains a large number of remote sensing images with complex background, thus hardly substantially improving their classification accuracy. The results in the figure show that the scenarios with low classification accuracy have church, commercial area, dense residential, freeway, industrial area, medium residential, palace, river, wetland, and railway station. To further improve the classification accuracy, new solutions still need to be found.
5. Conclusion
In this paper, a single-object-based region growth is proposed to locate the most important region in remote sensing images. Further, the global-local two-branch network is designed for remote sensing scene image classification. Global branches extract texture and contour information from the whole image, and local branches can extract more discriminative fine-grained features. Two branches promote each other and can improve the problem of large-scale variation. The experimental results show the effectiveness of the proposed approach compared with other state-of-the-art methods on three widely used remote sensing data sets. In future work, the model should be further optimized. How to lighten the model while maintaining high accuracy is a problem that needs further research.
Conflicts of Interest
The authors declare that there is no conflict of interest regarding the publication of this paper.
Acknowledgments
This work was supported by the Major Project of University Natural Science Research of Anhui Province under Grant KJ2018ZD038 and the Domestic Visit and Training Program for the Youth Elite in Universities of Anhui Province under Grant gxgnfx2021175.
Open Research
Data Availability
The data used to support the findings of this research are available from the corresponding author upon request.


