[Retracted] Evaluation of English Proficiency Based on Big Data Clustering Algorithm
Abstract
As one of the common languages in the world, English is playing a more and more important role in trade exchanges, cultural exchanges, and other transnational cooperation. In order to better integrate into the world and communicate with the world, China began to vigorously expand English learning as early as the late 1980s. However, with the development trend of economic globalization and cultural diversity, the traditional English ability evaluation methods are not enough to comprehensively measure individual English ability. Therefore, based on this background, this paper introduces the clustering algorithm into English ability evaluation, improves the traditional clustering algorithm represented by K-means on the basis of predecessors, and captures the evaluation data through neural network algorithm combined with the background of modern big data framework. The results show that the fuzzy logic feature mapping clustering algorithm (FLFM) proposed in this paper performs better than the traditional evaluation algorithm, and the evaluation effectiveness and comprehensiveness are improved by about 10 pt.
1. Introduction
Since the founding of new China, China’s modern educational model has experienced several major changes. The initial change of education mode was in the mid-1950s. Affected by national relations, China learned from the Soviet Union in an all-round way during this period, and the learning trend gradually spread from industry, construction, and other industries to education, culture, and other fields [1]. Therefore, during this period, China’s teaching model also began to follow the Soviet Union. The main teaching mode in contemporary China is as followed. At present, some teachers’ new teaching structure mostly adopts the five rings of Kellov’s Pedagogy in the 1950s of the Soviet Union to (1) organize teaching, (2) check and review, (3) have new teaching, (4) consolidate exercises, and (5) assign homework. This structure, to a certain extent, reflects the general law of students’ learning knowledge, but it does not meet the requirements of the era of the rapid development of science and technology, and the classroom teaching efficiency is not high. Students and teachers gradually take the teacher’s narration as the main content in classroom teaching, and the learning of knowledge is more of a kind of cramming teaching. Often students do not have a good understanding of the teacher’s narration, but obtain temporary memory through so-called stupid methods such as rote memorization and hard memorization [2]. At the same time, the evaluation of students’ knowledge mastery level is generally through midterm examination, final examination, and other ways to evaluate the mastery of students’ knowledge points. This model has achieved certain results in the early stage of operation. It can enable students to quickly grasp the laws of learning content and simply understand its meaning. At the same time, the form of unified teaching and centralized explanation by teachers can also ensure the teaching quality of most students [3]. However, with the gradual solidification of this model, the shortcomings of this model have begun to show more and more. People begin to find that this teaching mode has a great adverse effect on the liberation of students’ talent and the divergence of thinking. In particular, its unified teaching method cannot allow students to expand their imagination, which is extremely unfavorable to the development of students’ potential personality. Students’ subjective initiative has also been restrained to a certain extent, resulting in students’ general lack of enthusiasm for learning [4]. Finally, we found that the students cultivated by this model have a common phenomenon; that is, they have a good grasp of basic knowledge and are relatively solid, but they are particularly inadequate for some in-depth thinking and innovative problems (fan y et al. 2021) [5]. In the 1980s, China conducted a test on students’ comprehensive ability. The subjects were the top 100 students in a key university. Theoretically, the 100 students have achieved good results in their respective learning fields and should be in good condition in their learning ability. However, the final result shows that most of the 100 students have the defect of “intelligent structure” [6]. The defect of intelligent structure refers to that the subject’s intelligence level is no problem, but the ability level is relatively poor; that is, intelligence and ability do not develop synchronously. In the final analysis, teachers only pay attention to students’ mastery of learning content in class, while ignoring the consequences of students’ cultivation of learning ability [7]. This is especially true for English learning. At present, the explanation of English courses in colleges and universities is only blindly analyzing word grammar and sentence structure, breaking these contents into a law that is easy to recite and master, and then teaching this law directly to students. Although the students memorize the English related grammar and the fixed collocation of words by rote, because this knowledge only stays in a single scene and superficial dialogue and communication, although the students are familiar with the English language related grammar and word memorization, from the perspective of English learning ability, they only learn the vocabulary and grammar in this scene. It is impossible to seamlessly switch the knowledge learned from one scene to another [8].
Under the background of teaching mode and change, how to evaluate the accuracy of English ability is what we need to consider now. Since students’ ability is not only reflected in one aspect, we should comprehensively consider the scores of all aspects in the process of evaluating students’ English ability. With the continuous development of computer algorithms, the clustering algorithm has been widely used by people because of its integration of multidimensional results. This paper starts with the evaluation of English ability and discusses the role of clustering algorithm in the framework of big data.
2. Related Work
The essence of English ability is the ability to master the language. As one of the nonnative English speaking countries, China’s mastery of English ability is more reflected in the reading and expression of English ability. Under China’s current education system, our investigation of English ability is more reflected in writing, that is, in a disguised form, our English reading ability [9]. In the process of individual English reading, it not only examines the individual’s mastery of English grammar and basic vocabulary but also examines the reader’s understanding of the objective world through English reading, which is also the embodiment of the reader’s intelligence and emotion. At the same time, the ability of reading and practice can also be improved. Therefore, taking English reading ability as a written investigation method to evaluate individual English ability is relatively comprehensive and objective. With the gradual development of cognitive psychology and psycholinguistics in the 1960s, people began to explore the essence of English proficiency assessment from the perspective of psychology. Among them, the four psychological theories that have the greatest impact on English proficiency assessment are Gough’s information processing theory, Goodman and Smith’s psycholinguistic model, Rumelhart’s interaction model, and Adams et al.’s schema theory [10].
The information processing model mainly puts forward assumptions for the whole process from the acquisition, understanding, and output of external information. This model holds that in the process of cultivating English ability, people first lock the content that needs to be evaluated through attention, and then the lens maps the captured information to the retina. There are many nerve endings directly connected with the brain nerve in the retina. Through these nerve endings, our representation of the external things we notice is transmitted to the brain. The brain processes information from bottom to top, first through the recognition of words, then combine each word into words, and finally combine words into a whole sentence. Therefore, in the process of English ability evaluation, we should also consider the brain’s processing mode of external information to design a reasonable evaluation method (Bai l et al. 2022) [11]. The psycholinguistic model is opposite to the information processing model. It believes that in the training process of improving English ability, individuals process external information from top to bottom. The important evidence support of this conclusion is that in the process of English reading, individuals form a general inference or conclusion in their brain before they see the full text and then constantly look for evidence and details to support this conclusion or hypothesis in the specific reading process. Therefore, the theory holds that in the process of English ability evaluation, the top-down evaluation method should also be followed, and the assessee should carry out sufficient thinking activities according to the existing syntax and semantics in the evaluation process, so as to greatly mobilize the enthusiasm of the assessor [12]. There are many commonalities between the bottom-up processing method and the top-down processing method. The biggest difference is that the processing order of the two is different. From the perspective of their geometric structure characteristics, both are linear structures. With the continuous development of the two models and the deepening of people’s research on ability evaluation, people began to find more limitations of the two models, and both models have strong evidence support, but they cannot be fully proved. Therefore, some people propose to ignore the specific processing sequence of the two processing modes and combine the two modes to take their commonalities to form the interactive mode theory [13]. In the interaction model theory, the processing mode of English ability can be top-down or bottom-up. In the corresponding evaluation methods, it is also considered that there is no need to overemphasize the order. Schema theory is different from the above three theories. Its geometric relationship is distributed. He believes that there is an inherent system storage in people’s brain before people evaluate their English ability. That is, individuals have stored relevant abilities before evaluation, while the subsequent evaluation process or actual ability improvement process is to continuously integrate the newly acquired knowledge into the original knowledge architecture to form the final ability evaluation result [14]. To sum up, Pearson and Johnson finally divided the assessment of English ability into three types according to different dimensions of English ability: assessment of English vocabulary knowledge ability, processing of English text information, and processing of English reasoning ability [15]. Because different psychological models have different effects on the study of English ability assessment, the dimensions of English ability assessment are constantly changing. Different evaluation dimensions focus on different English ability characteristics, which leads to the English ability test often carried out through one algorithm, which cannot fully reflect the individual’s mastery of English ability. With the development of big data algorithm, it provides strong data support for comprehensive evaluation of English ability. Among them, the clustering algorithm is becoming more and more popular in the field of English ability evaluation because of its superior integration characteristics.
3. Method
From formula (1) to formula (3), we can know the basic characteristics of the cluster. The cluster is a subset of the sample set, and the sample set must disperse all the samples into the cluster, and the samples contained in each cluster do not coincide with each other.
The core of clustering algorithm is to divide the samples to be analyzed into different clusters according to the size of common differences. Generally speaking, the clustering process is mainly divided into five steps: feature selection, similarity measurement, clustering algorithm, result verification, and result judgment. Corresponding to our data processing, we first extract the preliminary features of the input data and then measure the similarity of each feature to measure the difference between each feature but also pave the way for the classification of subsequent clusters. Finally, the clustering algorithm is determined according to the feature distribution, because in actual operation, different sample features may have overlapping and ambiguous features, so we need to choose the final clustering algorithm to determine the data clustering structure. According to the determined clustering algorithm, we can obtain the final clustering results and then verify the results and determine the accuracy of the results. The specific flow chart is shown in Figure 1.

According to the number of iterations, the evaluation difficulty and the minimum value of similarity change with the increase of the number of iterations. The specific change trend is shown in Figure 2.
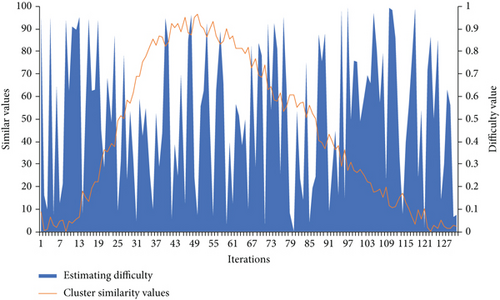
It can be seen from the figure that with the increase of the number of iterations, the similarity value between clusters increases first and then decreases, which is similar to the change of normal distribution. I speculate that it is because the algorithm can learn less information at the early stage of iteration, so it is unable to make a reasonable judgment on the similarity results. Therefore, the similarity value gradually began to rise. After iterating to a certain level, the algorithm has a general understanding of the judged information, so the accurate value will be reduced when iterative training is carried out again. In Figure 2, when the number of iterations is 50, the similarity value between clusters is the largest. However, we also found that the number of iterations does not seem to have a great impact on the overall difficulty of the evaluation. Through specific analysis and relevant data access, we find that the general advantage of the typical clustering algorithm represented by K-means is that it is simple and easy to operate and can be used quickly in the analysis of practical problems. However, because the algorithm completely depends on the linear regression theory and the selection of cluster center is completely random, it will cause many invalid operations in the calculation process. These operations will occupy the computing power of the computer and lead to the problem of unstable operation with the increase of the number of iterations. Therefore, the difficulty of evaluation changes irregularly.
To solve the above problems, we propose a fuzzy logic feature mapping clustering algorithm. Based on the traditional clustering algorithm, the algorithm introduces the theory of artificial neural network. While keeping the clustering principle unchanged, it can give full play to the advantages of artificial neural network in problem processing under the background of big data framework and make up for the unstable operation of traditional clustering algorithms.
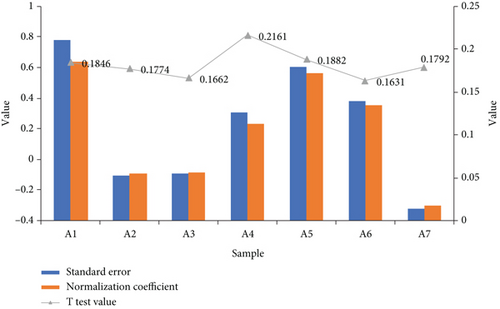
As shown in Figure 3, we evaluate the English ability of the algorithm again. We randomly selected four representations of English proficiency assessment as the evaluation objects and then measured the evaluation results through their error value and standardization coefficient. Finally, the correctness of the results is judged by a t-test. The results are shown in Figure 3. Through Figure 3, we can see that the evaluation results of different sample sets are different, but on the whole, the standard error remains about 0.5, and the average standardization coefficient is about 0.4, which is better than the traditional clustering method. The results of t-test were significant. It shows that the algorithm has 95% probability of effectiveness. Overall, the assessment results are better than the traditional English proficiency assessment.
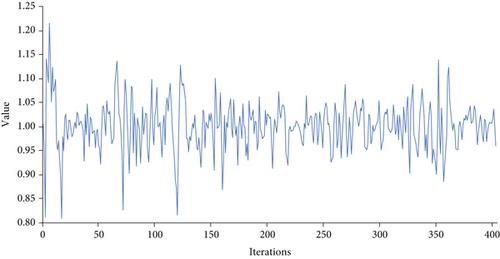
Through the above formula, we first determine the probability of normal operation under the theoretical condition and calculate the error probability by the principle that the sum of normal probability and error probability is 1. In this way, the probability value of errors in n iterations can be calculated continuously. This probability value can explain the probability value of a series of errors in each mode response, which can fit the probability of errors in objective situations to a certain extent and take this problem into account in advance in the specific calculation process. When the final result is output, this part of the value can be eliminated to maintain the stability of similarity. The specific results are shown in Figure 4.
4. Result Analysis and Discussion
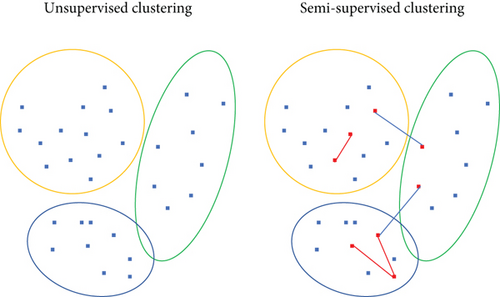
After we have determined the evaluation results of the clustering algorithm based on the big data framework for English ability, we need to verify the accuracy of the results. Generally speaking, the accuracy of the results is determined from the following six aspects: the ability to process large data sets, the ability to process arbitrary shape data, whether the results of algorithm processing are related to the order of data input, the ability to process data noise, whether it is necessary to know the number of clusters in advance, and whether it is sensitive to data dimension. The algorithm used in this paper is fuzzy logic feature mapping clustering, which is one of the semisupervised clustering algorithms. Compared with the traditional unsupervised clustering algorithms such as k-means, this algorithm increases the setting of mutual supervision of each link in the iterative process, as shown in Figure 5. It can be seen that semi supervised clustering algorithm adds information markers on the basis of unsupervised clustering algorithm, and the marked information here is the part of “error” in the operation of supervision process. This part of the data will be eliminated when the subsequent algorithm runs, and finally, a conclusion with high accuracy will be drawn. Therefore, the results of this chapter will also start from the traditional unsupervised recording algorithm and the semisupervised algorithm proposed in this paper to discuss their performance in the evaluation scope and the accuracy and authenticity of the evaluation conclusion.
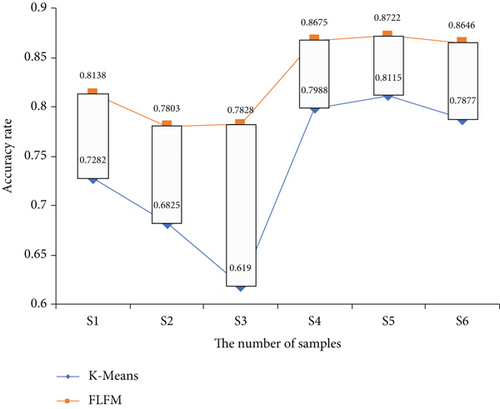
Next, we further verify the effectiveness of the fuzzy logic feature mapping clustering algorithm (flfm) proposed in this paper and compare the accuracy of traditional unsupervised clustering algorithm with flfm algorithm in English ability evaluation. The results are shown in Figure 6. It can be seen that for the randomly selected six groups of samples, the accuracy of the fuzzy logic feature mapping clustering algorithm proposed in this paper is more than 75%, up to 87%. The highest accuracy of traditional unsupervised clustering algorithm represented by K-means is only about 81%, and the accuracy is relatively unstable.
In addition, the data sources used in data processing in this paper are comprehensively collected through the Internet. Today, with the rapid development of the world, people are no longer confined to being able to speak and write, but more inclined to the overall understanding of ideas and logic. In order to conduct a more comprehensive assessment of English ability and avoid the problem of inaccurate results caused by extreme assessment, we conducted a survey on English ability assessment through 200 students at random before processing. The results are shown in Figure 7.
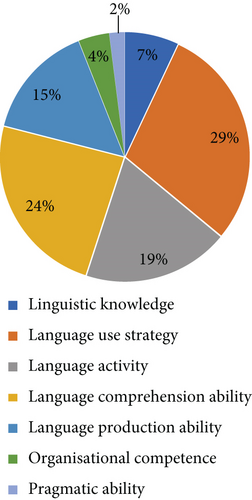
The results show that people’s understanding of English ability has indeed changed greatly compared with the past. Pragmatic competence, language use strategies, and language understanding ability account for a high proportion; these three abilities account for 72% of English proficiency. The most obvious one is that people no longer think that English knowledge through rote accounts for the highest proportion in English ability but pay more attention to the understanding and application of English. This is also consistent with the English aspects we collected and evaluated through the big data framework, which further proves the value of the clustering algorithm based on the big data framework proposed in this paper in the application of English ability evaluation.
5. Conclusion
- (1)
With the increase of iteration times, the similarity between clusters first increases and then decreases, which is similar to the change of normal distribution. The algorithm completely depends on linear regression theory, and the selection of clustering center is completely random, so it will lead to many invalid operations in the calculation process. With the increase of iteration times, it will lead to the problem of unstable operation. In order to solve the above problems, we propose a fuzzy logic feature mapping clustering algorithm. We randomly selected four English proficiency evaluation representations as the evaluation objects and then measured the evaluation results through their error values and standardization coefficients. The evaluation results of different sample sets are different, but the overall standard error remains around 0.5, and the average standardization coefficient is about 0.4, which is better than the traditional clustering method. The results of t-test showed significant difference. The results show that the efficiency of this algorithm is 95%. In general, the assessment results are better than the traditional English proficiency assessment
- (2)
We will also start with the traditional unsupervised recording algorithm and the semi supervised algorithm proposed in this paper and discuss their performance within the scope of evaluation, as well as the accuracy and authenticity of the evaluation conclusion. For six groups of randomly selected samples, the accuracy of the fuzzy logic feature mapping clustering algorithm proposed in this paper is more than 75%, up to 87%. The accuracy of traditional unsupervised clustering algorithm represented by K-means is only about 81%, and the accuracy is relatively unstable
- (3)
We conducted a random English proficiency assessment survey on 200 students before processing. The results show that compared with the past, people’s understanding of English ability has indeed changed a lot. The most obvious point is that people no longer think that rote English knowledge accounts for the highest proportion of English ability but pay more attention to the understanding and application of English. The big data framework clustering algorithm proposed in this paper has good significance and value for the accuracy and comprehensiveness of English proficiency assessment
Conflicts of Interest
The authors declare that they have no conflicts of interest.
Acknowledgments
The authors would like to show sincere thanks to those techniques which have contributed to this research.
Open Research
Data Availability
The figures used to support the findings of this study are included in the article.


