Self-Healing and Shortest Path in Optical Fiber Sensor Network
Abstract
In this study, a new square-based fiber Bragg grating (FBG) sensor network model is proposed to address possible link failures in FBG sensor networks and improve their reliability. Graph theory and optical switching are simultaneously applied to these sensor networks to improve their self-healing ability; the FBG sensor network is regarded as a directed graph. Three commonly used self-short-circuit algorithms are compared in terms of the self-healing capabilities that they provide to the optical fiber sensor network. Among these, the shortest-path faster algorithm achieved a high, nearly 90% repair accuracy and had an average repair time of 0.103 s, the shortest in this study. The newly designed FBG self-healing network can be reorganized and repaired when local damage occurs, thereby improving its reliability.
1. Introduction
A fiber Bragg grating (FBG) is a passive optical fiber device with narrow band reflection characteristics fabricated on an optical fiber. Because of its small size, large measurement range, good wavelength selectivity, insensitive polarization, and strong anti-interference ability, FBGs are widely used in many fields such as infrastructure, national defense and security, biomedicine, and petrochemicals [1–4]. The numbers of sensors required in such applications have also been increased significantly to ensure that the accuracy of sensor data monitoring does not decrease. FBG is characterized by easy network measurement, large capacity multiplexing, and wavelength demodulation [5–8]. It can be used in optical fiber sensor networks for monitoring large-scale engineering applications, which have strict requirements for the reliability of FBG sensor networks. Because most networks are embedded or pasted in the structure, it becomes more difficult to repair fiber links when they fail. Thus, the main challenge with regard to the development of fiber grating sensor networks is the attainment of self-healing and improved reliability.
The self-healing capabilities of optical fiber sensor networks (OFSNs) have been extensively researched. In 2017, Jia D et al. proposed a self-healing evaluation model based on full-terminal reliability functions in OFSNs [9]. Based on this model, topological equations were established using state enumeration and Monte Carlo methods. Tsai et al. developed a two-step fiber link failure detection and self-healing algorithm that detects fiber link failures and bypasses their impact [10]. Chang et al. devised a fully passive OFSN based on a single-line bidirectional optical addition multiplexer (SBOADM), which can easily accomplish single-line bidirectional transmission without a power supply or optical switch; once the network fails, the preinstalled remote node of the sensor network must be adjusted. [11] Zhu et al. proposed a real-time parallel data acquisition and big data processing method that can reuse different optical fiber sensors with a sampling frequency of up to 6.4 MHz, and data throughput of up to 13.8 MB/s; this method was three times faster than the general method [12]. In 2020, Manie et al. proposed a deep learning algorithm that improves the measurement accuracy of sensor signals for sensor systems. Additionally, they developed a multiplexing method, referred to as intensity wavelength division multiplexing (IWDM), that increases the total number of fiber grating sensor multiplexing for multipoint measurement in sensor networks [13]. Each of the aforementioned studies accomplished in-depth self-healing from either a hardware or software aspect, i.e., either an algorithm was used or the hardware structure was improved. Only a few recent studies have combined software and hardware to realize the self-repair of an optical network. Based on this context, this study proposes a sensor networking method used in conjunction with a shortest-path algorithm from graph theory, to attain complete self-healing in a network. This research is based on the use of surviving sensors near the damaged area; the proposed method automatically reconstructs and performs complete self-healing on the entire optical fiber network, thus guaranteeing the function of the optical fiber smart material structure and improving its reliability.
2. Materials and Methods
2.1. Self-Healing Principle of OFSN
In this study, the self-healing of an optical fiber sensor network was realized to be able to build a network of FBG sensors based on the topological structure of an optical switch. The graph theory was used in conjunction with a search algorithm to obtain the best placement plan for a multichannel optical fiber sensor system, thereby devising a suitable configuration for each optical fiber sensor system. When a link in the network fails, and the sensor cannot be successfully multiplexed, the optical path can be changed through link switching in the optical switch to accomplish multiplexing in the damaged sensor. For FBG sensors, such failures are expected to occur at some point because of forces and temperatures from the external environment, causing the FBGs to age and eventually break. The typical cause of link failure is optical fiber disconnection, which can be due to damage from human or natural activities, damage of some sensors in a sensor array, etc.
The topological structure of an OFSN shows how the optical fiber sensors are connected. Currently, the most widely used topological structures are wired (linear), star, and bus structures. In a linear structure, shown in Figure 1, a number (n) of optical fiber sensors are connected in series via a transmission fiber. The advantage of this structure is that the network and structure are simple. The disadvantage is that if a sensor fails, it will affect the normal operation of subsequent sensors; such crosstalk between the sensors results in low system reliability.

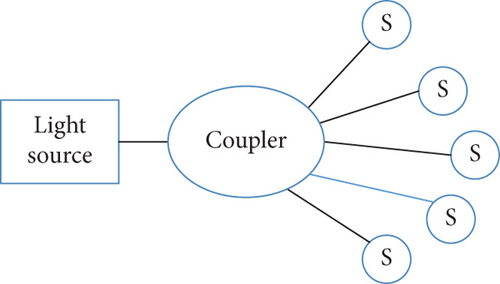
In a star-shaped structure, shown in Figure 2, each fiber optic sensor is connected to a coupler via a transmission fiber. The advantage of this topology is that each sensor is independent; thus, damage in one sensor does not affect the other sensors. The disadvantage is that the structure is relatively complex, which makes large-scale networking difficult.
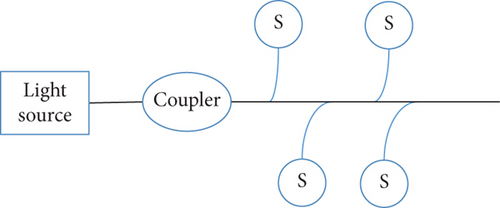
In a bus topology structure, shown in Figure 3, an optical fiber is used as a bus, to which each sensor is connected via a transmission optical fiber. The advantage of this structure is that the sensors share a common bus, which effectively reduces cost. This network structure is also easy to expand and has high reliability. However, sharing a bus creates a single point of failure; should the bus fail, the entire network would be paralyzed.
In this study, the characteristics, advantages, and disadvantages of these network topologies were comprehensively considered. The linear and star topologies were then combined in the newly developed sensor network structure; the overall structure was based on a star structure, whereas the branches adopted a linear structure. The new network structure was therefore able to benefit from these two structures. This also enabled the use of multiple types of optical fiber sensors, and as a result, the network capacity and reliability could be greatly improved.
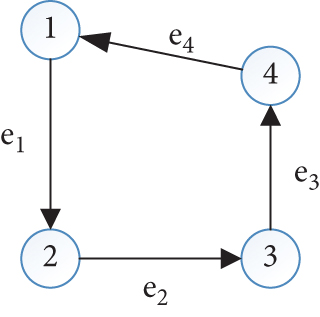
Graph theory, which has multiple applications in the fields of natural and social sciences [14–17], is a branch of mathematics in which graphs are regarded as the research objects. In this theory, a graph is composed of several given points, where every point is connected to at least one other by a line. A graph is primarily used to describe relationships between certain things. A point is used to represent a thing, and a line is used to connect two points; a line indicates a relationship between two corresponding objects. In an FBG sensor network, the FBG sensors and demodulators are considered the nodes of the graph; the transmission fibers are considered the edges of the graph. In graph theory, a graph can be expressed as G = <V(G), E(G)>, where V(G) = {υ1, υ2, ⋯, υn} is the node set of graph G, and E(G) = {e1, e2, ⋯, em} is the edge set of graph G. If ei is {υj, υt}, then ei is called an undirected edge with υj and υt as its endpoints, and graph G is an undirected graph; if ei is <υj, υt>, then ei is called a directed edge with υj as the starting point and υt as the end point, and graph G is a directed graph [18, 19]. In the example shown in Figure 4, the node set V(G) is {1, 2, 3, 4}, and the edge set E(G) is {e1, e2, e3, e4}.
2.2. Sensor Network Model
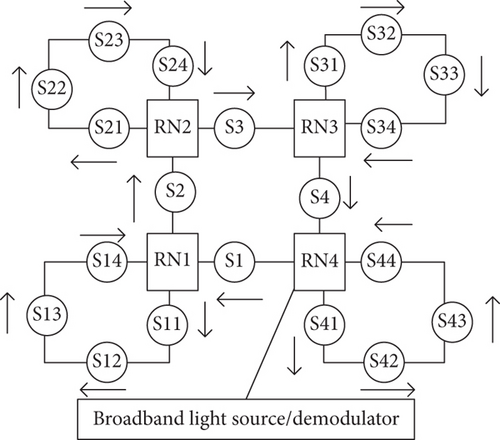
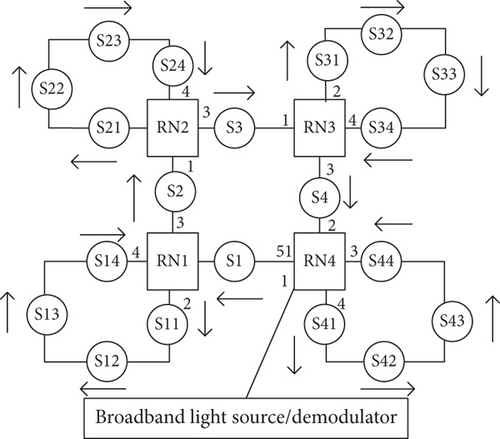
In an FBG sensor network, optical fibers and remote nodes connect different FBG sensors (indicated by S in Figures 1–3) to form a square-based network model. Figure 5 shows an S diagram of a high-reliability network model structure based on an optical switch. The grating center wavelengths of the sensors in the network are shown in Table 1.
| FBG | S11 | S12 | S13 | S14 | S21 | S22 | S23 | S24 | S31 | S32 | S33 | S34 | S41 | S42 | S43 | S44 |
|---|---|---|---|---|---|---|---|---|---|---|---|---|---|---|---|---|
|
1527 | 1535 | 1543 | 1550 | 1530 | 1538 | 1546 | 1553 | 1521 | 1525 | 1548 | 1556 | 1524 | 1532 | 1540 | 1559 |
It should be noted here that there can be more sensors on each side; only one FBG sensor was considered for convenience of discussion. Under normal circumstances, the propagation direction of light is as shown in Figure 5. If a link failure occurs, the light propagation path can be changed to realize self-healing by switching the optical switch of the remote node (RN1).
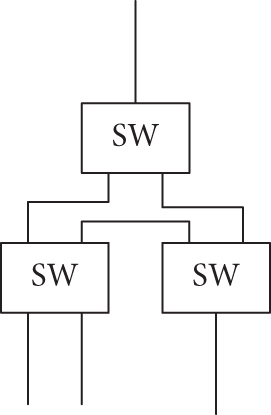
Figure 6 shows a structural diagram of a remote node (RN1–RN3) comprising one 2 × 2 optical switch (OS) and two 1 × 2 OS connections. Because of the 1 × 3 structure, the remote node has a total of five link-switching methods. For comparison, Figure 7 shows a structural diagram of a combination of a remote node RN4 and a coupler, composed of one 1 × 2 OS, two 2 × 2 OSs, and a coupler. Because of the 1 × 4 structure, the remote node has a total of eight link-switching methods.
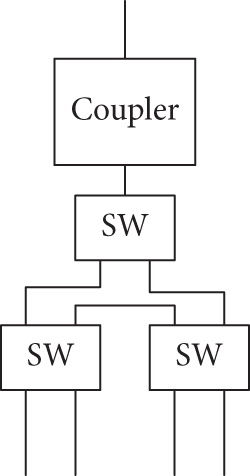
To express the sensor network using graph theory, it is necessary to analyze the internal structures of the remote nodes; for example, Figure 8 shows the internal structure of remote node RN4. As mentioned previously, because RN4 is composed of one 1 × 2 OS and two 2 × 2 OSs, there are six switches, K1–K6. When K i=1 (i=1–6), it indicates that the corresponding light path is turned on, whereas when K i=0, it indicates that the corresponding light path is turned off. Among the six switches, K1 and K2 represent the 1 × 2 optical switches, whereas K3–K6 represent the 2 × 2 optical switches. When K1=1, K2=0; when K2=1, K1=0; the same holds true for the other switches. RN4 has five ports, for which there are eight possible paths, namely, {1↔K1↔K3↔2}, {1↔K1↔K4↔3}, {1↔K2↔K6↔4}, {1↔K2↔K5↔5}, {2↔K4↔K6↔5}, {2↔k4↔k6↔5}, {3↔K3↔K5↔4}, and {3↔K3↔K6↔5}.
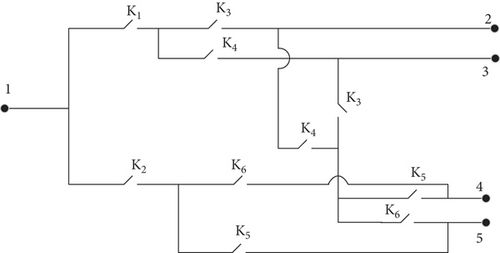
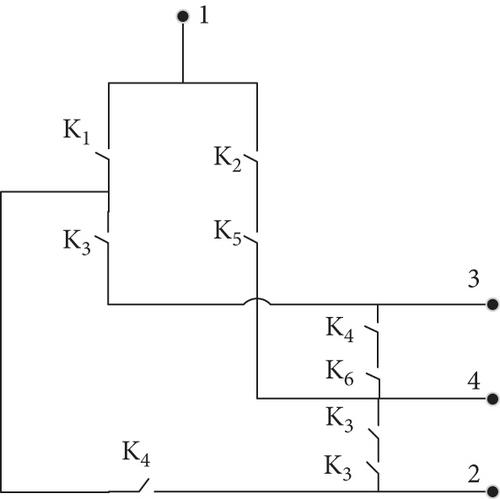
Figure 9 shows the internal structure of remote nodes RN1–3, where K1, K2, K5, and K6 are the 1 × 2 optical switches, whereas K3 and K4 are the 2 × 2 optical switches. RN1–3 has four ports, for which there are five possible paths, namely, {1↔K1↔K4↔2}, {1↔K1↔K3↔3}, {1↔K2↔K5↔4}, {2↔K3↔K6↔4}, and {3↔K4↔K6↔4}.
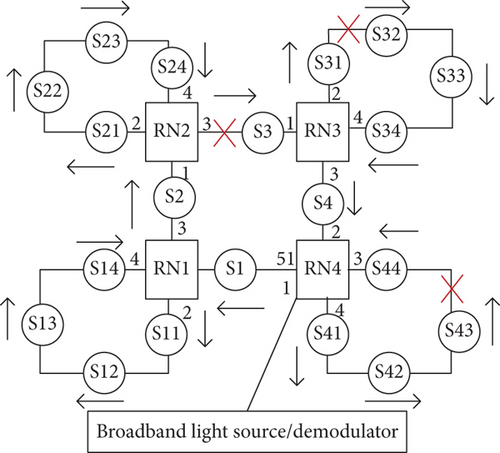
For the convenience of subsequent expressions, the switches used by remote nodes RN1–3 are marked as K1–K18, whereas the switches used by remote node RN4 are marked as K19–K24. Figure 10 shows the port numbers shown in Figures 10 and 11 placed in the network structure diagram, which can more intuitively show the light propagation path.
3. Results and Discussion
The self-healing path of the OFSN utilizes different demodulation schemes because of the use of several optical switches. To use the OFSN more efficiently, it is necessary to find the shortest self-healing path to avoid repetitive multiplexing of the FBG sensors.
3.1. Application of Graph Theory
Each in Ak (k ≥ 1) represents the number of paths whose length is k between vertices vi and vj.
For the network structure shown in Figure 10, under the assumption that the light propagation path is as shown by the arrow in Figure 10, the state of the switches is K1=K4=K6=K7=K10=K12=K13=K16=K18=K20=K22=K23=1. The remaining switches are turned off. If the FBG sensor network has a link failure, like that shown in Figure 11, then sensors S31, S32, S33, S34, S4, S41, S42, S43, and S44 will not be demodulated and will therefore become useless.
This adjacency matrix is calculated according to the maximum number k of the FBG sensors contained in each optical path connected to the demodulator. In calculating Am (m ≤ k), the element in Am represents the connection between the i2th FBG sensor and sensor S1 in the sensor network. When , it indicates that there is no demodulation path between the i2th FBG sensor and sensor S1, and that there is no optical path from FBGi2 to FBGS1, whereas when , it indicates that there are Y self-healing demodulation paths from FBGi2 to FBGS1.
3.2. Shortest Self-Repair Path
Different combinations of optical switches produce different combinations of self-healing paths for OFSNs. Therefore, a shortest-path algorithm from graph theory is required to determine the shortest-path plan.
For example, the FBG sensor network shown in Figure 11 comprises 20 FBG sensors. Based on the adjacency matrix combined with the shortest-path algorithm, the shortest self-healing path, its length, and switch state are obtained. The actual repair results for the network shown in Figure 11 are presented in Table 2.
| Damaged FBG | Self-healing path | Optical switch status | Length |
|---|---|---|---|
| S3 | S1⟶S3 | K13=K15=K19=K211=1 | 2 |
| S31 | Unrepaired | \ | 0 |
| S32 | S4⟶S34⟶S33⟶S32 | K16=K18=K19=K21=1 | 4 |
| S33 | S4⟶S34⟶S33 | K16=K18=K19=K21=1 | 3 |
| S34 | S4⟶S34 | K16=K18=K19=K21=1 | 2 |
| S4 | S4 | K19=K21=1 | 1 |
| S41 | S41 | K20=K24=1 | 1 |
| S42 | S41⟶S42 | K20=K24=1 | 2 |
| S43 | S41⟶S42⟶S43 | K20=K24=1 | 3 |
| S44 | S44 | K19=K22=1 | 1 |
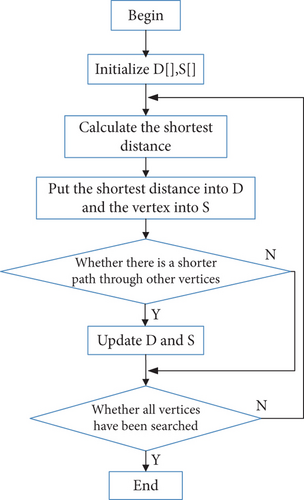
There are three types of shortest-path algorithms commonly used in graph theory: Dijkstra [20], Floyd [21], and the shortest-path faster algorithm (SPFA) [22]. The defining characteristic of the Dijkstra algorithm is that it gradually extends from the starting point to the connection point to find the shortest path until it reaches the end point; all extension points passed during this period are the nodes on the shortest path. The Dijkstra algorithm adopts the strategy of a greedy algorithm. First, an array D is introduced to save the shortest distance from the starting point to other vertices, and then a set S is declared to save the vertices of the shortest path. The algorithm selects the minimum value from D as the shortest distance from the starting point to the corresponding point and puts this point into S. Then, it continues to select vertices that are not in set S and determines whether the new vertex can reach other vertices and whether the distance from the starting point to the other vertices through the new vertex is shorter than the previously recorded shortest distance. If shorter, the value in D is updated. This step is repeated until all vertices are included in S. The flow of the algorithm is illustrated in Figure 12.
The Dijkstra algorithm is used to repair the network shown in Figure 11; the results of the algorithm are outlined in Table 3.
| Damaged FBG | Self-healing path | Optical switch status | Length | Time/s |
|---|---|---|---|---|
| S3 | S4⟶S3 | K13=K15=K19=K21=1 | 2 | 0.2103 |
| S31 | S4⟶S34⟶S31 | K16=K18=K19=K21=1 | 3 | 0.1487 |
| S32 | S4⟶S34⟶S33⟶S32 | K16=K18=K19=K21=1 | 4 | 0.1456 |
| S33 | S4⟶S34⟶S33 | K16=K18=K19=K21=1 | 3 | 0.1594 |
| S34 | S4⟶S34 | K16=K18=K19=K21=1 | 2 | 0.1402 |
| S4 | S4 | K19=K21=1 | 1 | 0.1406 |
| S41 | S41 | K20=K24=1 | 1 | 0.1401 |
| S42 | S41⟶S42 | K20=K24=1 | 2 | 0.1391 |
| S43 | S41⟶S42⟶S43 | K20=K24=1 | 3 | 0.1468 |
| S44 | S44 | K19=K22=1 | 1 | 0.1539 |
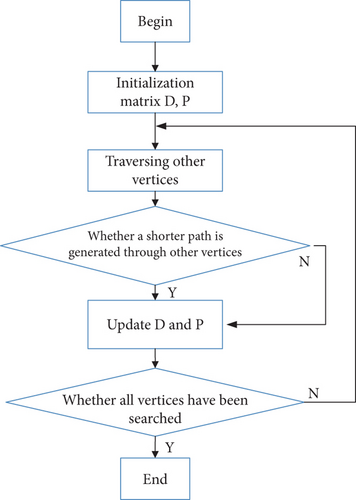
The Floyd algorithm, also known as the insertion point method, is an algorithm that uses the idea of dynamic programming to find the shortest path between multiple source points in a given weighted graph. The Floyd algorithm is a dynamic programming algorithm. The algorithm introduces two matrices: D and P. The elements in D represent the distance between the corresponding vertices, whereas the elements in P represent the vertices passed between the two vertices. The two matrices need to be updated N times, where N is the number of vertices. Each time, the corresponding vertices are inserted into matrix D, and the distance after insertion is compared with the original distance. If the distance after insertion is smaller, the values in matrices D and P are updated. The flow of the algorithm is illustrated in Figure 13.
The Floyd algorithm is used to repair the network shown in Figure 11; the results of the algorithm are outlined in Table 4.
| Damaged FBG | Self-healing path | Optical switch status | Length | Time/s |
|---|---|---|---|---|
| S3 | Unrepaired | \ | 0 | \ |
| S31 | Unrepaired | \ | 0 | \ |
| S32 | S4⟶S34⟶S33⟶S32 | K16=K18=K19=K21=1 | 4 | 0.5570 |
| S33 | S4⟶S34⟶S33 | K16=K18=K19=K21=1 | 3 | 0.5467 |
| S34 | S4⟶S34 | K16=K18=K19=K21=1 | 2 | 0.5504 |
| S4 | S4 | K19=K21=1 | 1 | 0.5478 |
| S41 | S41 | K20=K24=1 | 1 | 0.5530 |
| S42 | S41⟶S42 | K20=K24=1 | 2 | 0.5489 |
| S43 | S41⟶S42⟶S43 | K20=K24=1 | 3 | 0.5541 |
| S44 | S44 | K19=K22=1 | 1 | 0.5333 |
SPFA adopts the dynamic approximation method. An array D is introduced to save the shortest distance from the starting point to the other vertices, and then a queue is established. Each time, the queue head u is listed to relax the arc head node v corresponding to the edge of the u point as the end of the arc. If the shortest-path estimation of point v is adjusted, and it is not in the queue, it is placed at the end of the queue. This process is repeated until the team is empty. The flow of the algorithm is shown in Figure 14.
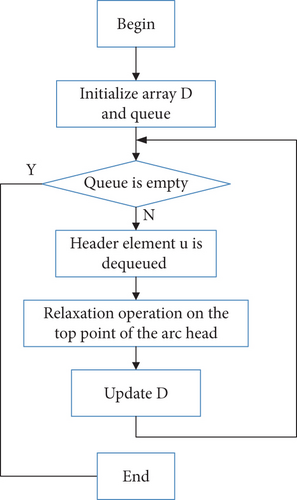
SPFA is used to repair the network shown in Figure 11; the results of the algorithm are outlined in Table 5.
| Damaged FBG | Self-healing path | Optical switch status | Length | Time/s |
|---|---|---|---|---|
| S3 | S4⟶S3 | K13=K15=K19=K21=1 | 2 | 0.1270 |
| S31 | S4⟶S34⟶S31 | K16=K18=K19=K21=1 | 3 | 0.0971 |
| S32 | S4⟶S34⟶S33⟶S32 | K16=K18=K19=K21=1 | 4 | 0.1196 |
| S33 | S4⟶S34⟶S33 | K16=K18=K19=K21=1 | 3 | 0.0958 |
| S34 | S4⟶S34 | K16=K18=K19=K21=1 | 2 | 0.0969 |
| S4 | S4 | K19=K21=1 | 1 | 0.0978 |
| S41 | S41 | K20=K24=1 | 1 | 0.0980 |
| S42 | S41⟶S42 | K20=K24=1 | 2 | 0.0976 |
| S43 | S41⟶S42⟶S43 | K20=K24=1 | 3 | 0.0977 |
| S44 | S44 | K19=K22=1 | 1 | 0.1023 |
From Tables 3–5, we can intuitively compare the advantages and disadvantages of the three algorithms. The repair results for the Floyd and SPFA algorithms are the same and contain errors only in the repair path of sensor S31. However, the repair time of the SPFA algorithm is shorter, with an average of 0.103 s. By contrast, the Dijkstra algorithm demonstrated more errors compared to those exhibited by the other two algorithms, which repaired low-accuracy results in both paths; furthermore, the self-healing took longer. Therefore, it was clearly not the best repair algorithm.
Based on the results, it can be concluded that the Dijkstra algorithm cannot be used to solve a graph with negative-weight edges and can only be used primarily to solve single-source problems. Moreover, the time required to solve the problem between any two points continued to increase. On the other hand, the Floyd algorithm, being an improved version of the Dijkstra algorithm, was able to solve the shortest path between a graph with a negative weight and any two points; it was simple and easy to implement and program. However, the time efficiency of this algorithm was the lowest; thus, the time required was longer than that of SPFA, which is an improved version of the Bellman–Ford algorithm, wherein a queue and adjacency list are used. SPFA exhibited not only the same advantages as those of the Floyd algorithm but also better time efficiency and space complexity compared to those of the Floyd algorithm.
4. Conclusions
This study investigated the optical fiber sensing and self-healing capabilities of a sensing network to address the problem of efficiently repairing faults in optical fiber sensing networks. Linear and star topology structures were combined into a square network structure with good scalability and reliability. As a result, a new self-healing model for a fiber Bragg grating sensor network was developed based on graph theory and optical switches to realize self-repair in the sensor network. Simultaneously, a shortest-path algorithm based on graph theory was used to obtain the shortest self-healing path, and the corresponding optical switch state was determined. Through this strategy, self-healing of the optical fiber sensor network was achieved more efficiently. The experimental results show that SPFA achieved nearly 90% repair accuracy and high temporal efficiency, with an average repair time of 0.103 s. This study showed that this network structure has good self-healing ability. The research results can provide certain guidance for the self-healing of FBG sensor networks in practical engineering applications.
Research on the reliability of FBG sensor networks started relatively late. It is a new multidisciplinary research field that involves a wide range of subtopics. This study provides only a basic exploration, and there remain many imperfections and areas for further investigation. For example, the shortest-path algorithm used herein, while having demonstrated the best performance, was still unable to achieve 100% repair accuracy. Another challenge to overcome is the simultaneous self-repair of multiple damages, which remains a difficult problem for artificial intelligence research.
Conflicts of Interest
The authors declare that they have no conflicts of interest.
Acknowledgments
This work was supported by the National Natural Science Foundation of China (No. 61873002), Basic Science (Natural Science) Research Project of Higher Education Institutions in Jiangsu Province (No. 21KJA510001), and National Foundation Incubation Project of Jinling Institute of Technology (No. jit-fhxm-202103).
Open Research
Data Availability
Data available on request from the authors.


