Construction and Analysis of Public Management System Indicators Based on AHP (Analytic Hierarchy Process)
Abstract
In the era of intelligent network, my country’s public management services are in a transition period, and many problems have gradually occurred, which have a certain impact on public management. In the previous management mode, the latest management requirements could not be met, and there were many problems in the actual management process. With the rapid development of social economy, public management is the key to promote social development. Only by constructing a reasonable index system of public management can public management play its due role in the era of rapid development. Therefore, this paper uses Bohr formula, Shannon formula, and entropy weight method to construct the public management system index based on AHP. The research results of this paper are in the stage of model checking, and the accuracy of this method is the highest in different data sets. The accuracy of big data analysis method and the original method decreases with the increase of data sets, which reflects the obvious advantages of this method. The response time of big data analysis methods increases gradually due to the increase of data sets, but the method in this paper grows slowly. All indicators show that the constructed public management index system has high reliability and validity.
1. Introduction
The rapid economic development has put forward higher and higher requirements for public management. With the gradual improvement of the level of social modernization, public management measures also need to be improved accordingly. In order to continuously optimize my country’s public management system, this paper uses Bohr’s formula, Shannon’s formula, and entropy weight method to construct a public management system index system based on AHP and analyzes it in detail. This paper has received a lot of support on the basis of previous research results. AHP is an organic combination of qualitative and quantitative methods [1]. AHP pays more attention to qualitative analysis and judgment than general quantitative methods [2]. AHP does not require more quantitative data information [3]. AHP is a simple and general decision-making method [4]. AHP is to decompose the decision problem into different levels in order [5]. AHP is a system analysis method [6]. It is both practical and effective when dealing with complex decision problems [7]. Public management emphasizes the “publicity” of management objectives [8]. On the other hand, it emphasizes the scientific method of using public power [9]. Public management is a management concept and management model that is produced in response to the defects of government management [10]. Public management emphasizes the supervision, restriction, and regulation of public power [11]. The subject of public administration is diverse [12]. The regulation of public management functions [13]. An indicator system refers to an organism composed of several interrelated statistical indicators [14]. The establishment of the index system is the premise and foundation of prediction or evaluation research [15].
2. AHP (Analytic Hierarchy Process)
Analytical hierarchy process [16] is a method of quantitatively evaluating qualitative conclusions by combining a series of theories with time. By grading complex problems, simplifying complexity, and taking weights as ideas, it provides a basis for choosing the best solution.
2.1. Features of AHP
The characteristics of AHP: (1) the thinking of decision makers has become more logical and hierarchical, and the overall decision-making process has become clearer, forming a logical chain. (2) Be clearer about the factors involved in the decision-making process and their relationships [17]. (3) The introduction of quantitative analysis in the judgment process can improve the scientificity and logic of decision makers’ thinking and make the decision-making process more scientific.
The advantages and disadvantages of AHP are shown in Table 1 below.
| Advantage | Shortcoming |
|---|---|
| Systematic approach to analysis | Inability to provide new options for decision-making |
| Simple and practical decision-making method | Less quantitative data, more qualitative components, less convincing |
| Less quantitative data information required | The exact method of eigenvalues and eigenvectors is more complicated |
2.2. Building a Hierarchical Model
2.2.1. Steps to Build a Hierarchical Model
Building a practical and efficient hierarchical model requires the following steps:
Step 1. Collect and organize relevant information and data.
Step 2. Identify the characteristics of information and classify it.
Step 3. Build the overall structure of the target, and establish the basic hierarchical structure of the target and the target network structure.
Step 4. Extract attributes from the target structure.
Step 5. Filter out unnecessary influencing factors and common features, and select key distinguishing features.
Step 6. Use decision-making methods to assess influencing factors.
Step 7. Discuss the selection results and make a final decision.
2.2.2. Hierarchical Model
Hierarchical model is shown in Figure 1.

The AHP structure model divides the relationship among objectives, standards, and schemes into the highest level, the middle level, and the lowest level. Among them, the highest level represents the purpose of decision-making, and the problem to be solved is the overall goal. The middle tier represents factors and criteria that need to be considered. The bottom layer represents the alternatives considered when solving the problem when making a decision.
2.3. Weight Calculation of AHP
2.3.1. Subjective Weight Calculation
The steps of using AHP to determine the index weight are as follows [18]. Establish a progressive hierarchy model is defined as follows:
Step 1. Constructing the judgment matrix
Step 2. Calculate the weight of each factor
Generally speaking, the calculation of eigenvectors generally adopts the square root method, the power method, the arithmetic mean method, the geometric mean method, etc. In this article, the square root method is used to calculate the weight coefficient of the index. The specific steps are as follows:
The obtained matrix is the weight coefficient of each index.
where (AW)i is the i component of AW.
Step 3. The consistency test of the judgment matrix
Because the comparison of the importance of indicators is subjective, a consistency test of the judgment matrix is required [20]. The inspection steps are as follows:
Among them, RI is the average random matching index. The smaller the CR, the better the consistency of the judgment matrix. When CR < 0.1, the difference of the judgment matrix is considered to be within the allowable range and has consistency.
Step 4. Get the combined weight vector
2.3.2. Objective Weight Calculation
The calculation of the target weight can use the entropy weight method. When the difference between the evaluation index values is larger, the entropy value is smaller, and the amount of information carried by the index is larger, and a larger weight can be given to it. In contrast, indexes carry less information.
The steps to determine the index using the entropy weight method are as follows:
Standardize the data.
Among them, yij is the j evaluation index [22]. Normalize the value on the i-rd evaluation subject, and yij ∈ [0, 1].
2.3.3. Combination Weight Calculation of AHP-Entropy Weight Method
3. Construction of Public Management System Indicators
3.1. Public Administration
Public administration is generally defined as the management activities of public organizations, especially government agencies, and the study of the law. Public administration is the activity of a public authority for the provision of public property and public services. It is more about obtaining results and their responsibility [24].
3.1.1. Essence
The essential meaning of public management is “public.” The theoretical system of public management consists of public meaning and classification system [25], as shown in Table 2.
| Essential connotation | Content |
|---|---|
| Main body of public administration | In other words, it is not private enterprises and private institutions, but public institutions such as the public sector, nonprofit sector, and third sector, as well as authoritative institutions with government administrative agencies as the core. |
| The nature of public administration | All public management of human society has the nature of implementing the will of the state and its subordinate government departments, maintaining the political order of the state, and displaying functions, procedures, elements, and processes in the form of actions. The nature of specific activities of public administration manifests itself differently in historical eras and under various developing political and economic systems. |
| Social responsibility and obligation of public management | Provide public services according to public needs. In addition, through a public responsibility mechanism with strict performance goals and performance management, it is ensured that the public management body is responsible to the general public in the competition, and the service quality and customer satisfaction are improved. |
Therefore, the essence of the significance of public management lies in strengthening and improving the responsibility mechanism of the public sector itself, establishing and developing a social public responsibility mechanism, and fulfilling its obligations through the public sector, so that the citizens can fully implement it. Uphold and fulfill their obligations and public good. Ultimately realize the interests of political domination, thereby strengthening and maintaining the existing basic social order and strengthening the social mobilization capacity and public solidarity of public agencies such as government public departments and nongovernmental agencies.
3.1.2. Main Features
There are four main characteristics of public management: public management is the activities that take place in public organizations; the basis of public management is public power; the main task is to provide public goods and public services to all members of society; public organizations achieve goals and achieve good results; the key is coordination, as shown in Table 3.
| Main features | Content |
|---|---|
| Public management is an activity that takes place in public organizations, and public management takes the realization of social public interests as its overall goal | This goal can be divided into several subgoals. Subgoals tend to be contradictory and contradictory, and these decisions and choices often affect the directionality of values that require balance and compromise. |
| The foundation of public management is public power, which is the guarantee for coordinating social and social resources. | Public power comes from the recognition and coercion of people by law. Therefore, public management should emphasize public responsibility and be overseen by society as a whole. |
| The main task of public management is to provide public goods and public services to all members of society. | Both tangible and intangible goods are included in public goods. Public services mainly include the provision of public safety and order, as well as the resolution and handling of safety issues. |
| The key to achieving goals and achieving good results in public organizations is adjustment. | Adjustment includes not only adjustment activities, but also adjustment activities between organizations and between organizations and societies. Since people are the center of various elements that make up people, various complex relationships in public institutions still exist among people, and adjustment activities are mainly carried out for people. People have both material and spiritual needs and are also affected by various social factors, so the means and methods of adjustment must be diversified. |
3.2. Mathematical Model of Public Administration
This paper derives the mathematical model of public management according to Bohr formula and Shannon formula.
3.2.1. Model Assumptions
The public management system is a relatively closed and isolated system with less information, energy, and material exchanges with the environment.
There are energy disparities within the public management system and are in a state of imbalance.
3.2.2. Mathematical Model Representation Method
Among them, Y is the efficiency of public management, R is the structural constant of public management, Xi is the function of the influencing factors of public management efficiency, and ai is the weight of each influencing factor.
3.3. Building a Public Management System
This paper builds a public management system model based on AHP, the target layer is public management, the middle layer is 2 first-level indicators and 8 second-level indicators, and the program layer is 25 third-level indicators, as shown in Figure 2.
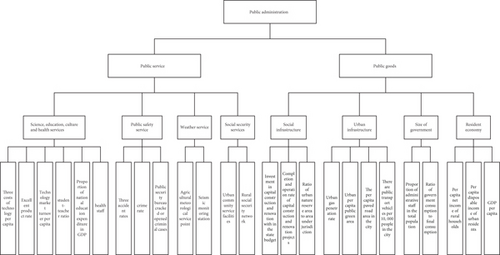
Figure 2 describes the overall indicator system, showing the classification and indicator names of different indicator systems. This allocation scheme has good scientific significance and can better evaluate the public management system.
3.4. Public Management System Indicators
According to the meaning and characteristics of public management, using the AHP, the public management system indicators are constructed from multiple levels, as shown in Table 4.
| Main target | First-level indicator | Secondary indicators | Three-level indicator |
|---|---|---|---|
| Public administration | Public service | (A) Education, science, culture, health services | A1: per capita science and technology three expenses |
| A2: product excellent rate | |||
| A3: technology market turnover per capita | |||
| A4: student-teacher ratio | |||
| A5: national education expenditure as a percentage of GDP | |||
| A6: health staff | |||
| (B) Public safety services | B1: three accident rates | ||
| B2: criminal case rate | |||
| B3: Public Security Bureau cracked or opened a criminal case | |||
| (C) Weather services | C1: agricultural meteorological service point | ||
| C2: seismic monitoring station | |||
| (D) Social security services | D1: urban community service facilities | ||
| D2: rural social security network | |||
| Public goods | (E) Social infrastructure | E1: state budget capital construction and improvement investments | |
| E2: capital construction and renovation project completion and commissioning rate | |||
| E3: ratio of urban nature reserve area to jurisdiction area | |||
| (F) City infrastructure | F1: city gas penetration rate | ||
| F2: city per capita public green area | |||
| F3: cities have paved road area per capita | |||
| F4: cities have public transport vehicles per 10,000 people | |||
| (G) government size | G1: administrative staff as a percentage of the total population | ||
| G2: ratio of government consumption to final consumption | |||
| (H) Resident economy | H1: per capita net income of rural households | ||
| H2: per capita disposable income of urban residents | |||
| H3: GDP per capita |
4. Experimental Analysis
4.1. Model Testing
This paper builds a public management system index model based on AHP (analytic hierarchy process). In order to test the effect of the model, a comparative experiment is used to compare the effect of this method with the big data analysis method and the original analysis method.
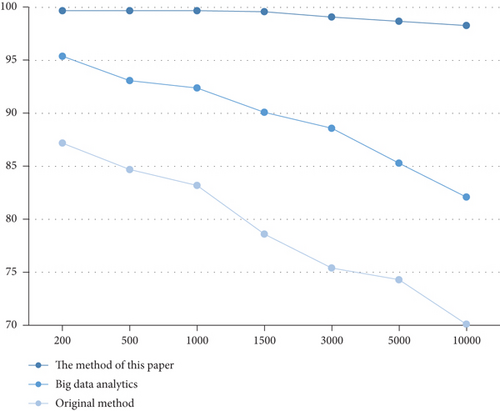
The experimental samples in the model test are set to 5 different data sets of different sizes, and other factors are excluded. The experimental samples are tested by the big data analysis method, the original method, and the method in this paper, and the accuracy and success rate of the three methods are compared, as well as response time. The results are shown in Table 5.
| Model | Data set | 200 | 500 | 1000 | 1500 | 3000 | 5000 | 10000 |
|---|---|---|---|---|---|---|---|---|
| The method of this paper | Accuracy (%) | 99.7 | 99.7 | 99.7 | 99.6 | 99.1 | 98.7 | 98.3 |
| Success rate (%) | 100 | 100 | 100 | 100 | 100 | 100 | 100 | |
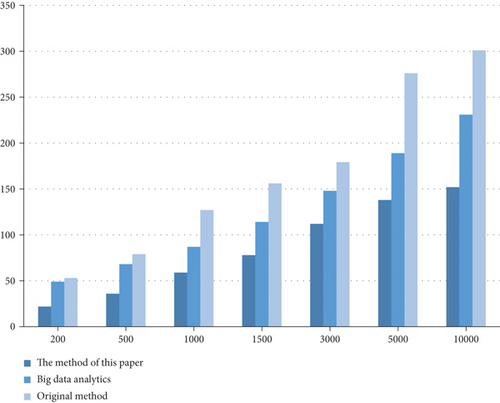
| Response time (ms) | 22 | 36 | 59 | 78 | 112 | 138 | 152 | |
| Big data analysis methods | Accuracy (%) | 95.4 | 93.1 | 92.4 | 90.1 | 88.6 | 85.3 | 82.1 |
| Success rate (%) | 100 | 99.5 | 99.4 | 98.6 | 98.3 | 97.8 | 97.3 | |
| Response time (ms) | 49 | 68 | 87 | 114 | 148 | 189 | 231 | |
| Original method | Accuracy (%) | 87.2 | 84.7 | 83.2 | 78.6 | 75.4 | 74.3 | 70.1 |
| Success rate (%) | 100 | 99.3 | 99.1 | 98.2 | 97.5 | 97.1 | 96.8 | |
| Response time (ms) | 53 | 79 | 127 | 156 | 179 | 276 | 301 |
According to the data in Figure 3, it can be concluded that the method in this paper has the highest accuracy in the 7 data sets tested, the highest accuracy rate is 99.7%, the highest accuracy rate of the big data analysis method is 95.4%, and the highest accuracy rate of the original method was 87.2%. It shows that the method in this paper has the highest accuracy and the best accuracy.
As can be seen from Figure 4, the correct rate of the method in this paper is 100%, while the correct rate of the big data analysis method and the original method is decreasing with the increase of the data set. It shows that with the increase of the data set, the accuracy of the big data analysis method and the original method cannot be guaranteed, and the accuracy will gradually decrease, which reflects the obvious advantages of the method in this paper.
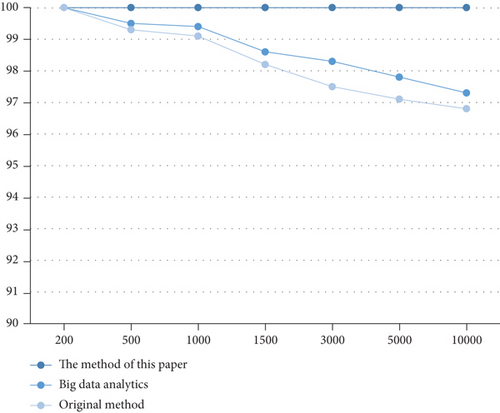
Figure 5 intuitively reflects the obvious advantages of the method in this paper. The minimum response time of the method in this paper is 22 ms, the minimum response time of the big data analysis method is 49 ms, and the minimum response time of the original method is 53 ms. Although the response time gradually increases with the increase of the data set, the method in this paper increases relatively slowly. There is a way.
4.2. Indicator Weights
The research scope of public management takes government departments as the main body, and the experimental analysis of index weights takes the government departments of a city as the research scope and the government staff as the research objects. 100 government workers were randomly selected as the research objects, the data was collected through questionnaires, and the final index weight of the public management system was obtained according to the analytic hierarchy process.
After calculating the collected questionnaire data through a series of steps of AHP, the weights of each indicator are obtained: the weights of public services and public goods in the first-level indicators are 0.56 and 0.44, respectively.
4.2.1. Secondary Indicators
The second-level indicators are obtained based on the first-level indicators. The weights of the indicators at each level in the second-level indicators are as follows: education, science, culture, health service 0.23, public safety service 0.42, meteorological service 0.17, social security service 0.18, social infrastructure 0.3, 0.25 for urban infrastructure, 0.13 for government size, and 0.32 for resident economy, as shown in Figure 6.
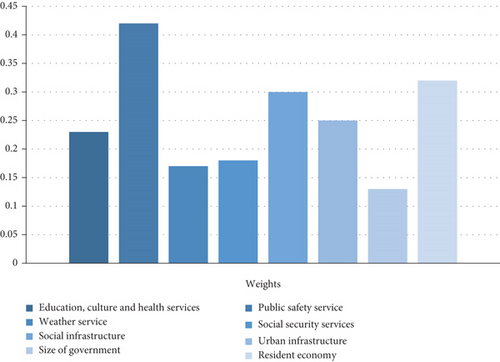
The weight of each secondary indicator is above 0.1, and most of them are between 0.15 and 0.25. The weight of public safety service is the highest, and the weight of government scale is the lowest. The index weights of public security services, social infrastructure, and residents’ economy are all greater than or equal to 0.3. The weight of each indicator is different, indicating that the focus of public management is different. From the weight of each indicator, it can be seen that safety is the most concerned issue, and the weight of public safety services accounts for 0.42. The safety of a city is its most important guarantee.
4.2.2. Three-Level Indicators
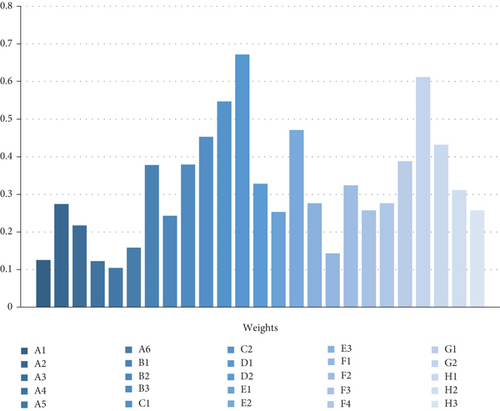
It can be seen from Figure 7 that the weight of each indicator is different, indicating that the importance of each indicator is different, and the focus of government management is also different. The weights of all three-level indicators are above 0.1, and the weights of C2, D1, and G2 are all above 0.5. The highest indicator weight is 0.672 for urban community service facilities. Most of the three-level indicators are concentrated between 0.2 and 0.4.
4.3. Reasonability Test
In order to determine whether the public management index system constructed in this article is reasonable, 10 experts were invited to evaluate the indicators established in this article, and the alpha coefficient of the test reliability and the S-value of the test validity were calculated according to the feedback from the expert CVI.
If the experimental results show that the α coefficients are all above 0.8, and the S-CVI values are all greater than or equal to 0.9, it indicates that the reliability and validity of the index system are good, and the index meets the standard and can be used. The data results are shown in Figure 8.
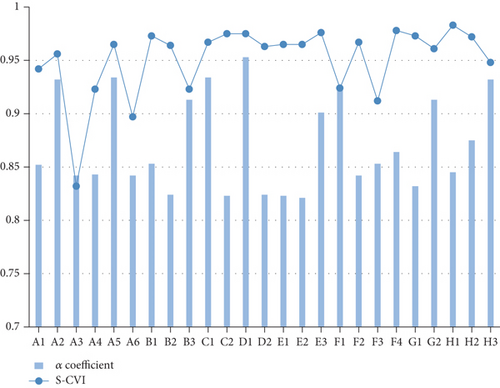
The data results show that the alpha coefficients of 25 tertiary indicators are all above 0.8, and the alpha coefficient of 9 tertiary indicators is above 0.9, which is the best level, indicating that the constructed public management indicator system has high reliability.
The average S-CVI of the third-level indicators is above 0.9, and the highest S-CVI is 0.983. Among them, the S-CVI of two indicators is below 0.9 but both are above 0.8, 0.832, and 0.897, respectively. It shows that the validity of the constructed public management index system is good.
Combining the results of α coefficient and S-CVI, it can be concluded that the public management index system constructed in this paper has good reliability and validity and has certain scientific rationality.
5. Conclusion
The public management system based on AHP refers to a major improvement of the public management index system and has great advantages compared with other methods in terms of accuracy, correctness, and response time. The Bohr formula, Shannon formula, and entropy weight method adopted in this paper have provided great help to the construction of the system on a certain basis. In the era of rapid economic development in my country, the indicators of public management system constructed in this article have brought new experience to the public management model.
- (1)
In the model testing stage, the accuracy rate of the method in this paper is the highest in different datasets, with the highest accuracy rate of 99.7%. It shows that the method in this paper has the highest accuracy and the best accuracy
- (2)
The correct rate of the method in this paper is 100%, while the correct rate of the big data analysis method and the original method both decrease with the increase of the data set, which reflects the obvious advantages of the method in this paper
- (3)
The minimum response time of the method in this paper is 22 ms, the minimum response time of the big data analysis method is 49 ms, and the minimum response time of the original method is 53 ms. Although the response time increases gradually with the increase of the dataset, the method in this paper increases slowly
- (4)
In the second-level indicators, the weights of indicators at all levels are above 0.1, mainly between 0.1 and 0.3, and the highest weight is 0.42 for public safety services
- (5)
The weights of all three-level indicators are above 0.1, and the weights of C2, D1, and G2 are all above 0.5. The highest indicator weight is 0.672 for urban community service facilities, and most of the three-level indicators are concentrated between 0.2 and 0.4
- (6)
The alpha coefficients of 25 third-level indicators are all above 0.8, of which 9 third-level indicators have alpha coefficients above 0.9, which are the best level. The average S-CVI of the third-level indicators is above 0.9, and the highest S-CVI is 0.983, and there are two indicators whose S-CVI is below 0.9 but above 0.8, 0.832, and 0.897, respectively. It shows that the constructed public management index system has high reliability and validity
It can be seen from the experimental results that public management attaches great importance to safety. The following focuses on improving the public management system reform plan, improving the public management awareness of employees, establishing a comprehensive social public management system, and paying attention to improving management and supervision. Ensure that people’s living standards and happiness are improved. Although the AHP-based public management system indicators have obvious advantages in all aspects, they still have certain limitations. This model is suitable for public management research. It is hoped that in the following research, in-depth research can be carried out on the scope of application to improve the scope of use of the model and increase the generality of the model.
Conflicts of Interest
The authors declared that they have no conflicts of interest regarding this work.
Open Research
Data Availability
The experimental data used to support the findings of this study are available from the corresponding author upon request.


