Evaluation of the Application of Maximum Radius in Horizontal Curves Using Vehicle Dynamic Simulation
Abstract
Most road design standards recommend using a spiral curve for transitions. The main advantages of using this curve are the gradual increase in the centrifugal force, creating a suitable space for presenting superelevation, and providing a correct perception of the curve for the driver. In this research, vehicle dynamic simulation software CarSim and TruckSim is used to assess the forces imposed on the vehicles. In this regard, 360 scenarios are considered for sedans, SUVs, and trucks, which consist of variations of the road geometry (simple or spiral horizontal curve), curve radius, and type and speed of the vehicle. In addition, the regression analysis is performed to examine the relationships between the lateral acceleration (as a dependent variable) and the vehicle speed, curve radius, and vehicle type (as independent variables). The results indicate that in all cases, safety in the spiral horizontal curve is greater than that in the simple horizontal curve, and the maximum side friction factor, lateral acceleration, roll rate, roll angle, yaw rate, and lateral distance in the simple horizontal curve are higher than those in the spiral horizontal curve. Moreover, the difference percentage of the side friction factor, lateral acceleration, yaw rate, and lateral distance between the simple and spiral horizontal curves is the highest in SUVs, followed by sedans and trucks, while the difference percentage of the roll rate and roll angle is the highest in sedans, followed by SUVs and trucks. The results of regression analysis illustrate that the coefficient of determination (R2) in the proposed model is 0.972, 0.964, and 0.981 for sedans, SUVs, and trucks, respectively, indicating the strong relationships between the dependent and the explanatory variables as well as the capability of the model to cover the data.
1. Introduction
The geometric design of horizontal curves is always one of the important factors in road accidents. Transition curves are one of the most important components of the geometric design in roadways, and their proper use can play an effective role in reducing accidents due to road geometric design defects. One of the most important curves used in road construction is the spiral curve [1, 2].
Every motor vehicle travels through a gradual transition path when entering or exiting a horizontal curve. The changes in driving and an increase or decrease in the lateral force cannot be applied instantaneously. The centrifugal force is instantaneously imposed on the vehicle at the crossroad of a tangent and a horizontal curve. Therefore, a transition curve should be utilized so that this defect is removed and the force is imposed gradually [3, 4]. Moreover, the superelevation should be provided in the curve so that the safe movement of the vehicle is feasible. Generally, the aim of constructing a spiral curve is to let the curvature and, consequently, the centrifugal force increase gradually. Otherwise, the centrifugal force is instantaneously applied to the vehicle, and the safety of the entering and exiting regions of the curve is affected [5, 6]. Therefore, the centrifugal force should be controlled by constructing a one-way grade to increase the safety of the curve. This one-way grade is called superelevation [7]. In simple horizontal curves, some portions of the superelevation are constructed in the tangent, and the remaining is constructed in the simple curve. Meanwhile, the superelevation is gradually constructed in the spiral section when utilizing the spiral curve before and after the curve. In simple curves, the lateral acceleration is instantaneously imposed on the vehicle and its passengers when entering the curve [8]. In addition, the variation of lateral acceleration is sensible when the superelevation is introduced prior to the curve and at the curve entrance and the safety is decreased [9]. A radius is introduced in the AASHTO Green Book as the application of the maximum radius in the spiral curve.
In this research, safety is assessed by analyzing the application of the maximum radius in a spiral curve. The relationship between the spiral curve used in horizontal curves and the side friction potential and the probable skidding and roll-over of the vehicle has not been quantitatively studied yet. The main problem is to increase the safety and decrease the accident rate considering the application of the maximum radius of the spiral curve in horizontal curves. So the aim of this study is to obtain the maximum radius of the spiral curve considering the vehicle safety in terms of skidding and roll-over using vehicle dynamic simulation software and to compare the obtained results to those obtained by equations (NCHRP 439) and tables represented in the AASHTO Green Book. Finally, the regression analysis is conducted to examine the relationships between the lateral acceleration as a dependent variable and the vehicle speed, curve radius, and vehicle type as independent variables.
2. Literature Review
A road with a design speed of 100 kilometers per hour and a radius of 600 meters is highly safe in NCHRP 439. The minimum lateral acceleration a is equal to 1.3 m/s2 using the expression of the maximum radius in the spiral curve considering the design speed of 100 kilometers per hour and radius of 600 meters [10]. The analysis of theoretical assessments in the field of superelevation runoff length in the simple curve in previous studies led to the fact that assigning suitable runoff length for the superelevation between the tangent and curve can reduce the mentioned movement difficulties [11]. The theoretical assessments performed in AASHTO show that the ratio of superelevation runoff length of 0.7 to 0.9 (70 to 90 percent) in the tangent reveals the best traveling condition. The exact value in this range depends on the design speed and the rotated width. Moreover, the use of a single value is acceptable for a proportion of the runoff length in the tangent in the range of 0.6 to 0.9 (60 to 90 percent) for all the speeds and rotated widths [12]. NCHRP 774 shows that the ratio of runoff length in the tangent in the range of 0.7 to 0.9 (70 to 90 percent) in roads with a downgrade lower than 4 percent provides the best traveling condition [10].
Marchionna reveals in a study that most design standards either recommend or believe it is necessary to use transition curves before and after circular curves. The transition curve that is usually recommended by well-known road design regulations is spiral [13]. Moreover, the California standard for designing highways indicates that using a spiral curve in horizontal curves is not a standard approach when designing highways [14]. England standard for designing highways and bridges reports that the spiral length should be limited to the length calculated by , where R is the curve radius (meter) and SLmax is the maximum length of the spiral curve [15]. NCHRP 439 also represents that the spiral length is a vital factor in design. The most desirable traveling condition is the one in which the spiral curve length is quite equal to the natural spiral path acceptable by most drivers [10].
Mehrara Molan used CarSim and TruckSim simulation software to assess the effect of combining the longitudinal grade with the horizontal curve on the safety factors such as side friction and lateral acceleration. They also studied the stability of various vehicles against skidding and roll-over. They identified the most dangerous section of a horizontal curve to be the entrance of the curve for a vehicle due to the changes in the steering angle and in the lateral acceleration. The effect of braking on the side friction factor of vehicles was also assessed. The results revealed that braking has a considerable effect on the side friction coefficient, especially in a sedan. Thus, braking is an important threat to the safety of sedans in terms of skidding and to the safety of trucks in terms of roll-over [16]. Qu et al. investigated the impact of roadway geometrics and speed on the lateral stability of a tractor-semitrailer on combined alignments of freeways using the TruckSim vehicle dynamic simulation model. The maximum wheel side friction demand and lateral load transfer ratio were used to measure the skidding and roll-over risks. Moreover, the effects of various impact factors on the lateral stability of the tractor-semitrailer were analyzed using statistical analysis. The results showed that the radius and speed have significant effects on the lateral stability, while the effect of the downgrade is of general significance. In addition, they indicated that lower safe speed should be adopted on wet road surfaces of a curved downgrade [17]. Abdollahzadeh Nasiri et al. conducted a research in which the safety aspect of horizontal curves under the standard of AASHTO is evaluated. Several factors, including vehicle weight, vehicle dimensions, longitudinal grades, and vehicle speed in the geometric design of curves, were investigated through a multi-body dynamic simulation process. According to the AASHTO, a combination of simple circular and spiral transition curves with various longitudinal upgrades and downgrades was designed. The analysis was based on the lateral friction between the tire and the pavement and also the safety margin parameter. The results showed that designers must differentiate between light and heavy vehicles, especially in curves with a high radius. Evaluation of longitudinal grade impacts indicated that the safety margin decreases when the vehicle is entering the curve. The safety margin reduction on the spiral curve occurred with a lower grade toward the simple circular curve. In addition, by increasing the speed, the difference between the lateral friction demand obtained from simulation and the lateral friction demand proposed by AASHTO grew [18]. Tavassoli Kallebasti et al. examined the lateral friction demand on roads with coincident horizontal and vertical sag curves. In this research, by utilizing vehicle multi-body simulation modeling, several scenarios were defined to assess the impact when horizontal curves are combined with vertical sag curves for three different kinds of vehicles (sedans, sports utility vehicles, and trucks). For various speed values, the maximum lateral friction demand between the road surface and vehicle tires was calculated. Finally, by using regression analysis, a model was presented according to the inputs and outputs of the simulation modeling to determine the maximum lateral friction demand created under various conditions. The results of this study indicated that the maximum lateral friction between the road surface and vehicle occurred when the lower part of the sag vertical alignment was located in the middle of the horizontal curve [19].
3. Methodology
In this study, by performing simulation tests using dynamic simulation software, the application of maximum radius in the spiral curve was analyzed. Figure 1 shows the research steps.
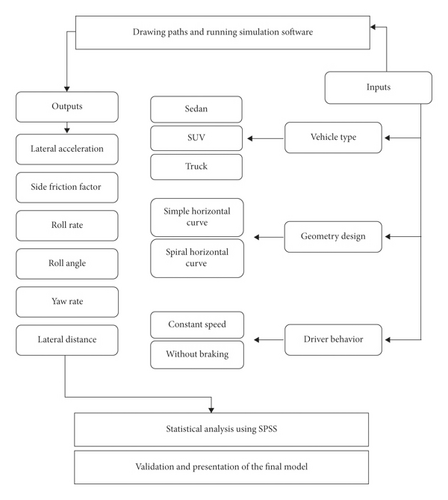
All the simulation tests were categorized in a way that 2 cases are based on the horizontal curve, 3 cases are based on the vehicle, 5 cases are based on the curve radius, and 12 cases are based on the vehicle speed, so the total number of tests would be 360 (the product of the mentioned numbers). Therefore, the application of the maximum radius of the spiral curve is analyzed by conducting 360 simulation tests using the vehicle dynamic simulation software CarSim and TruckSim. The path point coordinates (X, Y) in this research were obtained with Civil3D software, the path with the spiral curve was drawn, and the points were then delivered to the simulation software of CarSim and TruckSim. The inputs of the problem were three vehicle types, which were sedans class E, SUV class E, and truck, in addition to the road geometry, which had two cases of the simple horizontal curve (tangent-circle-tangent) and spiral horizontal curve (tangent-spiral-circle-spiral-tangent) [20]. Moreover, the driver behavior (without braking and with constant speed) was of inputs. Finally, the outputs of this research were lateral acceleration, friction coefficient, roll angle rate, roll angle, yaw rate, and lateral distance. According to the application of the maximum radius in the spiral curve, the percentages of the studied radii were from 70% to 130% of the maximum radius. The width of the road in this research was 3.6 meters, the maximum road superelevation was 8%, and the normal grade was equal to 2%. The vehicle speed was the one used in the table of the AASHTO Green Book.
3.1. Vehicle Type
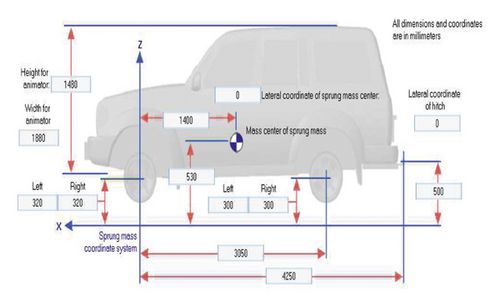
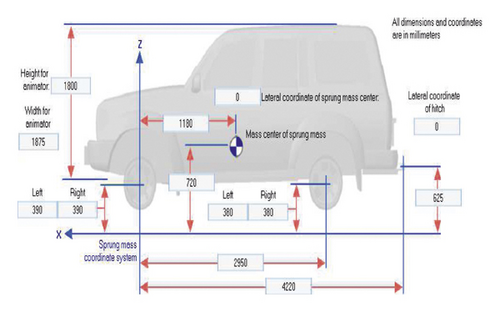
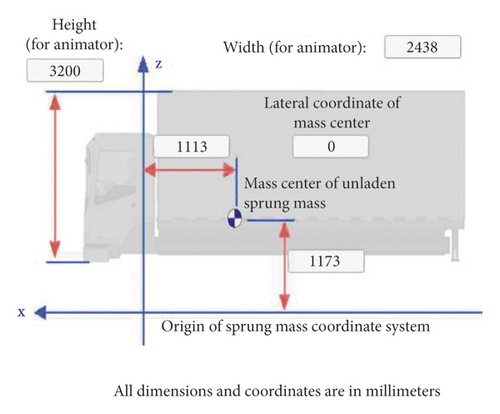
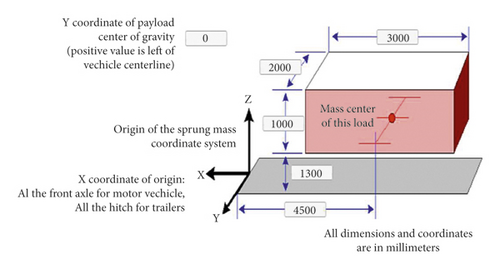
The vehicle type in this research consists of two categories: the first category comprises sedan class E and SUV, and the second category comprises two-axle truck, the properties of which are illustrated in Figures 2 and 3, respectively.
4. Results and Discussion
4.1. Side Friction Effect
Figure 4 shows a comparison between the side friction coefficients for various cases of simple and spiral curve radii versus the path length, where R is the maximum radius for using spiral and 0.7, 0.9, 1, 1.1, and 1.3 are the curve radius variation coefficients. Figure 4 shows that the lower the horizontal curve radius, the higher the side friction coefficient. For the simple horizontal curve, which consists of a tangent, circular curve, and the next tangent, the side friction coefficient in the tangent is constant from zero to near the superelevation beginning; it then decreases until 20 meters before the circular curve and increases from that point. In the primary section of the circular curve, the friction coefficient maintains its increasing trend until it reaches the maximum side friction of 0.066129. Then, it remains constant until the superelevation reduction, which is almost 10 meters, and then the friction coefficient starts decreasing in the last section of the circular curve. The reduction in the side friction coefficient continues in the last section, which is the tangent until it reaches the minimum value, which is -0.044154. Afterward, the friction coefficient increases until the last point of the superelevation and remains constant until the end of the path. Moreover, for the spiral horizontal curve, which is divided into a tangent, spiral, circular curve, and spiral, the side friction coefficient in tangent is constant in the tangent from the beginning of the path until 18 meters before the spiral and then it increases and continues to increase in the spiral section. The friction coefficient varies in three stages in the circular curve. In the first stage, the friction coefficient continues to increase until it reaches the maximum value of 0.065649; then, the friction coefficient remains constant, and it starts decreasing in the third stage. The friction coefficient maintains its decreasing trend in the spiral section after the circular curve, and then finally, the side friction coefficient remains constant in the tangent.
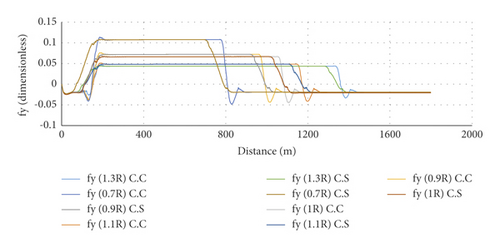
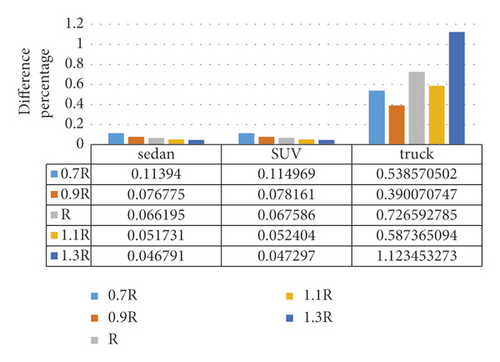
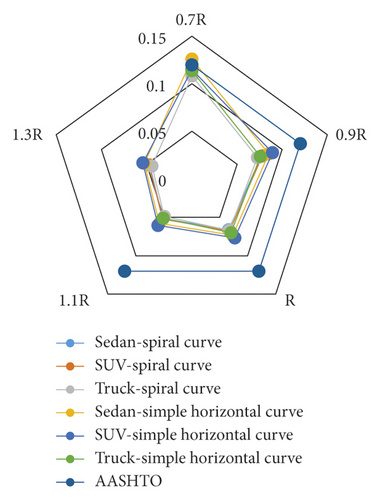
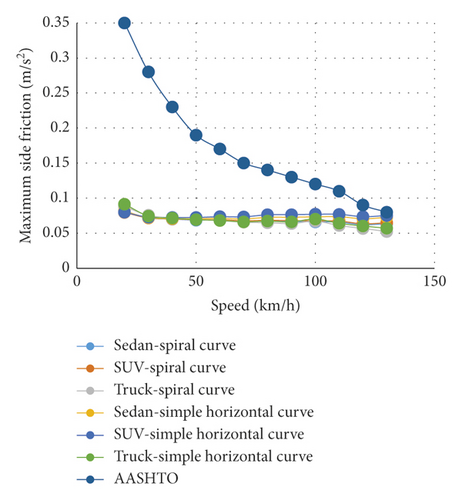
Figure 5 shows the difference between the maximum side friction coefficients in simple and spiral horizontal curves at a speed of 100 k/h. As can be seen, the lowest difference percentage with respect to the simple curve occurs at a radius percentage of 90% for trucks and 70% for sedans and SUVs. The AASHTO Green Book represents the maximum friction coefficient according to the speed of the vehicle. In this section, the values of the maximum friction coefficient for simple and spiral curves and for various radii are compared to those suggested by AASHTO, which is 0.12 for the speed of 100 k/h [12]. It can be realized that the maximum side friction coefficients of trucks in the simple and spiral horizontal curves in this research are lower than the values suggested by AASHTO for all speeds and all radius coefficients of 0.9, 1, 1.1, and 1.3. Moreover, the maximum side friction coefficients of SUVs and sedans in simple and spiral horizontal curves are lower than the values suggested for all speeds and radius coefficients of 1, 1.1, and 1.3. The maximum side friction coefficients of all three types of vehicles in the simple horizontal curves are higher than those suggested by AASHTO for a radius of 0.7R and speeds of 110, 120, and 130 k/h. In addition, the side friction coefficients in the spiral curve are higher than those suggested for speeds of 120 and 130 k/h. Meanwhile, speeds that were not mentioned were lower than those suggested by AASHTO. In a general conclusion from Figures 6 and 7, it can be illustrated that the maximum side friction coefficient of the spiral horizontal curve is lower than that of the simple horizontal curve for all the speeds. Thus, the spiral horizontal curve is better than the simple horizontal curve in terms of side friction coefficient. Figure 7 also shows that the higher the speed, the lower the maximum side friction coefficient. The maximum side friction coefficients of the simple and spiral horizontal curves are quite equal in the speed range of 30 to 70 kilometers per hour. Meanwhile, the maximum side friction coefficient of simple horizontal curve is higher than that of the spiral curve in the speed range of 70 to 130 kilometers per hour for all radii.
4.2. Lateral Acceleration
Another important factor associated with the safety of vehicles, especially their stability against roll-over, is the lateral acceleration imposed on the vehicle when traveling through a horizontal curve. Figure 8 shows the lateral acceleration for various radii of simple and spiral horizontal curves. The lateral acceleration in the simple horizontal curve is constant in the tangent from zero until near the beginning of the superelevation. It increases in the next section of the tangent until the beginning point of the circular curve. Then, it continues its increasing trend in the initial section of the circular curve until it reaches the maximum lateral acceleration, which is equal to 1.4021 m/s2. It is then constant through the circular path until the beginning of the superelevation increase. Finally, the lateral acceleration starts decreasing in the last section of the circular curve. In the last section of the path, which is the tangent, the reduction of the lateral acceleration continues until it reaches its minimum value of −0.12. Afterward, it increases until the last point of the superelevation, and then, it tends to zero in the last section. Moreover, in the spiral horizontal curve, the lateral acceleration is constant from the beginning of the path until 18 meters before the spiral and then it increases. It continues its increasing trend in the spiral section. The lateral acceleration varies in three stages in the circular curve. First, it continues to increase until it reaches its maximum value of 1.335 m/s2. In the second stage, the lateral acceleration is constant while it starts decreasing in the following stage. It continues its decreasing trend in the spiral section after the circular curve. The lateral acceleration remains constant in the tangent and then tends to zero. Moreover, the increasing trend of the lateral acceleration has a milder slope in the spiral horizontal curve. It also indicated that the lower the radius of the horizontal curve, the higher the lateral acceleration.
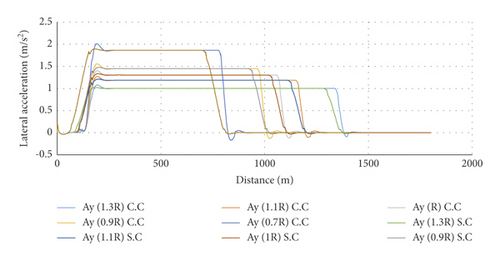
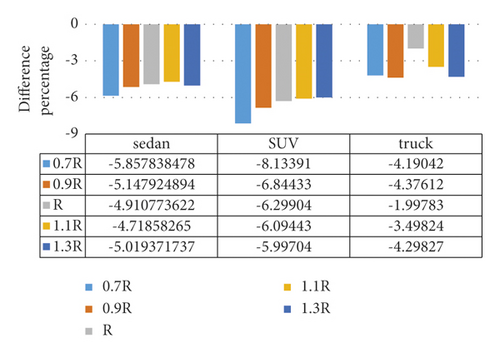
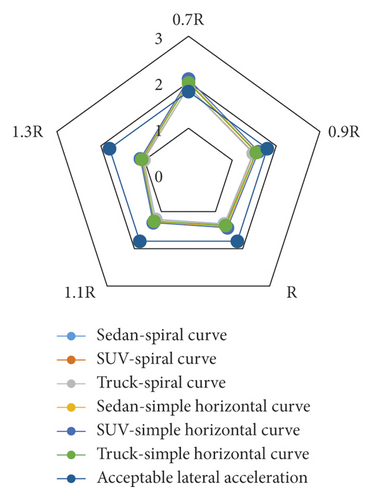
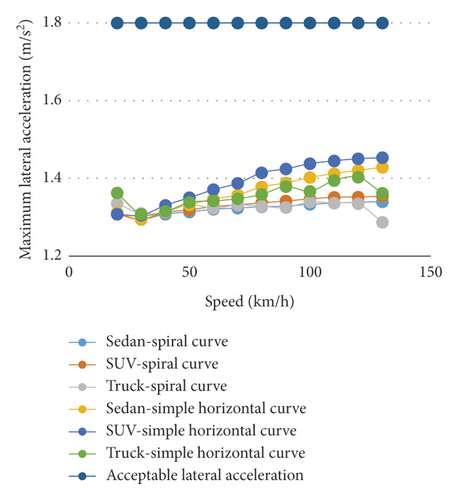
Figure 9 shows the difference percentage between the maximum lateral accelerations of the simple and spiral horizontal curves with respect to the simple horizontal curve for the speed of 100 km/h. Figure 9 reveals that the lowest difference percentage between the maximum lateral accelerations occurs at radii equal to 110%, 130%, and 100% of the maximum radius of spiral application for sedans, SUVs, and trucks, respectively. Moreover, Figure 10 illustrates that since the maximum lateral acceleration is lower than 1.8 m/s2 for all the speeds and for percentages of 90, 100, 110, and 130 in the simple and spiral horizontal curves, using these types of curves is acceptable. However, since the maximum lateral acceleration in the simple and spiral horizontal curves is higher than 1.8 m/s2 at a radius percentage of 70 for all the speeds, using these types of curves is not acceptable in this case. The lateral acceleration should be bounded to a range. The value of 1.8 m/s2 is accepted by all design standards around the world. A lateral acceleration in the range of 1.8 to 3.6 m/s2 is not recommended but is bearable, while the lateral acceleration of more than 5 m/s2 is unbearable by humans [12]. Furthermore, Figure 11 shows that as the speed increases, the maximum lateral acceleration increases. Besides, the maximum lateral acceleration in the simple horizontal curve is more than that in the spiral curve. The increase in the slope of the maximum lateral acceleration in the simple horizontal curve is higher than that in the spiral horizontal curve.
4.3. Roll Rate
Figure 12 shows the roll rate for various radii of simple and spiral horizontal curves. It can be seen that the roll rate tends to zero along the path length in a simple horizontal curve, except for locations where the superelevation is introduced. When the superelevation begins in the tangent, the roll rate reaches its maximum negative value of 1.733332 and tends to zero near the end of the superelevation increase. Moreover, the roll rate is dramatically increased in the last section of the circular curve and near the beginning of the superelevation reduction and it reaches its maximum positive value of 1.51 near the end of superelevation reduction. In the spiral horizontal curve, the roll rate reaches its maximum negative value of 1.563 at the beginning of the spiral and then, it tends to zero near the end of the spiral. In addition, it is dramatically increased near the beginning of the spiral and after the circular curve and reaches its maximum positive value of 1.582. The roll rate tends to zero near the end of the spiral, where the superelevation has a normal grade. Moreover, the maximum negative roll rate in the simple horizontal curve is greater than that of the spiral curve. As illustrated, the roll rate in the spiral curve reaches its maximum positive value near the beginning of the superelevation reduction when exiting the curve, while it reaches its maximum positive value near the end of the superelevation reduction in the simple horizontal curve. The main point is that the maximum positive roll rate in the spiral curve is higher than that of the simple curve.
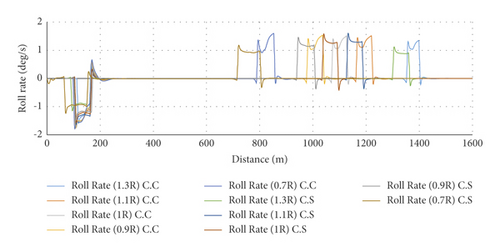
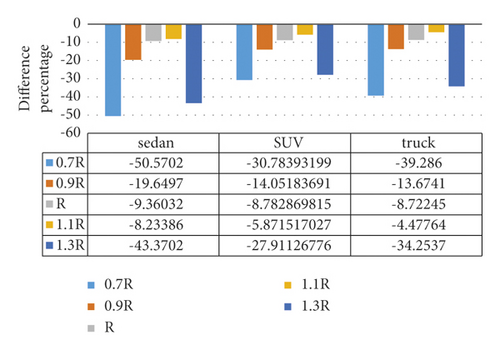
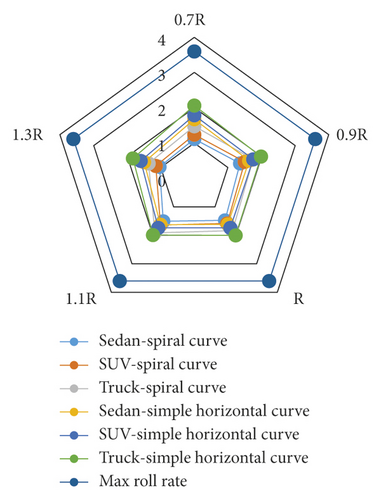
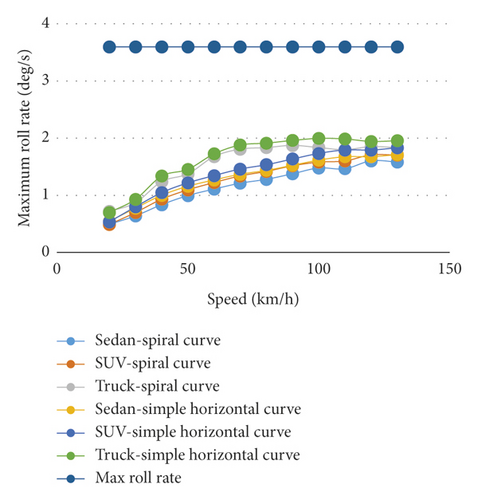
Figure 13 shows the difference percentage between roll rates in simple and spiral horizontal curves, which indicates that the lowest difference with respect to the values of simple curve occurs at a radius of 1.1R. Moreover, the difference percentage of the maximum roll rate between the simple and spiral horizontal curves with respect to the spiral horizontal curve has no certain pattern. Figure 14 indicates the maximum roll rates in the simple and spiral horizontal curves for various radii and the speed of 100 km/h. To evaluate and analyze it, the rate of 3.6 degrees per second is considered as the maximum roll rate for any vehicle type [21]. Figure 14 shows that the maximum roll rates in the spiral horizontal curve for SUVs and sedans at all speeds for the truck are lower than those in the simple horizontal curve. Moreover, Figure 15 indicates the maximum roll rate to the speed at radius R in the simple and horizontal curves for various speeds. Since the maximum roll rates in the simple and spiral horizontal curves are lower than 3.6 degrees per second for all the speeds, using these types of curves is acceptable in this case. However, the spiral curve is better than the simple one.
4.4. Roll Angle
Figure 16 shows the roll angle in the simple and spiral horizontal curves for various radii. All the values obtained from analyzing the roll are negative. The sign of these values indicates the direction of the roll angle. The counterclockwise is set to be positive, and the clockwise is set to be negative. Moreover, in left-turn curves, the roll imposed on the vehicle has a clockwise direction. The roll angle in the simple horizontal curve tends from zero at the beginning of the tangent to −1.52 at the beginning of the superelevation. It decreases in the next section of the tangent until the beginning point of the circular curve. In the first section of the circular curve, the roll angle decreases so that it reaches its maximum negative value, which is −3.93. It is quite constant in the circular curve until the beginning of superelevation runout. In the last section of the circular curve, it starts increasing. The increasing of the roll angle continues in the last section of the path, which is the tangent, and then, it decreases until the endpoint of the superelevation. After this, the roll angle tends to −1.24 in the last section. In the spiral horizontal curve, the roll angle tends to −1.52 from the beginning of the tangent until near the beginning of the spiral and it then decreases in the next section of the tangent. It continues to decrease in the spiral section. The roll angle varies in two stages in the circular curve. In the first stage, it continues to decrease until 4 meters after the spiral end so that it reaches its maximum value of −3.786, whereas it is constant in the second stage. The roll rate increases in the spiral section after the circular curve where finally, it remains constant in the tangent and tends to −1.24. It can also be realized from Figure 16 that the maximum roll rate in the simple horizontal curve is higher than that in the spiral horizontal curve. Besides, the increasing trend of the roll rate in the spiral horizontal curve has a milder slope.
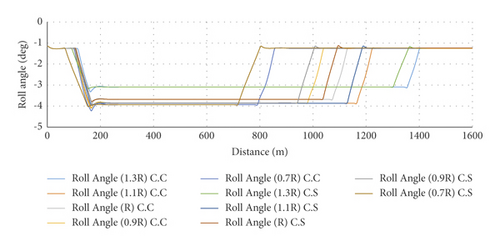
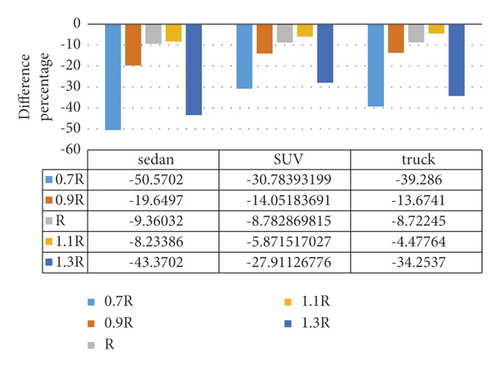
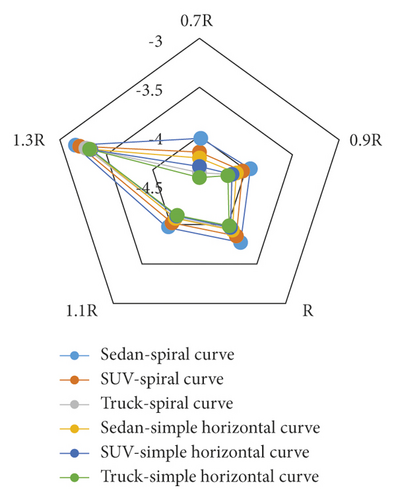
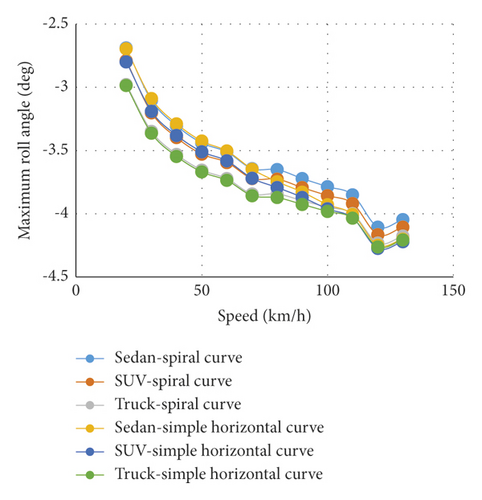
Figure 17 shows the difference percentage between the maximum roll angles in the simple and spiral horizontal curves for various radii and for the speed of 100 km/h. As can be seen, the lowest difference percentage with respect to the simple curve occurs at a radius equal to 1.1 of the maximum radius of the spiral application for vehicle types of sedan, SUV, and truck. Moreover, Figures 18 and 19 indicate the maximum roll angle in the simple and spiral horizontal curves. The maximum roll angles of sedans and SUVs at low speeds in the spiral horizontal curve are greater than those of the simple horizontal curve, while the maximum roll angle in the spiral horizontal curve is higher than that of the simple horizontal curve for high speeds. Meanwhile, the maximum roll angle of the truck in the spiral horizontal curve is greater than that of the simple horizontal curve for all speeds. In addition, the roll angle has a decreasing trend when the speed is increased. The maximum roll angles in the simple and horizontal curves are quite identical in the speed range of 30 to 70 km/h except for some situations where the maximum roll angle in the spiral horizontal curve is greater than that of the simple horizontal curve. The maximum roll angle in the spiral horizontal curve is lower than that of the simple horizontal curve for the speed range of 70 to 130 km/h.
4.5. Yaw Rate
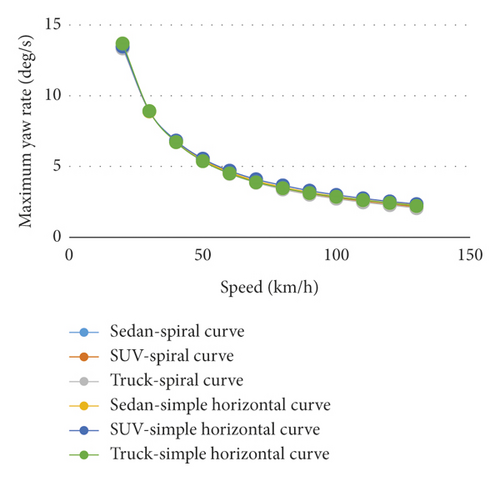
Another important parameter studied in this research is the yaw rate when traveling through the horizontal curve. In Figure 20, the yaw rate is presented in the various section of simple and spiral horizontal curves. In the simple horizontal curve, the yaw rate tends to zero in the primary section from point zero to 26 meters after the superelevation beginning, while it increases in the remaining part of the tangent. It continues its increasing trend in the first section of the circular curve until it reaches the maximum yaw rate of 2.994. It then remains constant in the circular curve until 10 meters before the superelevation reduction, while it starts decreasing in the last part of the circular curve. The decreasing of the yaw rate continues in the last section of the path, which is the tangent, until it reaches the minimum value of −0.293 deg/s. Afterward, the yaw rate increases until the last point of the superelevation. Finally, it remains constant in the last section and then tends to zero. For the spiral horizontal curve, the yaw rate tends to zero from the beginning of the path until 14 meters before the spiral and then, it increases in the next section of the tangent. It also continues its increasing trend in the spiral section. The yaw rate varies in three stages in the circular curve. In the first stage, the yaw rate still continues its increasing trend until it reaches the maximum value of 2.78. The yaw rate is constant in the second stage, whereas it starts decreasing in the third stage before the spiral (after the circular curve). It then continues its decreasing trend in the spiral section after the circular curve, and finally, it tends to zero in the tangent section. Moreover, the increasing trend of the yaw rate in the spiral horizontal curve has a milder slope.
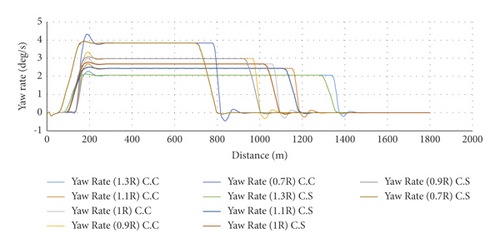
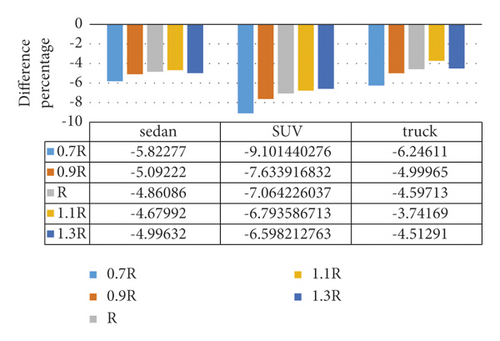
Figure 21 shows the difference percentage between the maximum yaw rates in the simple and spiral horizontal curves. The lowest difference percentages with respect to the simple horizontal curve occur at radii equal to 1.3 and 1.1 of the maximum radius of spiral application for SUV, and sedan and truck vehicles, respectively. The maximum yaw rates for all the vehicles in the spiral horizontal curve are lower than those in the simple horizontal curve. Figures 22 and 23 demonstrate the maximum yaw rates in the simple and spiral horizontal curves versus the speed at radius R. The results indicate that the maximum yaw rate has a parabolic decreasing trend when the speed is increased.
4.6. Lateral Distance
Figure 24 shows the lateral distance of the simple and spiral horizontal curves for various radii. The lateral distance in the primary section of the tangent in the simple horizontal curve is constant from zero until near the beginning point of the superelevation; then, it increases in the remaining part of the tangent until the beginning point of the circular curve. The lateral distance continues its increasing trend in the initial part of the circular curve until it reaches the maximum value of 0.144724. In the following, the lateral distance is quite constant in the circular curve until the superelevation reduction and then it starts decreasing in the last part of the circular curve. In the last section of the tangent and until the superelevation runoff, the lateral distance decreases and tends to zero in the last part. Figure 24 reveals that the lateral distance experiences a sudden but slight increase between the end of the circular curve and the superelevation runoff. Moreover, in the primary section of the tangent path for the spiral horizontal curve, the lateral distance tends to zero from the beginning until 18 meters before the spiral, and then, it increases in the next part of the tangent. In the spiral section, the lateral distance continues its increasing trend. The lateral distance varies in three stages in the circular curve. In the first stage, the lateral distance still continues to increase until it reaches the maximum value of 0.135615. In the second stage, it remains constant while it decreases in the third stage before the beginning of the spiral (after the circular curve). The lateral distance continues to decrease after the circular curve and in the spiral, and finally, it tends to zero in the tangent. It was also illustrated that the increasing trend of the lateral distance in the spiral horizontal curve has a milder slope compared to that in a simple horizontal curve.
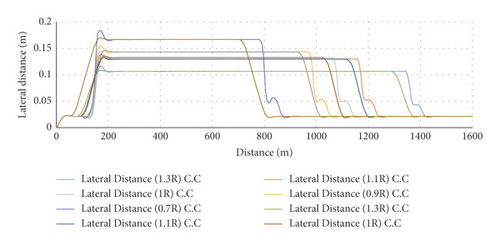
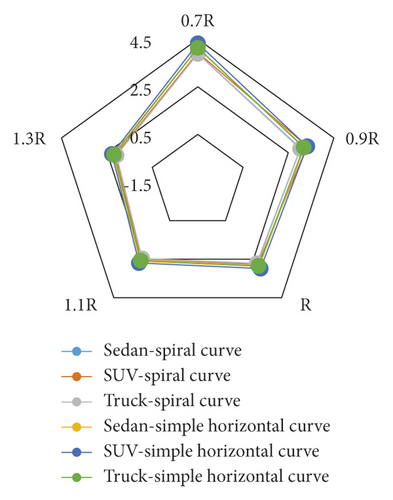
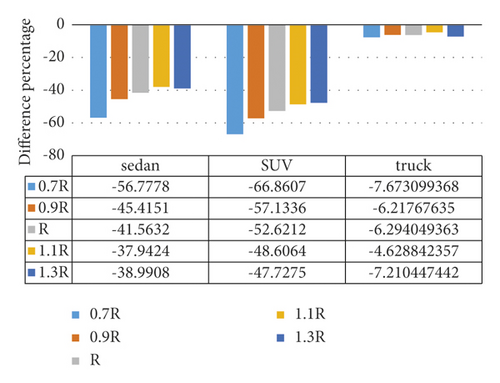
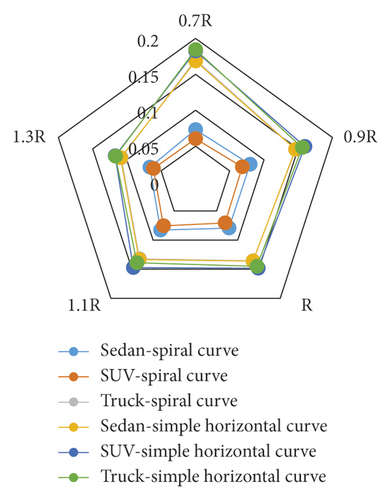
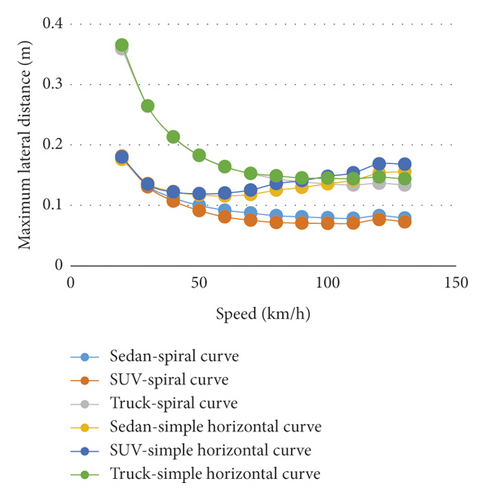
Figure 25 shows the difference percentage between the maximum lateral distances in the spiral and simple horizontal curves. The results indicate that the lowest difference percentages with respect to the simple horizontal curve occur at radii equal to 110% and 130% of the maximum radius of the spiral application for sedans and trucks, and SUVs, respectively. Figure 26 indicates that the maximum lateral distance in the spiral horizontal curve is lower than that of the simple horizontal curve for all the vehicle types and all speeds. In addition, Figure 27 illustrates the comparison between the lateral distances in the simple and spiral horizontal curves versus the speed at radius R, showing that the maximum lateral distance will obtain a decreasing trend if the speed is increased. The maximum lateral distances in the simple and spiral horizontal curves are quite identical for the speed range of 30 to 70 km/h, while after this speed range, the maximum lateral distance is higher in the simple horizontal curve compared to that of the spiral horizontal curve.
5. Lateral Acceleration Regression Model in the Simple Horizontal Curve
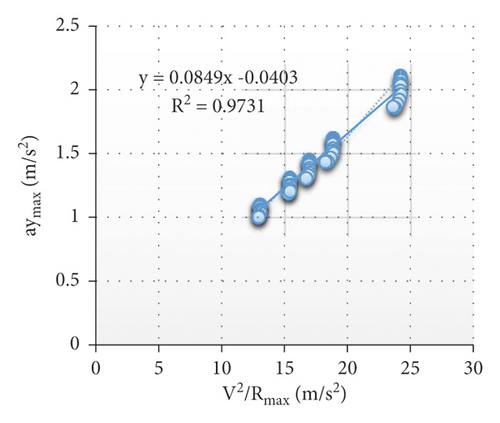
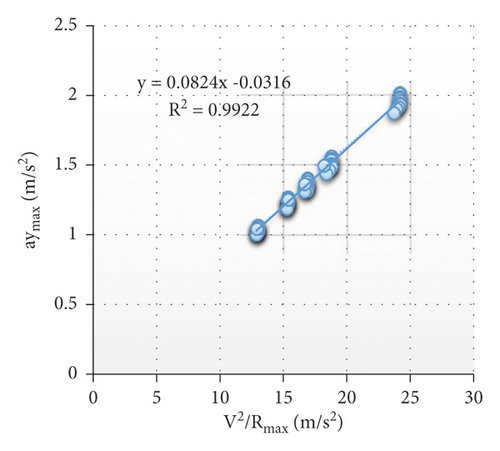
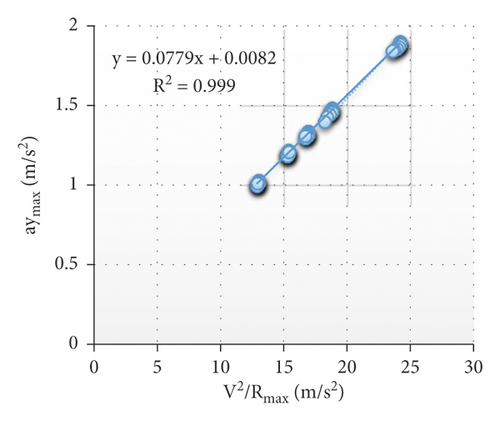
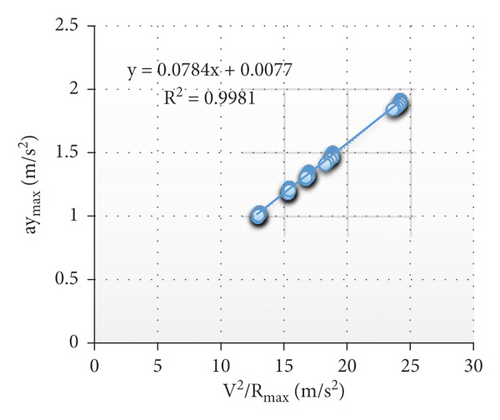
In this section, the regression relationships of lateral acceleration as a dependent variable according to the vehicle speed, curve radius, and vehicle type as independent variables are presented. In order to assess the regression model, firstly, the coefficients of the statistical model of the maximum lateral acceleration in the simple horizontal curve for all three vehicle types are presented in Table 1. In addition, the statistical summary of the intended model is represented in Table 2.
| Variable | Coefficient | ||
|---|---|---|---|
| Sedan | SUV | Truck | |
| Constant | −0.643 | −0.641 | −0.662 |
| Ratio of the square speed to curve radius | 0.056 | 0.056 | 0.056 |
| Test | Mean residual | Sig. | R2 | Durbin–Watson | ||||||||
|---|---|---|---|---|---|---|---|---|---|---|---|---|
| Sedan | SUV | Truck | Sedan | SUV | Truck | Sedan | SUV | Truck | Sedan | SUV | Truck | |
| Kolmogorov–Smirnov | −0.001424 | 0.00249 | 0.001285 | 0.00 | 0.00 | 0.00 | 0.972 | 0.964 | 0.981 | 0.728 | 0.849 | 0.82 |
The coefficient of determination (R2) defines how much of the whole change is determined by the regression model. The higher the value of this parameter, the stronger the relationship between the dependent and the explanatory variables. According to Table 2, the coefficient of determination in the proposed model is 0.972 for a sedan vehicle. In other words, the proposed model is capable of covering 97.2% of the data. The ratio of the regression variance to error variance can be calculated using F distribution. Proving the assumption of the regression variance being greater than the error variance proves that the regression is significant. Since the sig. value in Table 2 is lower than 0.05 for all three vehicles, the mentioned assumption is proved.
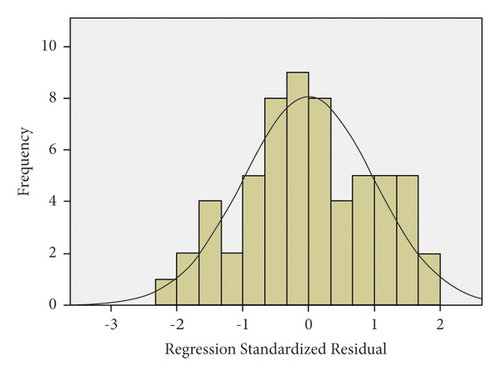
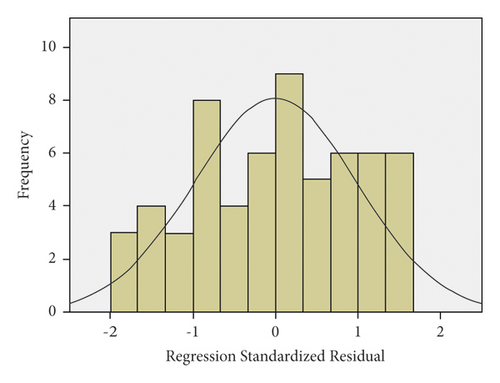
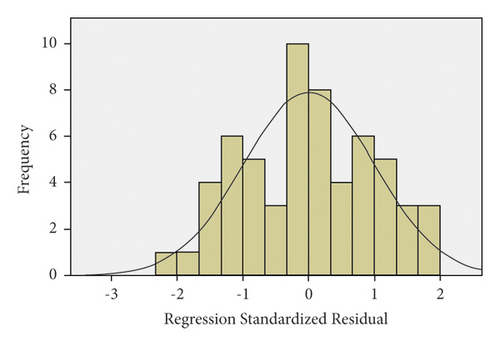
The residual distribution of the maximum lateral acceleration model is displayed in Figure 28. One of the initial assumptions is that the residual distribution is normal. It can be realized from Figure 28 that the assumption of residual being normal is proved. Moreover, residual values can be observed in Figure 29. In these diagrams, a better condition will be created if the residual values are closer to the line, which ensures that the residuals are normal. The farther the points are from the line, the more probable it is that the residuals would not be normal. In Figure 29, the assumption of residuals being normal is proved, considering that the residuals almost sit on the line for all three vehicles.
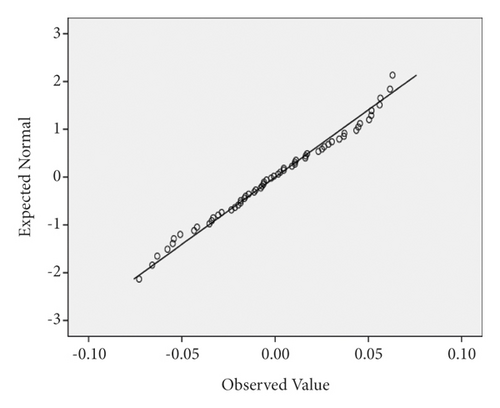
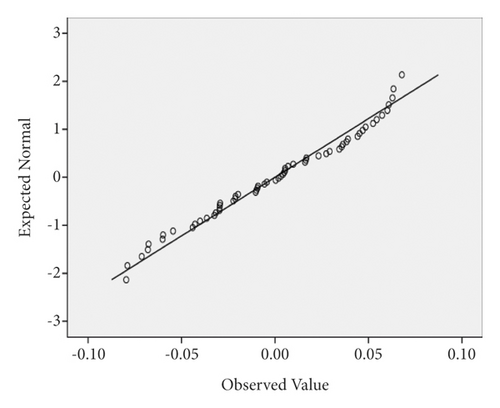
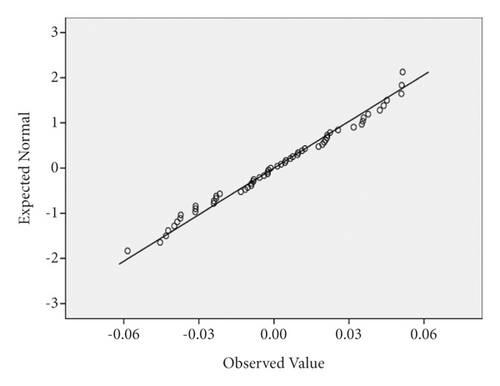
Another assumption that needs to be controlled and its validity should be checked is the mean error being zero. As can be seen from Table 2, the mean residual is nearly zero, so the considered assumption is true. Moreover, the Durbin–Watson test is used to prove the noncorrelation assumption of the residual. When the value of Durbin–Watson is lower than 1.5, the residuals are not independent of each other. As can be seen from Table 2, this value is 0.728, 0.849, and 0.82 for sedan, SUV, and truck vehicles, respectively. So the assumption of residuals being noncorrelated is not proved.
5.1. Mathematical Expressions of the Maximum Lateral Acceleration in the Simple Horizontal Curve
Since the assumption of residual being noncorrelated in the performed linear regression was not proved in the statistical model, the mathematical expressions were instead used to obtain desirable results, which will be described in the following.
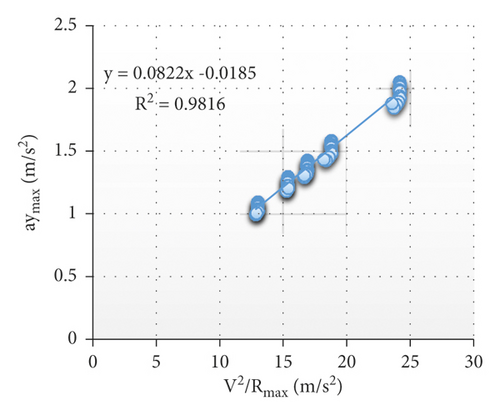
5.2. Mathematical Expressions for the Maximum Lateral Acceleration in the Spiral Horizontal Curve

6. Conclusion
- (i)
The maximum side friction coefficient in the simple horizontal curve is greater than that in the spiral horizontal curve in all vehicle types. Moreover, the friction coefficient increasing trend in the spiral horizontal curve has a milder slope. The maximum side frictions in simple and spiral horizontal curves are also lower than values suggested by AASHTO for the truck and for all radius percentages except for the radius of 70 percent. The spiral horizontal curve is better than the simple one in terms of side friction coefficient. In addition, the maximum side friction coefficients in the spiral horizontal curve are higher than the values suggested by AASHTO for speeds of 110, 120, and 130 km/h, while they are lower than the values suggested for the speeds that were not mentioned.
- (ii)
The maximum lateral accelerations in the simple horizontal curve are greater for all the vehicles compared to those in the spiral horizontal curve. In addition, the increasing trend of the lateral acceleration in the spiral curve has a milder slope. In sedans and SUVs and for all the studied radii, the maximum lateral acceleration slope increases faster in the simple horizontal curve compared to the spiral horizontal curve, while the increase in the maximum lateral acceleration of the truck has no certain pattern. The maximum lateral accelerations of all vehicle types in the simple and spiral horizontal curves are greater than 1.8 m/s2 for a 70 percent radius. Thus, using simple and spiral horizontal curves is not acceptable in this case. The spiral horizontal curve is better than the simple one in terms of bearing capability though.
- (iii)
In all vehicle types and for all radii, the roll rate in the spiral curve reaches its maximum positive value when exiting the curve and near the beginning of the superelevation runout, while in the simple curve, it reaches its maximum positive value near the end of the superelevation runout. The maximum roll rate in the simple horizontal curve is higher than that of the spiral horizontal curve for all the vehicles and at all radii and speeds. The maximum roll rate in the simple and spiral horizontal curves is less than 6.3 degrees per second for all vehicles, radii, and speeds. Thus, using simple and spiral horizontal curves is acceptable considering safety, although the spiral curve is better than the simple one.
- (iv)
The roll angle increasing trend in the spiral horizontal curve has a milder slope for all the studied vehicles. In sedans and SUVs and for all the studied radii, the maximum roll angle in the spiral horizontal curve is lower than that of the simple horizontal curve for all speeds except the speeds of 30, 40, and 50 km/h. Moreover, the maximum roll angle of the truck in the spiral horizontal curve is lower than that in the simple horizontal curve for all speeds.
- (v)
The yaw rate increasing trend in the spiral horizontal curve has a milder slope in all the vehicle types. In all the vehicles and for all radii, the maximum yaw rates in the spiral horizontal curve are lower than those of the simple horizontal curve for all speeds except for the speed of 20 kilometers per hour. Moreover, the difference percentage of the yaw rate with respect to the spiral curve decreases by decreasing the speed.
- (vi)
The lateral distance increasing trend in the spiral horizontal curve has a milder slope for all the vehicles. In the truck and for all radii, the maximum lateral distance in the simple horizontal curve is greater than that of the spiral horizontal curve. Moreover, the maximum lateral distances in the simple and spiral horizontal curves are very close to each other for the speed range of 30 to 70 km/h. In sedans and SUVs and for all radii, the maximum lateral distance in the simple horizontal curve is greater than the spiral horizontal curve. Besides, the difference percentage of the maximum lateral distance with respect to the spiral horizontal curve is considerably higher when compared to the truck.
- (vii)
results also indicated that the safety in the spiral horizontal curve is higher than that in the simple horizontal curve for all cases and radii, even for radii greater than the maximum radius in the spiral curve presented in the AASHTO Green Book.
- (viii)
It is suggested to include other vehicle types such as minibus, bus, 3-axle and 4-axle trucks, and even station wagons in the simulation to enhance the result accuracy. The longitudinal grade could also be taken into account in the analysis of the necessity of the maximum radius application in the spiral curve to extend the study in terms of safety. In case the field tests are possible, they are highly suggested so that the results and outputs needed to build a model are improved by comparing the results obtained from field tests and the simulation. Moreover, other machine learning methods [22–27], deep learning models [28, 29] and optimization techniques [30–32] can be incorporated into the proposed approaches to obtain more accurate results.
Conflicts of Interest
The authors declare that they have no conflict of interest. In this study, Iranian governmental organizations have not been partners and sponsors, and this study is purely studious.
Open Research
Data Availability
The data used to support the findings of this study are available from the corresponding author upon request.


