Movement Analysis and Action Optimization of Physical Education Teaching Practice Based on Multisensing Perception
Abstract
Correct and effective physical education teaching can not only improve students’ physical quality but also exercise students’ willpower, which is an important content to promote students’ all-round development. However, according to the current teaching situation in our country, in the actual teaching process, there is a situation of incongruity between teaching and sports development, which leads to the decline of the quality of physical education teaching in our country and affects the development of students’ comprehensive quality. Based on these problems, starting from the relationship between teaching and sports, this paper analyzes the coordinated development between physical education teaching and training in colleges and universities and builds a physical education teaching quality monitoring system. The research results of this paper show that (1) when using traditional recognition of various motion patterns, it can recognize various behavior patterns, and the average recognition accuracy is 90.1%. The accuracy is 94.3%. Compared with the traditional recognition mode, the average recognition accuracy is increased by 4.2%, and the recognition result is better. Compared with the recognition results of the first set of experiments, for the more difficult to distinguish upstairs and downstairs, the recognition accuracy is increased by 9% and 7%, respectively, and the recognition accuracy of backward is increased by 6%. (2) Before receiving the teaching, the test results of each index of the members of the routine group and the training group were basically the same, and there was no major difference. After the T-test was performed between the conventional group and the training group, the results showed that the P values of the evaluation results of the two groups were both above 0.05. The experimental results showed that the initial conditions of the two groups could be regarded as the same before receiving the teaching. Combining the evaluation results of the two groups before the training, we can conclude that under the condition that the initial conditions are basically the same, and the training conditions and environment are basically the same, the trainees who have received the mode training method have obtained better physical fitness indicators. The improvement and the effect are greatly optimized compared with the mode training. (3) Among the 8-spoke images captured by the experiment, the multisensor motion analysis model proposed in this paper has the highest action recognition accuracy. When the first picture is taken, the recognition accuracy is 98%. The recognition accuracy rate is also increasing, and when the eighth image is taken, the action recognition accuracy rate reaches 99%. Among the three different models, the multisensor motion analysis model proposed in the article has the shortest page response time. When the number of tests is 10, the average page response time is 0.4 seconds. When the number of tests increases to 70, the average page response time reaches 1.0 seconds, and the success rate of the multisensor motion analysis model has remained at 100%. The average response time will increase with the increase of the number of tests, and the experimental results also show that the detection performance of the multisensor motion analysis model is the highest.
1. Introduction
With the continuous reform and development of education in our country, the physical quality of our students is generally poor, and the institutional health of adolescents is not only related to individuals and families but also to the strength of society and the nation. At present, the reasons for the decline of the youth system in my country are caused by many factors, such as poor sports awareness and academic stress improvement. In the process of daily class, teachers should pay attention to the analysis of the accuracy of movements, so that students can fully understand the importance of sports. While improving students’ physical quality, they can also exercise students’ willpower. Literature [1] puts forward a good application for sports application and evaluation, especially from the theoretical basis of the evaluation system of physical education students’ practical ability in normal colleges and universities. Literature [2] relies on students and colleagues, and quantitative analysis combined with quantitative statistics reflects the quality of physical education teaching. Reference [3] uses the analytic hierarchy process to establish a physical education teacher’s teaching quality index system and assigns weights to it. Reference [4] illustrates the continuous development and application of artificial intelligence technology, which provides a new perspective for the reevaluation and setting of physical education teaching in schools and teachers. Reference [5] proposes to use inertial sensors to collect information about human motion and apply the collected information to analyze and identify human motion. Reference [6] discusses a theoretical framework for studying posture coordination strategies in standing. Reference [7] designed a human action recognition algorithm based on multifeature fusion and motion information. Reference [8] illustrates that physical exercise and positive attitudes towards physical activity must be one of the basic areas of activity in higher education institutions. Reference [9] analyzes the use of special equipment in the current special physical training and proposes the key elements that should be paid attention to and the principles that should be followed in the special physical training. Literature [10] adopts the methods of literature review and logical analysis to analyze the restrictive factors of physical education teaching environment. Reference [11] utilizes the latest powerful vision-based ego-motion estimation and uses a nonparametric Bayesian modeling approach to design an unsupervised learning model. Reference [12] is based on achievement goal theory and aims to verify the influence of the motivational climate of physical education on the motivation, interest, and intention of students to engage in physical activities or sports. Literature [13] investigated the relationship between teacher feedback and physical education performance, and the results showed that corrective, descriptive, normative, or positive feedback or feedback focused on skill outcomes may be associated with achievement. The findings in [14] showed a positive linear trend between the number of self-regulation phases that participants received training and their free-throw shooting performance and shooting adaptation. Literature [15] reviewed the literature on students’ physical education attitudes and discussed issues related to attitude measurement.
2. Physical Education Practice Movement Analysis and Movement Optimization
2.1. Problems Existing in the Reform and Development of Physical Education Teaching
Many students ignore the importance of physical exercise in their daily learning. The traditional teaching methods are limited to indoor teaching. Students lack extracurricular exercises and cannot exert their subjectivity in learning. First of all, we need to change the traditional concepts of teachers and students. Many people generally think that physical education is a course for relaxation and play, but ignore the importance of physical movement teaching. Wrong sports movements may cause damage to the human bones. In order to solve these problems, teachers can play relevant video explanations before the formal teaching, so that students can have a general understanding. In the formal teaching process, some games can be added to stimulate students’ enthusiasm for learning. Build a physical education teaching quality monitoring system, as shown in Table 1.
| Component | Content |
|---|---|
| Class preparation | Establish the learning objectives of physical education courses, including sports action analysis and action explanation [16]. |
| Select relevant background knowledge to help students build a new knowledge framework [17]. | |
| Explore flexible and diverse teaching methods and devices (e.g., multimedia). | |
| Design a variety of interactive teaching activities. | |
| Survey to understand students’ background and learning status. | |
| Invite some students to prepare lessons together. | |
| Teaching process | Use various forms of classroom introduction. |
| State the learning objectives of each lesson. | |
| Provide opportunities to use different learning strategies. | |
| Provide students with comprehensive use of listening, speaking, reading, writing, and translation activities [18]. | |
| Summarize teaching activities (including language goals and cultural goals). | |
| Evaluate teaching effectiveness through different activities. | |
| Reflection after class | Is it valid to import? |
| Are the learning objectives clear? | |
| Accurate preclass assessments of students. | |
| The success of the classroom activities. | |
| Whether teachers give feedback on students’ learning in a timely manner. | |
| Is there a link between classroom teaching and career goals [19]? |
2.2. Sports Action Analysis and Action Optimization
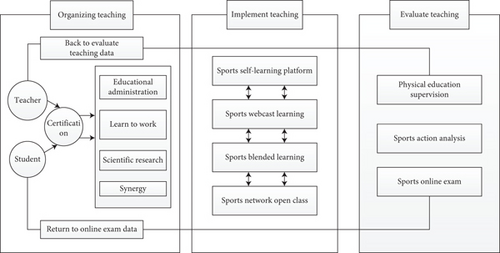
In teaching, teachers refine the scientific and step-by-step nature of teaching by analyzing the composition of action elements. It can be known from experience that these methods can make students’ learning efficiency have a positive meaning, because in the case of traditional teaching, teachers often have low requirements for students, and students’ enthusiasm for learning will also be reduced. It is not very important whether to learn or not to learn the knowledge of fur. Therefore, the understanding of movements is not in place, and it will not be improved in future learning. Therefore, teachers must use our skills in the process of teaching. Refinement and strict requirements will make students’ learning more meaningful. This is the basic principle that teachers should do. The construction of a physical education teaching quality monitoring system is shown in Figure 1.
3. Motion Analysis for Multisensing Perception
3.1. Motion Image Extraction Process
3.2. Motion Feature Extraction
3.3. Evaluation of Training Effect
4. Simulation Experiments
4.1. Comparative Experiment
In order to obtain objective characteristic data of various sports modes, the experiment selected 30 testers in a sports academy, including 15 males and 15 females. 30 testers will complete 8 types of exercise modes: standing, walking, running, going upstairs, going downstairs, lying down, lying flat, and going backwards. 30 testers complete the experiment at the same time and place. During the experiment, the behavioral habits of the testers are not restricted, and the testers can complete the training actions according to their own behavioral habits. The article adopts comparative experiments. The first one adopts the traditional human motion pattern information collection method, and the second adopts the motion pattern recognition method fused with accelerators and sensors. The experimental results of the two methods are shown in Table 2 and Table 3, respectively.
| Sport mode | Running | Walk | Top | Go downstairs | Lie down | Lie flat | Lying flat |
|---|---|---|---|---|---|---|---|
| Running | 190 | 4 | 2 | 1 | 2 | 1 | 0 |
| Walk | 1 | 180 | 7 | 5 | 7 | 0 | 0 |
| Top | 0 | 7 | 81 | 5 | 6 | 0 | 1 |
| Go downstairs | 0 | 6 | 7 | 83 | 4 | 0 | 0 |
| Back | 2 | 6 | 3 | 2 | 87 | 0 | 0 |
| Lie down | 5 | 0 | 0 | 0 | 3 | 92 | 0 |
| Lie flat | 5 | 1 | 0 | 1 | 0 | 0 | 93 |
| Sport mode | Running | Walk | Top | Go downstairs | Lie down | Lie flat | Lying flat |
|---|---|---|---|---|---|---|---|
| Running | 194 | 3 | 1 | 1 | 1 | 0 | 0 |
| Walk | 1 | 188 | 5 | 3 | 3 | 0 | 0 |
| Top | 0 | 3 | 90 | 4 | 3 | 0 | 0 |
| Go downstairs | 0 | 4 | 3 | 91 | 2 | 0 | 0 |
| Back | 0 | 3 | 2 | 2 | 93 | 0 | 0 |
| Lie down | 3 | 2 | 0 | 0 | 1 | 94 | 0 |
| Lie flat | 3 | 1 | 0 | 0 | 1 | 0 | 95 |
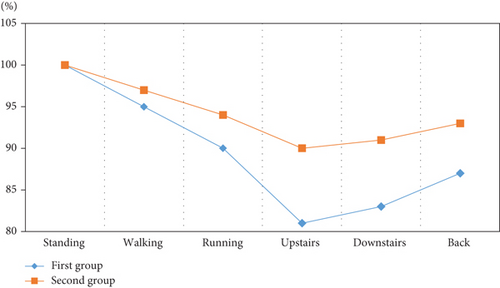
According to the data in Table 2 and Table 3, Table 4 lists the recognition accuracy in two different ways. Due to the high degree of distinction between standing and other actions, the recognition accuracy is 100%. The degree of discrimination is small, and the recognition accuracy is low. The specific identification data are shown in Table 4.
| Model | Standing | Walking | Running | Upstairs | Downstairs | Back | Down | Lying down |
|---|---|---|---|---|---|---|---|---|
| First group | 100% | 95% | 90% | 81% | 83% | 87% | 92% | 93% |
| Second group | 100% | 97% | 94% | 90% | 91% | 93% | 94% | 95% |
According to the experimental data in Figure 2, we can conclude that when using traditional recognition of various motion patterns, it can recognize various behavior patterns, and the average recognition accuracy is 90.1%. The average recognition accuracy is 94.3%. Compared with the traditional recognition mode, the average recognition accuracy is increased by 4.2%, and the recognition result is better. Compared with the recognition results of the first set of experiments, for the more difficult to distinguish upstairs and downstairs, the recognition accuracy is increased by 9% and 7%, respectively, and the recognition accuracy of backward is increased by 6%.
4.2. Specific Data Analysis
In order to study the sports situation of students after physical education teaching, the experiment selected 40 students to test the standard degree of sports movement and divided 40 student volunteers into two groups. The experiment will compare the results of physical education assessment with and without teaching and analyze the differences between the two comparison experiments. The 40 students selected in the experiment are basically the same in height, weight, and age, and the P values are all greater than 0.06, indicating that the experiment can ensure that the conditions of the two groups can be regarded as basically the same, so the experiment can exclude the error caused by the body and other elements in the experimental results. The basic statistics of student volunteers are shown in Table 5 and Figure 3.
| Regular group | Training group | P value | T value | |
|---|---|---|---|---|
| Height (cm) | 175 ± 2.00 | 175 ± 1.41 | 1.100 | -0.150 |
| Weight (kg) | 70.10 ± 2.61 | 70.10 ± 2.17 | 0.978 | -0.087 |
| Age | 16.6 ± 0.51 | 17 ± 0.00 | 0.701 | -2.049 |
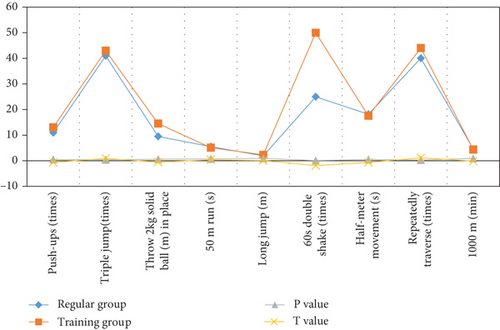
According to the experimental results in Table 6, we can know that before receiving the teaching, the test results of various indicators of the members of the routine group and the training group are basically the same, and there is no major difference. In the push-up test, the routine group can reach 11 times in one minute, the training group can reach 13, the triple jump routine group can reach 41, and the training group can reach 43. After throwing a 2 kg medicine ball on the spot, the routine group can reach 9.5 meters, and the training group can reach 14.5 meters. The 50-meter running routine group can reach 5.5 seconds, the training group can reach 5.1 seconds, the long jump routine group can reach 1.9 meters, the training group can reach 2.3 meters, the 60s double-shake routine group can reach 25 times, the training group can reach 50 times, the half-meter movement routine group can reach 18.2 seconds, the training group can reach 17.5 seconds, repeated 40 times across the conventional group and 44 times in the training group, and the control group can reach 1000 meters for 4.59 minutes and 4.35 minutes in the experimental group. After the T-test was performed between the conventional group and the training group, the results showed that the P values of the evaluation results of the two groups were both above 0.05. The experimental results showed that the initial conditions of the two groups could be regarded as the same before receiving the teaching.
| Test content | Regular group | Training group | P value | T value |
|---|---|---|---|---|
| Push-ups (times) | 11.0 | 13.0 | 0.512 | -0.673 |
| Triple jump (times) | 41.0 | 43.0 | 0.378 | 0.911 |
| Throw 2 kg solid ball (m) in place | 9.5 | 14.5 | 0.611 | -0.521 |
| 50 m run (s) | 5.5 | 5.1 | 0.685 | 0.414 |
| Long jump (m) | 1.9 | 2.3 | 0.920 | 0.102 |
| 60s double shake (times) | 25.0 | 50.0 | 0.081 | -1.880 |
| Half-meter movement (s) | 18.2 | 17.5 | 0.495 | -0.701 |
| Repeatedly traverse (times) | 40.0 | 44.0 | 0.262 | 1.168 |
| 1000 m (min) | 4.59 | 4.35 | 0.887 | -0.144 |
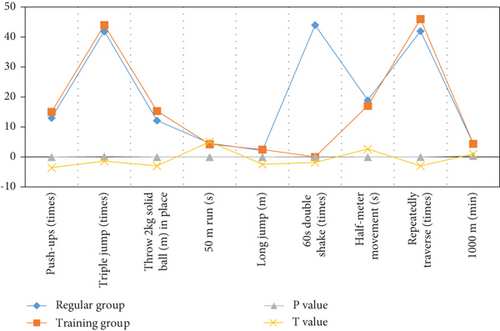
As can be seen from Table 7 and Figure 4, by analyzing the evaluation results between the conventional group and the training group, the overall situation of the members of the conventional training group was slightly improved compared with the pretraining test. The P values of the test scores of meter running, long jump, half-meter movement, and repeated crossing tests are all less than 0.05, indicating that there is a large gap between the two. Among them, the P value of the 50-meter running is less than 0.000, which has a very significant difference, while the triple jump has a significant difference. The P value of 60s and 60s double shake is greater than 0.05, and it can be seen that the difference between the conventional group and the training group after these two tests is not significant. Combining the evaluation results of the two groups before the training, we can conclude that under the condition that the initial conditions are basically the same, and the training conditions and environment are basically the same, the trainees who have received the mode training method have obtained better physical fitness indicators. The improvement and the effect are greatly optimized compared with the mode training. It is shown in Table 8.
| Test content | Regular group | Training group | P value | T value |
|---|---|---|---|---|
| Push-ups (times) | 13.0 | 15.0 | 0.003 | -3.578 |
| Triple jump (times) | 42.0 | 44.0 | 0.192 | -1.372 |
| Throw 2 kg solid ball (m) in place | 12.1 | 15.3 | 0.009 | -3.026 |
| 50 m run (s) | 4.6 | 4.2 | 0.000 | 5.062 |
| Long jump (m) | 2.1 | 2.5 | 0.028 | -2.456 |
| 60s double shake (times) | 44.0 | 52.0 | 0.086 | -1.864 |
| Half-meter movement (s) | 18.9 | 17.1 | 0.018 | 2.677 |
| Repeatedly traverse (times) | 42.0 | 46.0 | 0.010 | -2.973 |
| 1000 m (min) | 4.4 | 4.36 | 0.335 | 0.998 |
| 1 | 2 | 3 | 4 | 5 | 6 | 7 | 8 | |
|---|---|---|---|---|---|---|---|---|
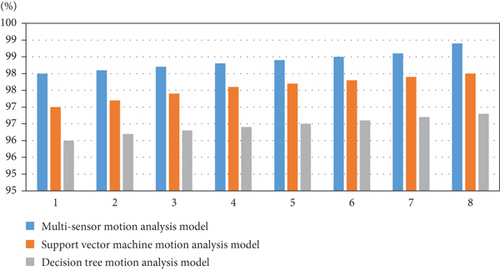
| Multisensor motion analysis model | 98% | 98.1% | 98.2% | 98.4% | 98.5% | 98.6% | 98.6% | 99% |
| Support vector machine motion analysis model | 97% | 97.2% | 97.4% | 97.6% | 97.7% | 97.8% | 97.9% | 98% |
| Decision tree motion analysis model | 96% | 96.2% | 96.3% | 96.4% | 96.4% | 96.5% | 96.7% | 96.8% |
4.3. Model Testing
In order to verify the performance of the action analysis model based on multisensor perception proposed in the article, the experiment compares the performance of the proposed model with the support vector machine motion analysis model and the decision tree motion analysis model. Starting from two aspects, observe the detection results of 3 different models. The experimental method to test the correct rate is to shoot 8 images on the same circuit board at different distances, select the one with the closest shooting distance as the template, and test the remaining 7 sets of images with different scale multiples one by one, matching the accuracy of the model. The way to detect page response time for different models is to continuously increase the number of tests and observe the average response time of different models. The specific experimental data are as follows:
According to the experimental results in Figure 5, we can conclude that among the 8-spoke images captured in the experiment, the multisensor motion analysis model proposed in this article has the highest action recognition accuracy. When the first picture is taken, the recognition accuracy is 98%. With the increase in the number of pictures taken, the accuracy of action recognition also increases. When the eighth picture is taken, the accuracy of action recognition reaches 99%. The recognition accuracy of the decision tree motion analysis mode is the lowest among the three models. When the eighth picture is taken, the recognition accuracy is the highest, which can reach 96.8%. The recognition accuracy of the support vector machine motion analysis model is between the two. The statistical results of page response time are shown in Table 9.
| Model | Testing frequency | 10 | 20 | 30 | 40 | 50 | 60 | 70 |
|---|---|---|---|---|---|---|---|---|
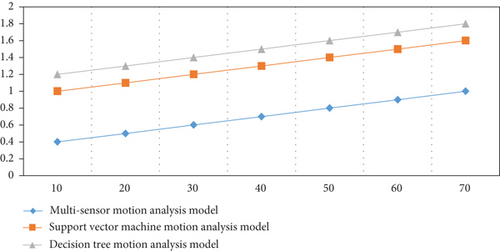
| Multisensor motion analysis model | Average response time (MS) | 0.4 | 0.5 | 0.6 | 0.7 | 0.8 | 0.9 | 1.0 |
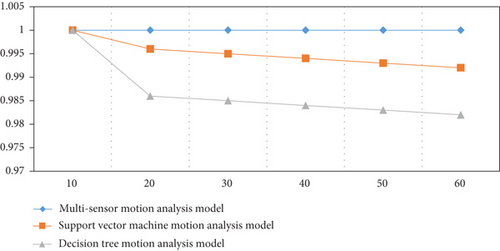
| Success rate (%) | 100 | 100 | 100 | 100 | 100 | 100 | 100 | |
| Support vector machine motion analysis model | Average response time (MS) | 1.0 | 1.1 | 1.2 | 1.3 | 1.4 | 1.5 | 1.6 |
| Success rate (%) | 100 | 99.6 | 99.5 | 99.4 | 99.3 | 98.4 | 99.3 | |
| Decision tree motion analysis model | Average response time (MS) | 1.2 | 1.3 | 1.4 | 1.5 | 1.6 | 1.7 | 1.8 |
| Success rate (%) | 100 | 98.6 | 98.5 | 98.4 | 98.3 | 98.2 | 98.1 |
According to the data in Table 9, Figure 6, and Figure 7, we can conclude that among the three different models, the multisensor motion analysis model proposed in this article has the shortest page response time. When the number of tests is 10, the average page response time is 0.4 seconds. When the number of tests increased to 70, the average response time of the page reached 1.0 seconds, and the success rate of the multisensor motion analysis model remained at 100%. The average response time of the decision tree motion analysis model is the longest. When the number of tests reaches 70, the average response time of the page is 1.8 seconds, and the success rate remains within 99% to 100%.Support vector machine analysis model average response time. In between, the success rate generally remains in the 98% to 100% range. The average response time will increase with the increase of the number of tests, and the experimental results also show that the detection performance of the multisensor motion analysis model is the highest.
5. Conclusion
Physical education course teaching is a highly practical course, and both teaching and learning are interdependent and inseparable [25]. Today, we are in a new century dominated by economy. The development of computer computing has spread to all corners of society, and advanced technological development has shown its advantages in various fields. Therefore, our educational methods must also be carried out to a certain extent reform. In terms of sports and sports talent training, my country has also integrated Internet thinking into physical education. It can be seen from the policy instructions that the country is paying more and more attention to the development of sports. In the future research work, in the growth process of young people, we should not pay attention to their achievements, but should pay attention to their physical health and mental health and realize the all-round development of young people. The government should give sufficient financial support to ensure diversified development of adolescent health.
Conflicts of Interest
The authors declared that they have no conflicts of interest regarding this work.
Open Research
Data Availability
The experimental data used to support the findings of this study are available from the corresponding author upon request.


