Influence of Imperfect Faraday Rotation Mirror on All-Fiber Optic Current Sensor
Abstract
The effects of the Faraday rotation mirror on the all-fiber optic current sensor (AFOCS) are studied in this paper. The reflectivity degradation of FRM with the long-term operation, the misalignment of the optical axis between FRM and the sensing fiber, and the influence of temperature fluctuation on FRM are modeled and simulated in this paper. The effect of temperature is the biggest obstacle to the application of the Faraday rotation mirror, while other factors can be easy to overcome by the data processing method. The experiments are designed and realized for verification. The temperature fluctuation range is related to the measured electric current to satisfy the required accuracy for IEC 60044-8 class 0.2S.
1. Introduction
With many unique advantages compared to traditional sensors, optical fiber sensors have been studied and applied to many different areas [1–5]. As a potential substitute for the traditional electromagnetic current transformer in power industry, the all-fiber optic current sensor (AFOCS) has many advantages, e.g., immunity against electromagnetic interference, high sensitivity, wide dynamic range, measuring AC and DC simultaneous, light weight, and small size [6, 7]. Due to these intrinsic advantages, AFOCS has been widely used in many electric current measurement fields, such as the electrolytic aluminium industry [8], high voltage direct current transmission system [9], international thermonuclear experimental reactor [10], and ship leakage current measurement [11].
Accuracy is one of the most important factors restricting the rapid development of AFOCS. Therefore, improving the accuracy has attracted the attention of many researchers. The first factor that affects the accuracy is the imperfect device. The defective manufacture of the polarizer [12] and polarization-dependent crosstalk [13] will affect the extinction ratio and lead to the relative error. The second factor is the principal axes angle offsets, which are the essential factors affecting the output errors of AFOCS [14, 15]. The last factor is the external interference, such as the temperature and vibration, which will affect the relative error and scale factor [16, 17]. However, there is little literature on the reflection unit [18].
The influence of the Faraday rotation mirror (FRM) on AFOCS focuses on two aspects. One is the reflected light energy, which affects the light intensity detected by the photodetector, while the light intensity affects the signal-to-noise ratio [19]. The other is to adjust the polarization state of reflected light, eliminate the influence of reciprocal linear birefringence, and improve the system accuracy [20]. However, due to the limitation of the manufacturing process level, FRM is usually imperfect [21]. At the same time, FRM is sensitive to temperature [22], and the polarization characteristics of silver thin film mirror typically change with the ambient temperature [23]. Therefore, the features of FRM must be affected by the temperature. In this paper, the influence of FRM on relative error is investigated by modelling and simulation. Experiments were designed and realized to verify the theoretical analysis and measure the temperature coefficient of FRM. Finally, the comprehensive influence of FRM on AFOCS is obtained.
The remainder of the paper is organized as follows. Section 2 is about the operation principle. The optical design and the data processing method are briefly introduced in this part. Section 3 is the modelling and simulation. We modeled and simulated the influence of FRM on the system accuracy by reflectivity, the misalignment of the optical axis, and the temperature. The experiment and discussion are in Section 4. The last section is the conclusion.
2. The Operating Principle
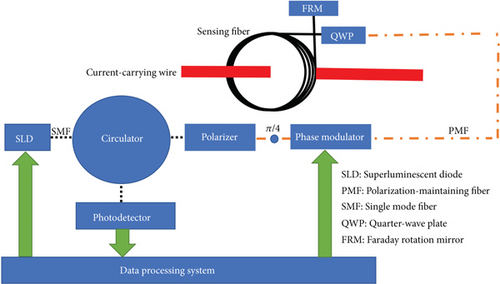
As the most mature structure of AFOCS, the reflective interferometer current sensor is mainly composed of a light source, an optical system, and a data processing unit [6]. As the key of the optical system, the sensing head usually includes a quarter-wave plate, a sensing fiber ring, and a reflection unit. A phase modulator is introduced to improve the anti-interference ability of the system with phase modulation technology [24]. The structure of AFOCS is shown in Figure 1.
3. Modeling and Simulation
3.1. Effect of Reflectivity
The reflectivity of FRM is 100% and 99% in the perfect and actual conditions, respectively. The relationship between the relative error and the reflectivity is shown in Figure 2.
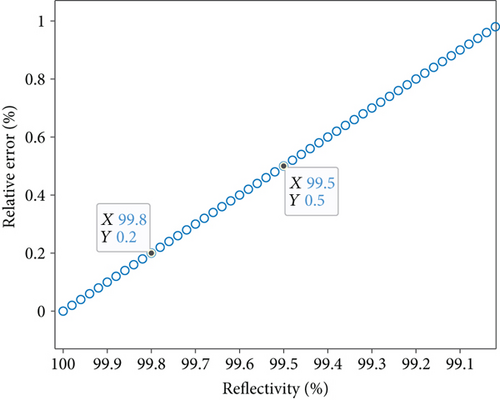
The relative error will increase as the reflectivity of FRM declines, as shown in Figure 2. When the reflectivity drift is over 0.2%, AFOCS cannot satisfy the required accuracy for IEC 60044-8 class 0.2S [26].
3.2. Effect of the Misalignment of Optical Axis
FRM consists of a nonreciprocal 45 deg rotator (45 deg Faraday rotator) followed by a coated mirror [20, 21], as shown in Figure 3.
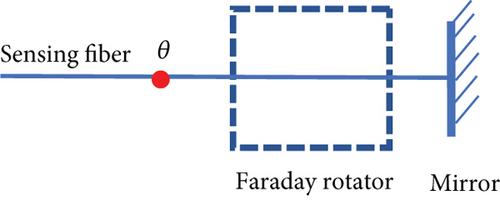
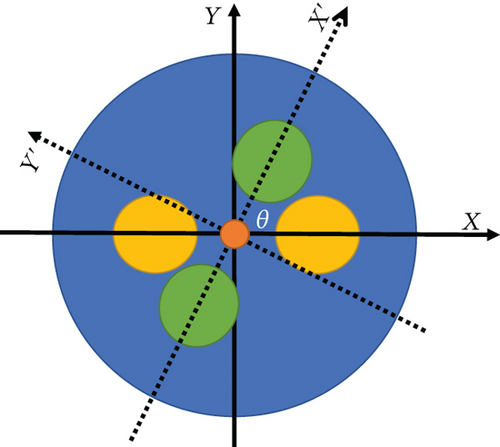
There is a fusion point between FRM and the sensing fiber, as shown in Figure 3. A polarization-maintaining fiber fusion splicer carries out the optical axis to axis fusion. The cross-section of alignment is shown in Figure 4.
3.2.1. The Faraday Rotator Is Perfect
When the Faraday rotator is perfect, the optical axis misalignment between the sensing fiber and FRM has nothing to do with the system accuracy.
3.2.2. The Faraday Rotator Is Imperfect
When the Faraday rotator is imperfect, the misalignment of the optical axis between the sensing fiber and FRM also has nothing to do with the system accuracy. However, the imperfect Faraday rotator will be the main factor for relative error, which will be discussed in Section 3.3.
3.3. The Effect of the Faraday Rotator
The imperfect Faraday rotator can be divided into two categories. One is the Faraday rotation angle deviated from 45 deg due to the imperfect manufacturing process, and the other is the Faraday rotation angle will change with temperature.
3.3.1. The Effect of the Imperfect Manufacturing Process
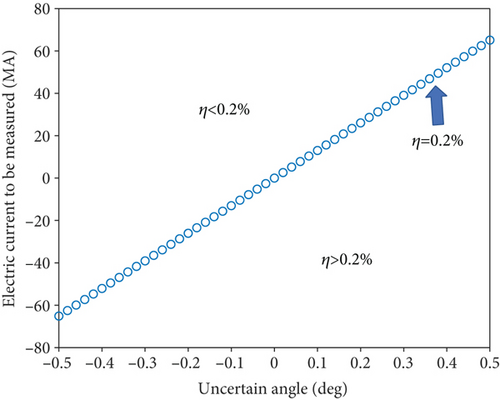
When the electric current to be measured is on the left and upper of the line, the relative error will meet the measurement requirements. Otherwise, the AFOCS will not meet the system accuracy requirements, as shown in Figure 5.
It should be noted that when the influence of zero bias is eliminated, the error introduced by FRM due to the manufacturing process can be eliminated. The error generated by the Faraday rotator is a fixed additive noise for the SOP rotation angle, so it can be eliminated by subtracting a fixed coefficient.
3.3.2. The Effect of Temperature
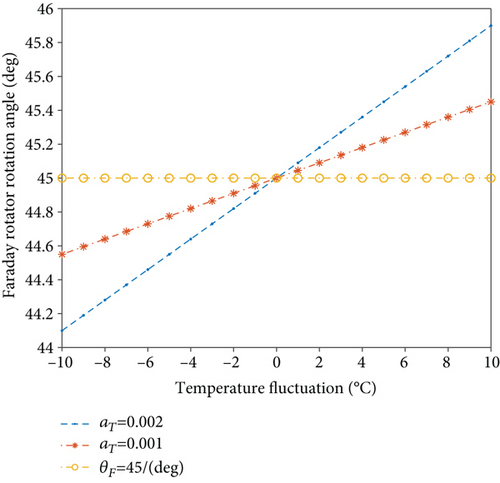
The Faraday rotator rotation angle is proportional to the temperature fluctuation, as shown in Figure 6, and the slope is the remanence temperature coefficient. We can get the relationship between the relative error and the temperature fluctuation by Equations (10), (12), and (13). The turns of sensing fiber and the Verdet constant are the same as Section 3.3.2. When the electric current to be measured is 10 kA, the relationship between relative error and temperature fluctuation is shown in Figure 7.
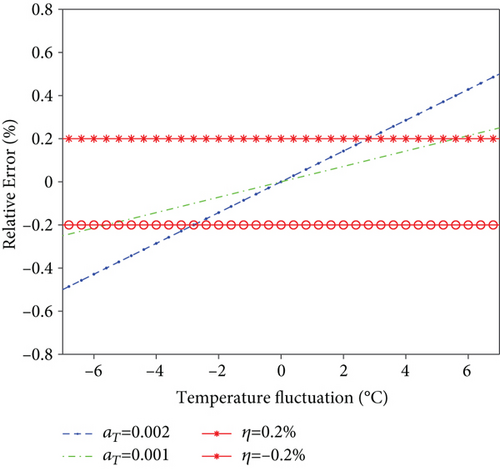
The range of the operation is within 0.2%; the temperature fluctuation range increases with the remanence temperature coefficient decline, as shown in Figure 7.
3.4. The Effect of the Mirror
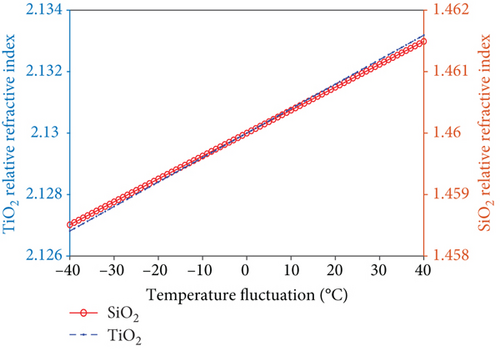
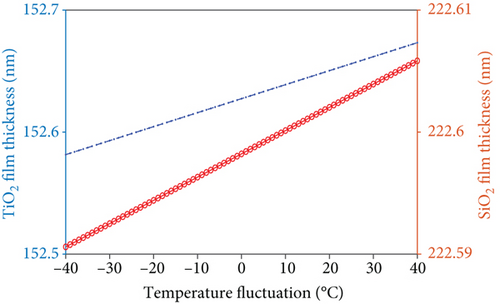
The reflection spectrum of the mirror changes with the thickness and refractive index of the thin film. However, the evolution of the reflection spectrum does not affect the accuracy of the system with the harmonic division demodulation, as described in Section 3.1. Therefore, the influence of temperature on the mirror can be ignored.
4. Experiments and Discussion
4.1. The Effect of Temperature on FRM
The Faraday rotator rotation angle changes with temperature and adversely impacts the system accuracy. The experimental system is designed in Figure 9.
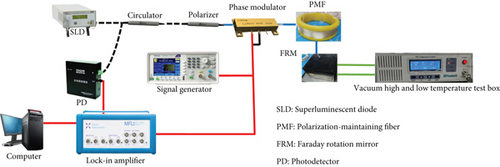
The dotted line denotes the single-mode optical fiber to transmit energy. The polarization-maintaining fiber is represented by the solid blue line to maintain the state of polarization. The solid red line expresses the electronic signal. The temperature control pipeline of the vacuum high- and low-temperature test box is expressed with a double solid line, as shown in Figure 9. The model and main parameters of experimental devices are shown in Table 1.
| Name | Brand | Model or main parameters |
|---|---|---|
| Light source | Thorlabs China Co., Ltd. | S5FC1018P |
| Polarizer | MC Fiber Optics Co., Ltd. | The extinction ratio is no less than 28 dB |
| Circulator | MC Fiber Optics Co., Ltd. | Commercially available |
| Phase modulator | SWT OPTICS Co., Ltd. | The half-wave voltage is 4 V |
| Polarization-maintaining fiber | YOFC Optical Fiber and Cable Co., Ltd. | PM1016-A |
| Faraday rotation mirror | MC Fiber Optics Co., Ltd. | Reflectivity is greater than 99%@1310 nm |
| Photodetector | Conquer Co., Ltd. | KG-HSP |
| Lock-in amplifier | Zurich Instruments | MFLI 500 kHz |
| Signal generator | Tektronix | AFG1062 |
| Vacuum high- and low-temperature test box | Wuhan Tailunte Century Technology Co., Ltd. | TLVB-VHLB50, range: -60°C-100°C, accuracy ± 0.1°C |
| DC-regulated power supply | Rohde & Schwarz, Munich, Germany | R&S®HMP4000 |
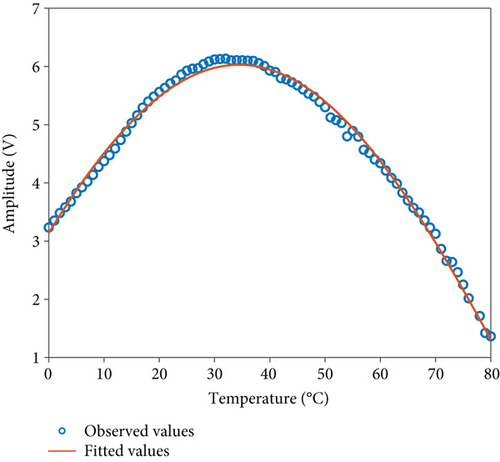
The temperature of the vacuum high- and low-temperature test box was set from 0°C to 80°C, and the temperature step interval was 1°C. When the temperature reached the set temperature, keep the temperature for 3 minutes before data acquisition to ensure that the FRM had been evenly heated. The data acquisition time is 1 minute, and the mean value is used as the measurement result to eliminate the influence of random noise. The relationship between correlation demodulation results and temperature obtained by the lock-in amplifier is shown in Figure 10.
The remanence temperature coefficient is aT = 0.009447 based on Equations (6), (9), (13), and (16). The relationship between the relative error and the temperature fluctuation is shown in Figure 11.
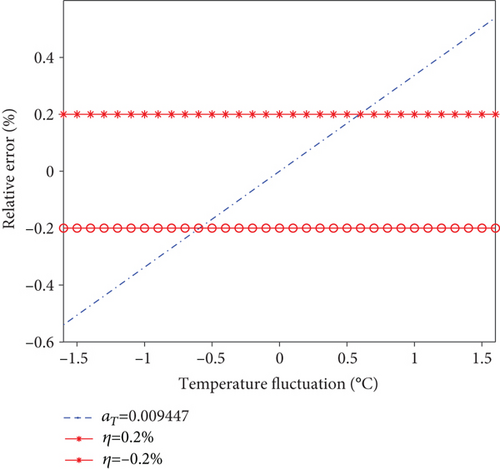
When the relative error is within ±0.2% for power system measurement, the temperature fluctuation range is ±0.6°C, far less than the required working range of AFOCS. Therefore, optimizing the Faraday rotator, such as by vacuum thermal insulation packaging, is necessary to maintain the Faraday rotator in a constant temperature range.
4.2. The Effect of Temperature on AFOCS
We tested the effect of temperature on AFOCS in this section. We introduced a quarter-wave plate and the sensing fiber on the basis of Figure 9, as shown in Figure 12.
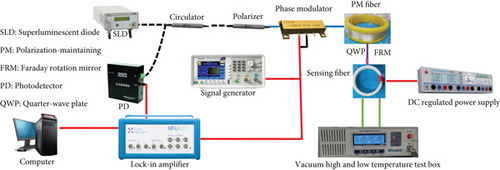
The quarter-wave plate was made by ourselves, which is shown with the pink line in Figure 12. The sensing fiber is the spun highly birefringent fiber made from YOFC Optical Fiber and Cable Co., Ltd. The beat length and spin pitch are 10 mm and 5 mm, respectively, as shown in Figure 12.
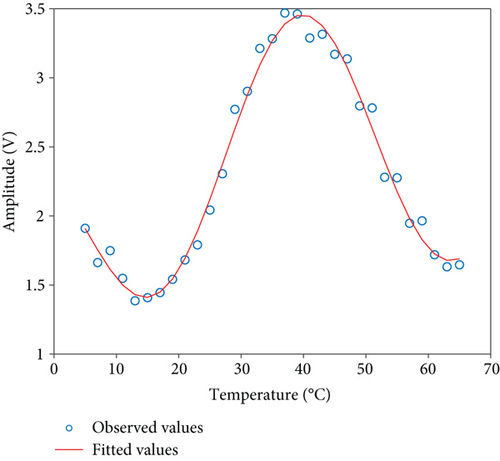
The temperature of the vacuum high- and low-temperature test box was set from 5°C to 65°C, and the temperature step interval was 2°C. When the temperature reached the set temperature, keep the temperature for 3 minutes before data acquisition to ensure that the sensing head had been evenly heated. The data acquisition time is 1 minute, and the mean value is used as the measurement result to eliminate the influence of random noise. The relationship between the zero drift (the electric current was set to zero) of the system and temperature is shown in Figure 13.
5. Conclusion
As an essential part of AFOCS, the influence of FRM is analyzed in this paper. The conclusion can be summarized as follows.
Firstly, harmonic division demodulation is better than the first harmonic method to copy with the fluctuation of light intensity, which is caused by long-term operation or the effect of the temperature fluctuation on the thin film mirror.
Secondly, the optical axis misalignment between the sensing fiber and FRM has nothing to do with the relative error. So the single-mode fusion splicer can be applied in this fusion splicing process.
Thirdly, the influence of temperature on the Faraday rotator determines the performance of the reflection unit. The temperature fluctuation range is related to the measured electric current to satisfy the required accuracy for IEC 60044-8 class 0.2S if the FRM does not work at a stable temperature.
Conflicts of Interest
The authors declare no conflict of interest.
Acknowledgments
The authors would like to thank anyone who puts forward constructive suggestions.
Appendix
Open Research
Data Availability
Data underlying the results presented in this paper are not publicly available at this time but may be available from the corresponding author upon request.


