Guided Wave Focusing Imaging Detection of Pipelines by Piezoelectric Sensor Array
Abstract
The sensor array-based guided wave focusing detection method can effectively improve the detection sensitivity of defects and realize the visual imaging. In this research, the three-dimensional finite element simulation model of stainless steel pipeline for guided wave focusing detection was established, and the L(0, 2) mode of guided wave was excited by applying a load on the end surface of the pipeline. And in the experiment, the excitation and reception of L(0, 2) mode guided waves on the outer surface of the stainless steel pipeline were realized by the piezoelectric transducer array. A 16-channel guided wave focusing experimental system was integrated to conduct the defect detection experiments on a stainless steel pipe with diameter of 140 mm and wall thickness of 5 mm. The total matrix data acquisition was performed, and then the amplitude total focusing (TFM) imaging and sign coherence factor (SCF) imaging of the pipe were realized. In this way, the experimental results showed that the pipeline defect detection method and the system proposed in this research can achieve the longitudinal and circumferential positioning and imaging of defects, like holes and scratches.
1. Introduction
Ultrasonic guided waves using sensor arrays can improve the resolution of defect detection. Combining the total focusing method (TFM), the longitudinal and circumferential positioning of defects can be achieved precisely in a large range [1]. Moreover, the sensor array can locate multiple defects at the same time, which can solve the problem of identifying scratch defects smaller than half a wavelength [2]. A phased array system controls every element in the array to excite and receive ultrasonic waves according to a certain time delay. The beam can be focused in any point of a testing structure, which can improve the capability of detecting small defects [3].
The existing ultrasonic guided wave detections usually achieve axial positioning of pipeline defects through the A-sweep signals and cannot determine the circumferential location or the number of defects in the circumferential direction. Detection of pipeline circumferential defects usually requires a sweep of the entire pipeline [4]. Li et al. [5] achieved the monitoring of bubble flow inside opaque pipes by sensor arrays. In terms of focusing detection of pipelines, Rose and Paul [6] proposed an ultrasonic guided wave focusing principle to detect defects in pipelines. Mu et al. [7] compared theoretical calculations with finite element simulations to validate the idea of guided wave focusing in pipelines and demonstrated that guided wave focusing can improve the circumferential resolution of defects through a commercial phase-controlled system. Wu et al. [8] proposed a virtual phase-controlled focusing method to achieve focusing detection of pipeline defects, which improved the detection capability of ultrasonic guided waves for defects, but their experiments used multiple switching to equate the effect of multichannel devices, which is a tedious process. The conventional ultrasonic detection methods have low sensitivity for scratch defects [9].
In terms of the total focusing method, Holmes et al. [10] first proposed a total focus algorithm that was superior to the sensor array sweep and was able to perform virtual focus detection for each point of the grid, but the experiment required multiple devices for signal excitation and acquisition, and surely, the operation process was much tedious. Jie et al. [11] quantitatively analyzed the effect of varying array element parameters (amplitude, phase, and time delay) on the quality of TFM imaging. He et al. [12] used a ring-shaped electromagnetic sensor array consisting of eight sensors that were excited to generate a single A0 mode Lamb wave at low frequencies; using the total focusing method, they achieved fast large-area detection of plate-like structures by Lamb waves. Camacho et al. [13] first proposed a phase imaging algorithm by defining a phase coherence factor and a sign coherence factor, respectively, weighted the synthesized output to achieve the suppression of the side and gate flaps, and finally improved the signal-to-noise ratio. Prado et al. [14] used the sign coherence factor (SCF) for the weighted processing of total focusing imaging and proposed a composite imaging method by single mode Lamb wave for plate structures. Liu et al. [15] used the advantage of all-round detection of dense piezoelectric transducer array and combined the composite imaging method of TFM and SCF to achieve the multiple defect images. The experiments used a single channel system for total matrix signal acquisition, which would be not efficient. Lyu et al. [16] designed a high-voltage excitation of multichannel tone-burst signal with synchronous signal acquisition. Experiments are conducted by the developed multichannel system and the piezoelectric linear array. Guided wave phased array and the total focusing imaging algorithm are demonstrated on a 1 mm aluminum plate.
In this research, a 16-channel guided wave focusing detection system was developed to implement the total matrix data acquisition experiment on the pipeline, and then the total focusing imaging algorithm and sign coherence factor imaging algorithm were manipulated to realize the focusing imaging of multiple pipeline defects.
2. Mode Selection and Simulation Analysis
2.1. Mode Selection
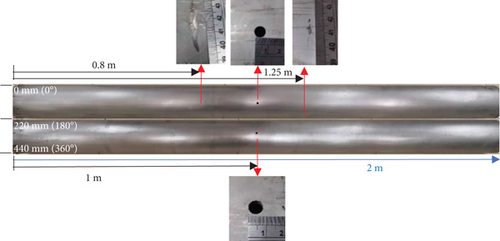
A stainless steel pipe was adopted in the experiment, with a length of 2000 mm, inner diameter of 130 mm, and wall thickness of 5 mm, as shown in Figure 1, in which the density is 7.932 g/cm3, the longitudinal wave speed is 5960 m/s, and the transverse wave speed is 3260 m/s. The axisymmetric longitudinal mode dispersion curves were calculated based on the above fundamental parameters. The group velocity dispersion curves are demonstrated in Figure 2.
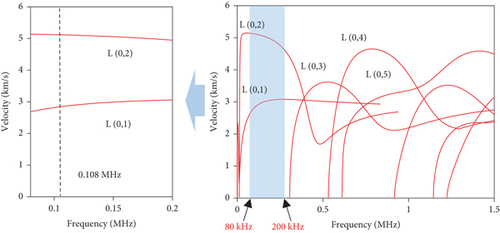
The L(0, 2) or L(0, 1) mode exhibits almost no dispersion in the lower frequency range, and L(0, 2) possesses faster propagation speed, which will be distinct in time domain to avoid the complex echoes, and then benefits the following signal analysis. Therefore, both simulation and experiment utilized the L(0, 2) mode for the detection. The excitation frequency range was between 80 kHz and 200 kHz according to the above dispersion curve.
2.2. Wave Excitation and Simulation
A finite element model of the pipeline was established in ABAQUS (Dassault Systemes SIMULIA), according to the actual parameters of the specimen used in Section 2.1. The material parameters of the stainless steel are shown in Table 1. And the excitation signal was set to a Hanning windowed 5-period sinusoidal signal with a central frequency of 108 kHz to match the piezoelectric transducer.
| Density | Poisson’s ratio | Elastic modulus |
|---|---|---|
| 7932 kg/m3 | 0.30 | 193 GPa |
The simulation model is calculated using dynamic explicit analysis step, the sampling duration is set to 1000 μs, which is sufficient for the L(0,2) mode guided wave to propagate to the rear half of the pipe, the sampling points are set to 10000 points, the sampling frequency is 10 MHz at this time, the output variable of the output node is set to displacement, and the displacement direction is set to y direction, which is used to extract the vibration of the mass point in the vertical pipe axial direction, i.e., the L(0,2) mode vibration direction of the guided wave. A hexahedral structured network is used to mesh the pipe model, and the mesh size is set to 1.5 mm to meet the requirement that the mesh size is less than one-eighth of the wavelength.
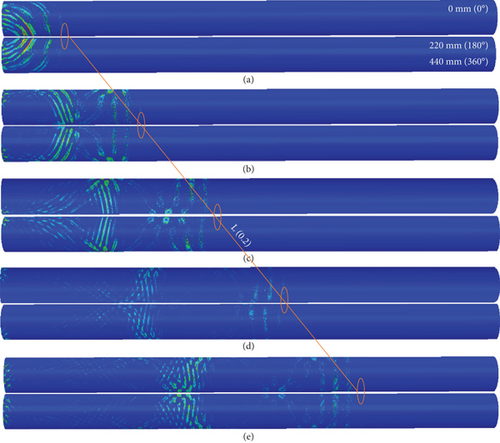
To excite the longitudinal mode, the excitation region of displacement load was applied and divided in 16 elements at the end surface of the pipe, and the loading is along the axial direction of the pipe. The obtained diagram of wave propagation in the pipe is shown in Figure 3, and the fastest guided wave velocity obtained after calculation is 5040.9 m/s, which coincides with the corresponding L(0, 2) mode guided wave velocity of 5113.3 m/s in the dispersion curve. It can be determined that the above excitation method can generate L(0, 2) mode guided waves propagating axially along the pipe and can be used for pipe defect detection. The wavelength of this mode wave in the pipe is 46.7 mm.
A model of the pipe with two artificial through-holes was established. In the center of the pipe, we set two artificial through-holes with a diameter of 7 mm, 16 piezoelectric sensors along the circumference of the pipe were uniformly distributed on the surface of one end of the pipe, and the interval between each sensor was 27.48 mm. The sensor array distribution and the location of the defects are shown in Figure 4.
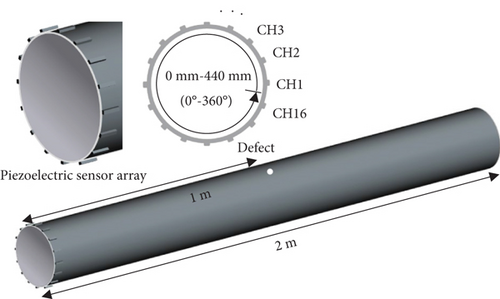
The ultrasonic excitation started from CH1 to CH16 one by one counterclockwise, and in every excitation, all the sensors will receive its own echoes.
The simulation was carried out in the way of 1 channel excitation and 16 channel reception. Totally, 16 sets of data were obtained, and finally, a data matrix [M] of 16 × 16 × n (n is the number of data point in one time history) points data were constructed. Taking the excitation by CH5 for example, the 16 sets of echoes obtained are shown in Figure 5. We can see that the first-channel excitation produced the highest initial wave amplitude when received by itself, and the circumferential wave is included. However, we cannot find any axial echoes with the defect information at all.
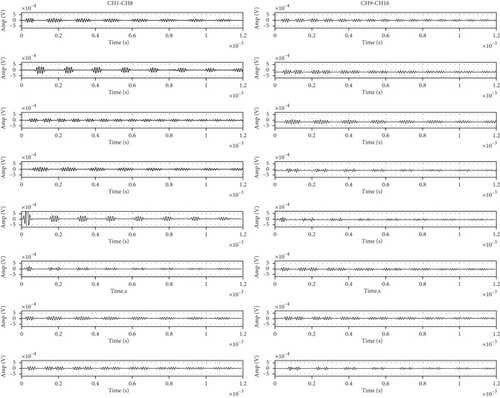
Above all, from the simulation results, it can be seen that the excited waves by CH5, which is closest to one of the defect, could not find the defect echoes, even though it has the most significant signal by its channel. Therefore, it was necessary to use the matrix data to improve the resolution of defect echoes. And the total focusing method will be adopted to visualize and locate the defects accordingly.
3. Array Sensor Imaging
The total focusing method is a virtual focus postprocessing imaging technique based on total matrix data, which is divided into two main parts: total matrix data acquisition and total focusing imaging [17, 18].
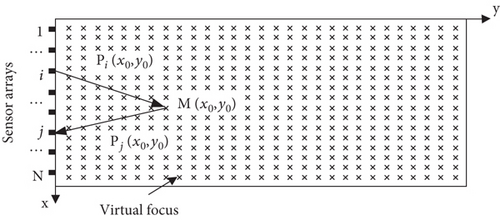
An array of 16 sensors was mounted on the end surface of the pipe, so we will have 16 echoes for each exciting element. And then, the 16 × 16 echo signals are obtained for total focusing imaging. It should be noted that the image of the pipe will be unrolled to plane view, in which a Cartesian coordinate system is established. The image plane is discretized into a grid, shown in Figure 6. The total focusing algorithm uses the [M] matrix data to achieve point focusing imaging of all discrete points in grid. As shown in Figure 6, where P is the time amplitude information. P is the A scan waveform of each channel signal composed of time and amplitude, and the amplitude information of each virtual focus is obtained by wave speed and crossing time according to the coordinates of each virtual focus. The signal amplitude of all ultrasonic echo signals at that point is solved according to the distance of each array element to that point, and the amplitude values are superimposed to obtain the amplitude of that point, and then the above process is repeated to obtain the amplitude information of all focus points [19].
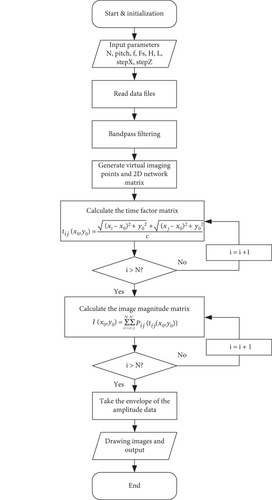
The flow chart of total focus imaging algorithm is shown in Figure 7(a). The parameters are set as follows: N = 16, pitch = 27.5 mm, f = 108000 Hz, Fs = 1/5000000 s, c = 5011 m/s, H = 1500 mm, L = 440 mm, stepX = 1 mm, and stepY = 1 mm.
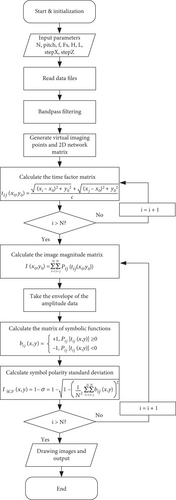
The SCF imaging on the basis of total focus imaging, in addition to using the amplitude information in the matrix data, also introduces the phase information of the signal into the algorithm. This method overcomes the susceptibility of the signal amplitude to noise and interference from the side and gate flaps and effectively suppresses the effect of the inconsistent directivity of the acoustic beam on the imaging quality [13], improving the contrast and signal-to-noise ratio of the imaging.
Among the proposed phase imaging methods, the sign coherence factor imaging algorithm has better detection results in defect localization, and the sign coherence factor imaging is a method analyzing the variance of the signal symbol polarity [15]. The flow chart of sign coherence factor imaging is shown in Figure 7(b). The parameters are set as follows: N = 16, pitch = 27.5 mm, f = 108000 Hz, Fs = 1/5000000 s, c = 5011 m/s, H = 1500 mm, L = 440 mm, stepX = 1 mm, and stepY = 1 mm.
The total focusing method was used to image the total matrix data obtained from the simulation as shown in Figure 8.
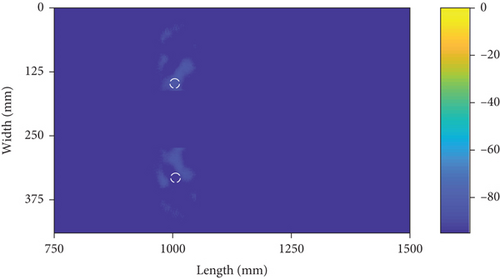
Sign coherence factor imaging was performed on the basis of the total focusing method, as shown in Figure 9.

The imaging resolution was set to 1 mm, and the imaging results were thresholded at 80% to remove noise artifacts and performed time windowing from 98 μs to 314 μs, corresponding to a region in the image of 250 mm to 800 mm. However, due to the guided wave also propagating along the circumference of the pipe in the simulation, the amplitude is large, which has a relatively large impact on the results. From the obtained image (the white circle is the actual location of the defect), it can be seen that the artificial through-hole set in the middle of the pipe was detected, and the location information of the defect was consistent with the set model. The sign coherence factor imaging was better than the total focusing method.
Therefore, through the sensor array-based pipeline guided-wave, the total focus method could obtain more accurate location information of multiple defects in metal pipes, which verified the theory of using the total focus imaging method and sign coherence factor imaging, and then guided for the subsequent experiments.
4. Sensor Array Excitation/Acquisition System
To realize the multichannel total matrix data acquisition function, the multichannel ultrasonic excitation and acquisition system was designed, which can realize 16 channel ultrasonic signal excitation and synchronous signal acquisition and can support up to 16 channel of rotating excitation or phase-controlled excitation. The 16 receiving channels can be used synchronously or independently, which can realize total focusing imaging detection. The system equipment adopts a dual 220 V AC power supply, and the excitation voltage can reach up to 180 Vpp peak-to-peak, which can realize the sinusoidal signal excitation with 5-cycle Hanning window modulation. The sampling signal gain is 0-42 dB, which can be adjusted online. Data is transferred via USB2.0 and through the host computer for excitation acquisition, parameter adjustment, and data storage. Figure 10 shows the appearance of the device. The basic parameters of the equipment indicators are shown in Table 2.
| Parameter name | Value |
|---|---|
| Data transfer | USB2.0 |
| Excitation frequency | 10 kHz~500 kHz |
| Excitation amplitude | 180 Vpp |
| Programmable gain amplifier | 0~42 dB |
| Maximum sampling rate | 100 MHz |
| Sampling length | 655 us@50 MHz |
| Power supply | 220 V AC |
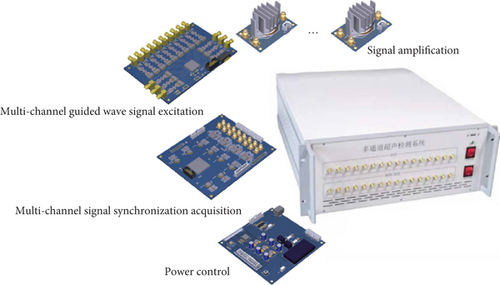
The system mainly includes multichannel signal synchronization acquisition module, multichannel guided wave signal excitation module, signal amplification module, power supply and data interface module, high-voltage linear power supply, and detection system host computer. Figure 11 shows the structure of the system.

The multichannel signal excitation module consists of 16 independent excitation channel and 16 independent signal amplification links. The excitation signal is realized by direct digital synthesis (DDS) technology for arbitrary waveform signal excitation, and this experiment needs to reduce the guided waveform dispersion phenomenon, so a 5-cycle Hanning window-modulated sinusoidal signal is used as the excitation signal, and the frequency can be adjusted online by the host computer. With signal amplification linked by the PA85 amplifier chip as the core device to achieve 100 times the voltage amplification of the input signal, the excitation waveform can be amplified with the peak-to-peak value of 180 Vpp excitation signal.
The multichannel signal acquisition module needs to realize the synchronous signal acquisition of 16 channels. After the signal acquired by each channel enters the acquisition module, it is processed by program-controlled gain amplification, filtering, etc. and then acquired by the high-speed ADC, converted into 8-bit binary code values, read and cached by the FPGA, and transferred to the host computer after the acquisition is completed. To realize the data transmission between the acquisition system and the host computer, the USB2.0 communication interface based on the interface chip CH376 is used, which can realize the bidirectional transmission of data and control instructions. The dynamic link library based on CH376 is used to design the multichannel signal acquisition host computer program, which can automatically realize the total matrix data acquisition process of one excitation and multiple acquisitions.
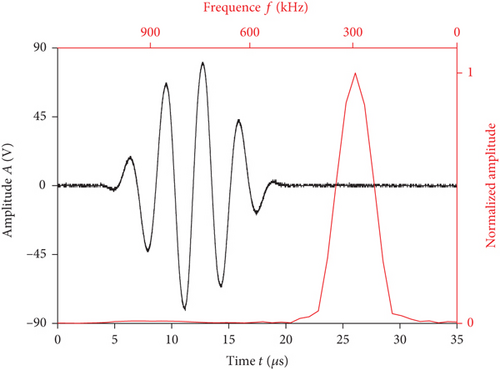
Figure 12 showed the time-frequency diagram of the Hanning window-modulated 5-period 300 kHz sinusoidal signal output from the system, from the time domain diagram, it could be seen that the peak-to-peak value of the excitation signal can reach 180 Vpp, the signal had no obvious distortion, and the signal-to-noise ratio was as high as 40 dB.
5. Experimental Study of Pipeline Detection
5.1. Total Matrix Data Acquisition
The total matrix data acquisition experiment was conducted on stainless steel pipes using the developed multichannel ultrasonic detection system, and the total matrix data acquired were processed by applying imaging algorithms.
Firstly, total matrix data acquisition experiments were conducted for stainless steel pipes, and the experiments used the same stainless steel pipe parameters as the model established in the simulation experiments. The defects were set as two symmetrical openings with 7 mm diameter artificial through-hole to verify the multidefect detection capability of the method, and to verify the detection capability of the method for scratch defects, two surface scratch damages were randomly set on the pipe surface, which can simulate scratch defects and corrosion damages in the pipe. The selected piezoelectric transducer size was 13.3 mm × 3.5 mm × 1 mm, which was coupled to the surface of the stainless steel pipe by the 502 glue. The piezoelectric transducer array arrangement was also consistent with the setup of the simulation experiment, uniformly arranged on the outer surface of one end of the pipe, and the center distance of each piezoelectric transducer was 27.48 mm. The basic configuration of the detection experiment is shown in Figure 13.
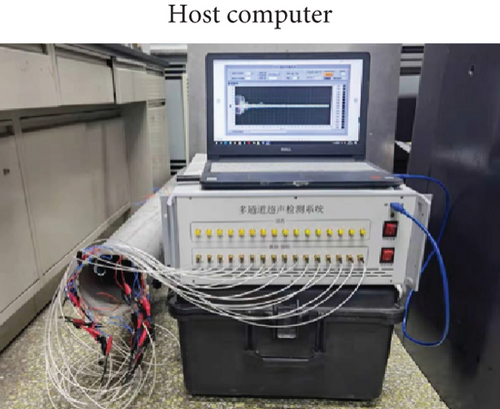
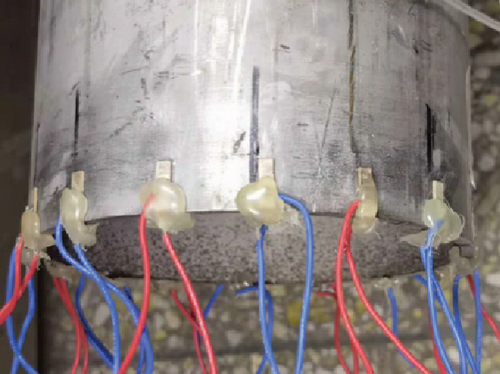
The 16 excitation/reception channels of the instrument were connected to 16 piezoelectric sensors with coaxial shielded wires, which can realize the self-excitation and self-acceptance of each piezoelectric sensor. Since the center frequency of the piezoelectric transducer was 108 kHz, the initial value of the excitation signal was set to 108 kHz in the host computer, the excitation signal was 5-period Hanning window modulating the sinusoidal signal, the excitation channel was set to 16 channel in turn, the sampling length was set to 655.36 μs, the gain amplification of the received signal was set to 40 dB, and a total matrix data acquisition was performed after the setup was completed. The signal received from 16 channels after 5 channel excitation is shown in Figure 14, and the comparison with the simulated signal showed that the signal characteristics were the same.
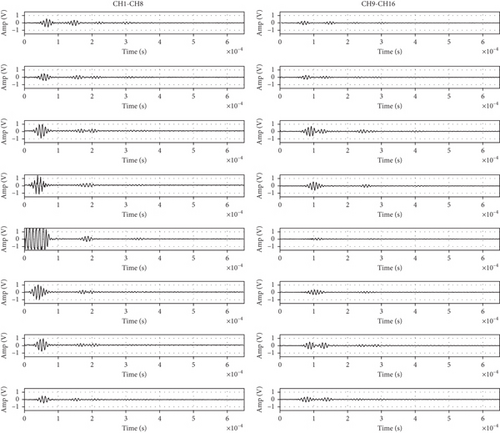
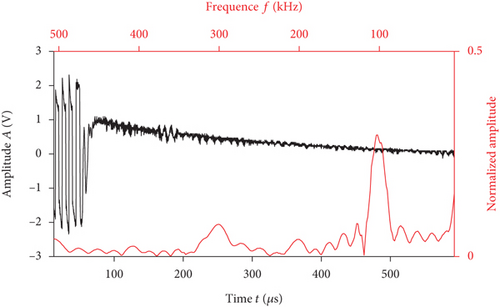
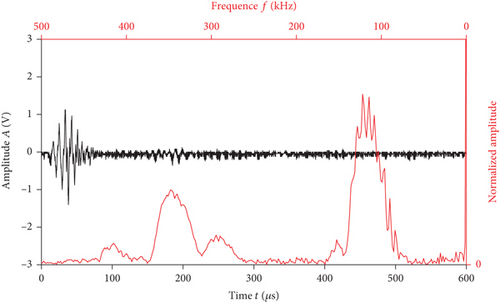
From the acquired signal waveform, it could be seen that the defect signal could not be identified in the self-excited and self-accepted signal of CH5 which is closest to one of the defect and could not find the defect echoes, even though it has the most significant signal by its channel. Therefore, it is also necessary to apply a focused imaging algorithm to the total matrix signal and remove the influence of other modal guide waves. Firstly, the waveform and spectrum of a single signal were analyzed, as shown in Figures 15 and 16. The frequency band of the echo signal became wider and introduced echo interference from other frequencies, so in addition to applying the focused imaging algorithm, it was also necessary to find a suitable filter band for signal filtering.
5.2. Total Focusing Imaging
Applying the amplitude total focus method to the collected total matrix data, wave velocity was adopted as the base parameter of 5011 m/s actually measured in the experiment, the basic parameter settings are shown in Table 3, the imaging results were processed for 113 dB dynamic range to remove noise artifacts, from the images obtained (the white circle is the actual location of the defect), it could be seen that the two artificial through-hole set were detected, and the location information of the defect was consistent with the set. The model was the same. Therefore, the basic position information of multiple defects in metal pipes could be obtained by the guided wave total focusing method based on the sensor array, as shown in Figure 17.
| Parameter name | Set value |
|---|---|
| Number of elements | 16 |
| Distance between the centers of adjacent elements | 27.5 mm |
| Single element width | 3.5 mm |
| Element center frequency | 108 kHz |
| Sampling rate | 50 MHz |
| Imaging length | 1500 mm |
| Imaging width | 440 mm |
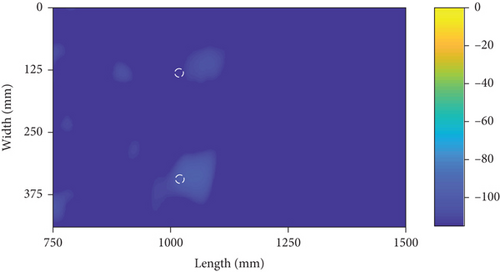
From the total focusing imaging results, it showed that the artifacts in the image still could not be completely removed, and the defect echo amplitude was not obvious enough to compare with the artifacts, which was not conducive to the discrimination and localization of pipeline defects, and the setup column pattern and scratch defects could not be distinguished in the figure. However, the imaging results verified the feasibility of total matrix data acquisition imaging for pipeline defect detection.
5.3. SCF Imaging
Amplitude total focus imaging uses only the signal amplitude information for imaging, which is susceptible to noise interference and thus leads to imaging distortion; in addition, the influence of signal noise can cause the generation of artifacts and reduce the accuracy of detection results. Phase-based SCF imaging uses the polarity information of the signal for imaging, which is less disturbed by amplitude attenuation and other interference, and can effectively suppress the grating and side flaps of the beam directionality and improve the resolution of imaging. Therefore, the sign coherence factor imaging algorithm was used to process the total matrix data of 16 channels, the narrowband band pass filtering was performed on the echo signal, and the imaging resolution was set to 1 mm. 50 dB dynamic range processing was performed on the imaging results to remove noise artifacts, and the imaging results were obtained as shown in Figure 18.
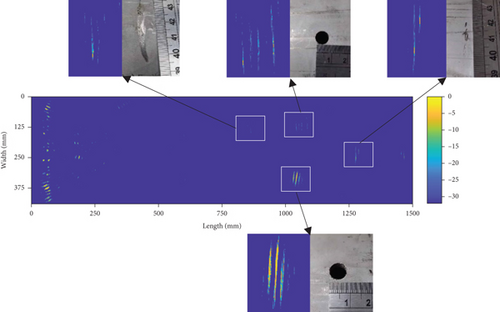
The two installed artificial through-holes and the scratch defects on the pipe surface were clearly distinguishable from the results of the sign coherence factor imaging, which fully illustrated that the equipment and the method introduced in this paper can detect and image multiple small defects in metal pipes and obtain the location of the defects on the pipe surface.
However, from the imaging results, the location of the defect, and the actual location of the defect in the specimen, there was a certain error; for this experiment, the longitudinal positioning error of the round hole was within 2.1%, meeting the detection needs; the reasons for the error were currently considered the following three: the first was the piezoelectric sensor size larger, resulting in inaccurate positioning, and, with half wavelength unequal, will lead to multimode guided wave generation; the second reason was that the wave speed measurement was not accurate enough, resulting in a certain error when imaging; and the third reason was that the piezoelectric sensor was not positioned accurately enough around the circumference of the pipe, resulting in deviations in the actual guided wave propagation path.
The results of the sign coherence factor imaging experiment using CH1 to CH8 channels of total matrix data are shown in Figure 19. It can be found that the quality and accuracy of imaging decrease when the number of channel is reduced.

When the filter band of the acquired echo signal was widened, i.e., echoes from other modes might be introduced, the imaging results at this time are shown in Figure 20, and the artifacts produced were significantly increased compared with the results after narrow-band filtering in Figure 18. Therefore, narrow-band filtering of the acquired signal was helpful to remove the interference of guided wave signals from other modes, improve the imaging quality, and reduce artifacts.

6. Conclusions
- (1)
The total focus method imaging enables defect imaging detection of metal pipes, locating the location of multiple defects
- (2)
The 16-channel guided wave focus detection system could realize the total focus method detection, and the signal-to-noise ratio of the collected signal was high. Combining with the host computer program could automatically realize the acquisition process of the total matrix data, which greatly improved the efficiency of the array detection experiment
- (3)
Focusing method using sign coherence factor imaging has the advantages of high resolution and high contrast and could eliminate noise artifacts and improve the accuracy of defect localization imaging and detection of scratch defects in the case of imaging results doing lower dynamic range processing. Increased number of sensors could improve the imaging quality, and the filtering of the echo signal could eliminate the interference of the guided wave signal of other modes and in this way, the detection sensitivity of scratch defects can be effectively improved
Conflicts of Interest
The authors declare that there is no conflict of interest regarding the publication of this paper.
Acknowledgments
This work is supported by the National Natural Science Foundation of China (Nos. 12072004 and 51875010), Beijing Natural Science Foundation (No. 3192006), and General Project of Scientific Plan of Beijing Municipal Education Commission (KM201710005012).
Open Research
Data Availability
The data used to support the findings of this study are included within the article.


