Do Pollination and Pollen Sources Affect Fig Seed Set and Quality? First Attempt Using Chemical and Vibrational Fingerprints Coupled with Chemometrics
Abstract
This research investigates whether pollination and pollen sources separately and simultaneously influence fig seed set and quality, as being thus far the less studied part of the fig trees. This is the first research that tries to answer and verify the above hypothesis through a combined approach of vibrational spectroscopy along with lipo-biochemical and ionomic fingerprinting. Results showed that pollination and pollen source significantly impacted seed set as it was higher in fertilized seeds than that in the control. A similar pattern was obtained with oil yield, which generally ranged between 25.93 and 32.59%. Caprification also displayed a substantial effect on seeds' phenolic components, which was more driven by pollen carbohydrates, involved in the phenolic biosynthesis in the endosperm and embryo tissues. This biosynthesis is also activated by minerals, which are cofactors for large varieties of enzymes that are involved in the phenolic synthesis pathways. Ca and Zn did not follow this pattern and have recorded high levels in figs fertilized by the pollen of OZ and FD4 caprifigs pollen, respectively. Vibrational spectroscopy using Fourier transform infrared (FTIR) spectroscopy coupled with total attenuated reflectance (ATR) also showed a similar pattern to the seed sets and their lipo-biochemical attributes. Thus, the fertilized seeds displayed high vibrational intensity compared to the control in all fingerprint regions. Peaks at 2928 and 1747 cm−1 had a higher intensity and were attributed to lipids CH2 and CH3 stretching vibration and C=O of the carbonyl groups belonging to the triacylglycerols, respectively. Principal component analysis showed high throughput classification with quite similar patterns for both FTIR-ATR fingerprinting and ionomic and biochemical analysis. As many areas of how caprification impacts other seed aspects still need to be investigated further, this research suggests the importance of caprification in seed valorization for oil extraction and as a functional ingredient.
1. Introduction
The pollination system in Ficus carica L. is based on a unique mutualism between the species and a symbiotic fig wasp called Blastophaga psenes, which has always been coexisted with the fig. This symbiosis symbolizes an outstanding example of very particular coevolution between the tree and its pollinator wasp in the kingdom Plantae [1, 2]. This pollination, also known as caprification, is generally required for fruit loading and has an important impact on fruit quality [3–5]. However, some types of female figs can parthenocarpically produce fruits without pollination. This particular aspect divides female figs into three types. The first one is called common figs, which do not require caprification and can yield one (unifera variety) or two (bifera variety) crops [6]. The second is known as Smyrna-type figs, which require pollen from the male tree called caprifig. Then, the third type, named San Pedro, producing a first crop parthenocarpically (breba), is usually reaped in late June in Mediterranean countries and is the main crop only after caprification, which is generally harvested in the period between mid-August and early September [7, 8]. The fig pollination cycle is determined mutually by the cycles of wasp pollinator and caprifig production. Thus, a caprifig tree yields three types of inedible syconia annually: “profichi,” “mammoni,” and “mamme.” The “profichi” caprifigs initiate in the spring and mature in summer and are also called insectivorous since they host the fig wasp [9, 10]. The “mammoni” are small-sized fruits that mature in the fall. Then, the “mamme” fruits initiate in the fall, remain dormant during the winter, and ripen in the spring. The pollination (caprification) process, which occurs from the end of May into June, is assured by the adult female wasp, which emerges from the caprifig (“profichi”) and enters receptive common fig through the ostiole, seeking egg-laying sites using its ovipositor. During this process, pollen carried on the female body is spread to female flowers, resulting in pollination, which is necessary to seeds yielding [4]. This unique mutualism cycle between this wasp and the edible and inedible figs is behind the transfer of pollen from caprifigs to edible figs, which helps produce high nutritive figs and yields seeds. Today it is well-known that caprification has a substantial impact on fruit load and quality. In the study carried out by Trad et al. [5], textural traits of ripened fig were moderately impacted by caprification, which significantly enhanced anthocyanins biogenesis in the syconium. Similarly, Trad et al. [7] demonstrated that caprification significantly increased fruit yield and volatile compounds content. Other studies reported that pollination has a significant effect on morphometric traits and storage aptitude of ripened figs alongside their aptitude for drying while safeguarding their organoleptic properties during the process [3, 4, 8, 11, 12]. The aforementioned effects are systematically driven by caprifig phenotypic variability previously assessed by several reports [1, 13]. Since many caprifig types exist, the effect on the common fig quality is dependent on its source [12]. So far, to the best of our knowledge, there is no single report on the caprification effect on fig seeds quality as the latter remains thus far the less studied part of the species. Based on previous studies, fig seeds are an important source of novel oil qualified as a minor source of atypical vegetable oil, with a yield of up to 30%. Furthermore, fig seeds oil was reported to have a higher desaturation rate and a significant phenotypic effect [14, 15]. Basically, as pollination is mainly involved in seeds formation [6], the main effect probably occurs over the attributes of seeds and, subsequently, the whole fruit quality. In this sense, the investigation of the caprification and source pollen effect on fresh figs must pass through its seeds’ chemical and lipochemical attributes. For this reason, this study was designed to investigate whether caprification and pollen source impact fig seeds set and quality, separately and in combination of both. To answer this question, lipochemical vibrational fingerprinting through attenuated total reflectance-Fourier transformed infrared (ATR-FTIR) spectroscopy and biochemical and ionomic assessment were performed on “Nabout” variety, which is one of the main components of the Moroccan fig trees landscape, with two caprifig cultivars, all cultivated in the same orchard and under the same conditions.
2. Material and Methods
2.1. Plant Material and Experimental Design
Caprification experiment was conducted in the national fig collection owned by the National Institute of Agricultural Research (INRA) and located in Meknes, northern Morocco (x = 511,600; y = 370,250; z = 480 m). Fig cultivars were trained to vase, spaced at 4 × 5 m, and conducted under the same cultural practices, with no use of pesticides. A pollination experiment was undertaken on the local variety “Nabout,” which is a common-type fig defined as uniferous (unifera variety), and does not require caprification (parthenocarpic). Thus, uniform branches bearing fruits at a similar biological stage were randomly chosen around the canopy and were covered with bags (60 × 30 cm) made of sulfur a week before the caprification period. Meanwhile, two caprifig cultivars, “Ouzidane” and “Frond d’Oued N° 4,” were selected; they had the same ripening stage (early June) that overlaps with the period of “Nabout” receptivity to pollen. The caprification process consisted of separately enclosing ten ripe profichi fruits (bearing pollen) harvested from each caprifig cultivar so that each branch covered with a single bag was pollinated with one type of caprifig fruit. The caprification process was repeated four times with four-day intervals [4]. In total, ten–fifteen bags were used for each pollen source, with a similar number of bags as a control (no caprification). It is noteworthy that these caprifigs were cultivated close to the fig trees collection and are subjected to the same conditions.
Once the caprification period was achieved, the sulfurized bags were removed. The experiment was conducted as a randomized complete block (RBC) design, where the pollen source was assigned as the main factor. Pollinated figs were harvested at their fully ripening stage, when their receptacle displayed reddish-purple coloration and when they were easily separated from the twig.
2.2. Samples Preparation
Once pollinated and control figs were harvested, they were longitudinally cut and seeds were extracted using the spatula and then put in 5% of technical ethanol for 5 min to separate seeds from pulp filaments through agitation and decantation [14, 15]. Shortly afterward, seeds were abundantly washed with distilled water and then air-dried at room temperature before being ground into a fine powder using IKA A11 Basic Grinder (St. Louis, MO). It is noteworthy that seeds yield was determined per fruit, using the same extraction method, with five replicates. Fig seeds are round-shaped and yellowish, with an average thousand seed weight of about 1.14 ± 0.01 g.
2.3. Ionomic Analysis
Nitrogen (N) contents were quantified using the Kjeldahl method (Buchi, Switzerland). Complexation with chromotropic acid helped to measure nitrate content using absorbance in a spectrophotometer (Spectronics, USA) fixed at 410 nm (Hadjidemetriou, 1982). Protein content was calculated based on N content using the following relation: P = 6.25 ∗ N. Phosphorus (P) content was determined by the yellow color method using the wet digestion method. The yellow color was measured at 410 WL by spectrophotometry (Shimadzu, Japan) [16]. Other elements (K, Na, Ca, Mg, Fe, Cu, Zn, and Mn) were analyzed using a dry-ashing method carried out at 550°C. Macroelements, namely, K, Na, and Ca, were assessed by flame photometry (Elico-CI378, India) [17]. Microelements, namely, Fe, Cu, Zn, and Mn, were assessed by atomic absorption spectrometry (AAS) (Perkin Elmer AAnalyst 300, USA) [18]. For each sample, three measures were undertaken to assess analysis reliability.
2.4. Vibrational Fingerprinting
Vibrational fingerprinting of fig seeds was performed, using Vertex 70-RAM II Bruker spectrometer within wavenumber range from 4000 to 500 cm−1 with a spectral resolution of 4 cm−1, averaging 256 scans per spectrum and equipped with a diamond ATR accessory (Bruker Analytical, Madison, WI). Spectrum acquisition of each sample (50 mg) was repeated five times in room conditions; then, an average spectrum was obtained. Before FTIR spectra acquisition, ultrapure water was recorded, under the same conditions, as a background, which was automatically subtracted from each sample spectra. Between each measurement, ethyl alcohol and warm water were used to clean the ATR cell using soft paper.
2.5. Biochemical Assessment
2.5.1. Extraction of Phenolic Compounds
In total, 2 g of seeds powder from pollinated and control samples was dissolved in 20 mL of methanol and ultrapure water (70 : 30, v/v) and then homogenized at 4°C for 15 min using an Ultra-Turrax homogenizer (IKA-Werke GmbH and Co., Staufen, Germany). Afterward, the mixture was centrifuged for 15 min at 4°C and 3000 ×g. For each sample, the supernatant was separated from the residue, which was subjected to a second extraction as described above and the supernatant was removed. Extracted supernatants were combined and then filtered using Whatman No. 1 filter paper.
2.5.2. Total Phenolics (TP)
Total phenolics were determined using Folin–Ciocalteu’s micro method [19]. Briefly, an aliquot of 40 μL of each sample extract or standard solution was mixed with 3.16 mL of ultrapure water and 200 μL of 20% sodium carbonate solution. After 30 min of incubation at 40°C, the mixture absorbance was measured at 765 nm. The analysis was performed in triplicate and gallic acid was used as the standard solution.
2.5.3. Total Flavonoids (TF)
A volume of 250 μL of samples extracts or standard solution was homogenized with 1250 μL of ultrapure water and 75 μL of NaNO2 solution (5%). The mixture was incubated for 6 min at room temperature and then 150 μl of 10% AlCl3.6H2O solution was added. After the second incubation of 5 min, 500 μL of 1 M NaOH solution was added to the mixture and then the final volume was made up to 2500 μL using ultrapure water. The absorbance against the blank was read at 510 nm. The results were expressed in terms of mg rutin equivalent (RE)/100 g seeds [20].
2.5.4. Total Anthocyanin (TA)
TA content was determined as g cyanidin-3-rutinoside (cy-3-r) equivalents per 100 g of seeds [22], as cy-3-r are the major anthocyanin compounds in figs [23].
2.5.5. Total Proanthocyanins (TPA)
TPA content was determined following the acid hydrolysis and color formation method described by Porter et al. [24] and expressed in mg cyanidin equivalent per 100 g seeds.
2.6. Oil Extraction
Oil extraction was performed following the ISO method 659 : 199 using Soxhlet extraction with n-hexane (99%) as a solvent, which was evaporated at 40°C using a Rotavapor after a cycle of 4 h [14]. The resulting oils were stored in a dark flask at 4°C until analysis.
2.7. Data Analysis
Data were verified for normality and homogeneity of variance before statistical processing to ensure the validity of chemometric analyses using SPSS software v27. Biochemical and ionomic data were subjected to analysis of variance (ANOVA) to inspect differences among fig seeds samples. FTIR data were also subjected to the standard normal variate (SNV) alongside multiplicative scattering correction (MSC) procedures. Corrected spectrum and the main area of vibration were plotted using OriginLab Pro. In the second step, FTIR and biochemical and ionomic data were separately subjected to principal component analysis (PCA) to determine the variables and spectral signatures most contributing to explaining the pollination effect and pollen source. Later, 2D scatter plots were drawn to display the classification pattern, as affected by pollination and pollen source, separately based on FTIR fingerprints and biochemical and ionomic data.
3. Results and Discussion
3.1. Oil Yield and Seeds Set
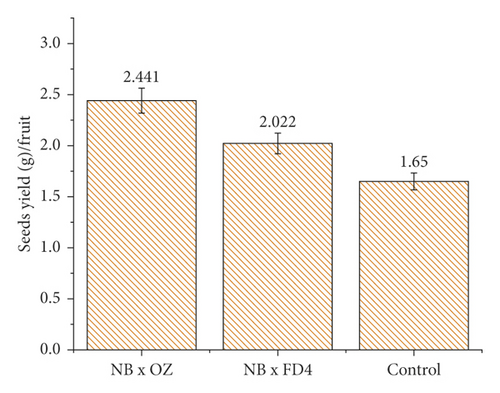
The weight of seeds per fruit displayed a significant impact of pollination and pollen, as it was higher in pollinated fig seeds than the control (unpollinated figs), with a substantial difference noticed based on the following profichi sources (Figure 1). Thus, fruits pollinated with “Frond d’Oued N° 4” (FD4) profichis exhibited the highest seeds yield per fruit (2.441 g), while it was 2.022 g in figs, which received “Ouzidane” (OZ) pollen. Unpollinated figs presented a very low seeds yield (1.65 g), which was about 1.48 and 1.22 times lower than the level recorded in figs pollinated by OZ and FD4, respectively. These results are due to the production of small empty seeds, as pollen is required for seeds sporophyte (embryo) development and subsequently its impact on the seeds loading and weight [25]. Thus, fig seeds are generally hollow unless they are successfully pollinated [14, 26]. This trait of hollowness seems to be common between the fig receptacle and unpollinated seeds. These seeds, especially pollinated ones, are well-known for their contribution to the fruit taste and flavor and antioxidant properties and dried ones to which pollinated seeds deliver the characteristic nutty taste [15, 26]. This close relationship between pollination and seed set has also been linked with the pollination intensity, as reported by [4], who found that sterile seeds are likely to be abundant as the pollination frequency is low. Similar results were reported on other trees such as apple [27, 28] and kiwi [29], where the absence of pollen leads to seed abortion.
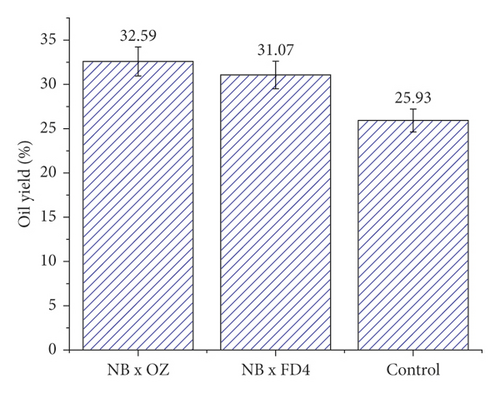
A similar effect pattern was observed on oil yield, which showed a significant sensibility to pollination and pollen sources. Thus, unfertilized seeds exhibited an oil yield of 25.93%, which is about 20% lower than the rate recorded by pollinated seeds (Figure 1). The pollen source also had a significant effect on this trait, which is quite similar to that on seeds loading. Indeed, seeds that received OZ pollen gave the highest oil yield (32.59%) compared to those pollinated by FD4 (31.07%). The effect of pollination on grain set and oil yield was also reported in several crop seeds species, including sunflower [30, 31], rapeseeds [32, 33], and soybean [34], where the simultaneous effects of pollen source and quality have enhanced seeds development and their oil content. Lately, more attention has been paid to the irradiation effect on pollen and seeds set in several species, such as pomelo [35], apple [36], and citrus [37], where irradiated pollen displayed a significant effect on seeds sets and that an increasing irradiation level showed a tendency to stimulate the parthenocarpy property in fruits.
3.2. Biochemical Attributes
The results of fig seeds biochemical attributes as affected by pollination and pollen source are summarized in Table 1. The pollination source significantly affected biochemical traits of “Nabout” fruits seeds (p < 0.05); hence, fertilized figs exhibited high levels of total phenolic content (TPC) compared to unfertilized samples (117.71 ± 10 mg GAE/100 g). Likewise, pollen sources displayed a significant effect on TPC; henceforward, they were higher in fig seeds fertilized with “Ouzidane” pollen (185.93 ± 8.21 mg GAE/100 g) than those pollinated with “Frond d’Oued N° 4” pollen (185.93 ± 8.21 mg GAE/100 g) (Table 1). Although little attention was paid to the pollination impact on total phenolics of fig seeds, this behavior was in agreement with a study conducted in Iran, where the interaction “pollen sources × female cultivars” showed a significant impact on the fruit total phenolics (Pourghayoumi et al., 2012). In the same way, Trad et al. [38] reported that caprification had a significant influence on fresh figs’ polyphenols composition. This result agrees with that of Rahemi et al. [3] and Pourghaymi et al. [12], who reported that the pollen source has a substantial effect on the fig biochemical traits alongside the fruit peel and pulp color. Some major phenolic compounds such as catechin, quercetin-3-glucoside, quercetin, and chlorogenic acid were also reported to be influenced by the pollination process and pollen source [12]. In fact, the caprifig pollen might probably present many differences following their origins, which drives their levels of carbohydrates, affecting the total phenolic compounds biosynthesis by transferring those carbohydrates supplements to the endosperm and embryo tissues, which are necessary as the precursors in phenolic compounds production [39]. This suggests that the biosynthesis of phenolic compounds occurs later after pollination and could be under the effect of caprification and pollen sources. However, higher TPC levels could be recorded without pollination, which could most likely be explained by physiological and environmental conditions during the fruit ripening period [38].
| Variables | NB x FD4 | NB x OZ | Control | ANOVA | ||
|---|---|---|---|---|---|---|
| Overall mean | Mean square | Sig. | ||||
| Total phenolics (mg GAE/100 g) | 176.64 ± 6.07 | 185.93 ± 8.21 | 117.71 ± 10 | 160.10 | 4105.99 | .000 |
| Total flavonoids (mg RE/100 g) | 53.38 ± 2.35 | 59.59 ± 0.55 | 41.36 ± 6.91 | 51.44 | 257.72 | .005 |
| Total anthocyans (mg cy-3-r/100 g) | 31.41 ± 6.61 | 48.77 ± 8.27 | 16.77 ± 0.23 | 32.32 | 770.16 | .002 |
| Total proanthocyanidins (mg cyan/100 g) | 3.91 ± 0.01 | 4.05 ± 0.02 | 3.87 ± 0 | 3.94 | .026 | .000 |
- NB: Nabout; FD4: Frond d’Oued N° 4; OZ: Ouzidane; ANOVA: analysis of variance; cyan: cyanidin; cy-3-r: cyanidin-3-rutinoside; GAE: gallic acid equivalent; QE: quercetin equivalent. Sig.: significance of ANOVA.
Total flavonoids content (TFC) displayed a similar pattern to TPC; hence, fertilized seeds recorded the highest levels compared to unfertilized ones (41.36 ± 6.91 mg CE/100 g). TFC was also sensitive to pollen source since, once again, seeds fertilized with OZ pollen exhibited higher levels in comparison to those pollinated with FD4 (59.59 ± 0.55 and 53.38 ± 2.35 mg CE/100 g, respectively). A similar effect has also been reported in Iranian dried figs varieties [38]. Undoubtedly, fig is a suitable example through which the relationship between pollination and major factors of quality has already been demonstrated [5, 40].
Effect of pollination and pollen source, separately and in combination of both, followed the same above-described pattern on total anthocyanins content (TAC), which is the main responsible for the fruit peel color [23, 41]. Unfertilized seeds showed the lowest TAC levels, 16.77 ± 0.23 mg cy-3-r/100 g, compared to pollinated ones, where the recorded levels were of 48.77 ± 8.27 and 31.41 ± 6.61 mg cy-3-r/100 g for pollen source of OZ and FD4 (Table 1). A similar tendency of pollen source effect on antioxidant capacity along with some phenolic components such as chlorogenic acid catechin, quercetin-3-glucoside, catechin, and quercetin was previously reported in dried figs belonging to “Payves” and “Sabz” cultivars growing in Kazerun, Iran [12]. This pattern has also been reported by Trad et al. [38], who examined the anthocyanins levels in ripened fresh figs and found that caprified syconium was richer in TAC compared to unfertilized ones. The effect of caprification on anthocyanins biosynthesis was indirectly interpreted by some authors (Sullivan, 1998; Nakajima et al., 2001), and it is associated with two different streams of chemical raw material in the cell. The first involves the shikimate pathway to produce the amino acid phenylalanine. The second produces three molecules of malonyl-CoA, a C3 unit from a C2 unit (acetyl-CoA) [38].
Once again, total proanthocyanidins content (TPAC) was higher in fertilized seeds compared to unfertilized ones, with a significant difference following the pollen sources (p < 0.05). Hence, TPAC was 3.87 mg cyanidin/100 g of seeds in control samples, whereas it was slightly higher in those fertilized with FD4 (3.91 ± 0.01 mg cyanidin/100 g) but greater in seeds pollinated with OZ caprifig pollen (4.05 ± 0.02 mg cyanidin/100 g). Obviously, very little data was found on the separate and simultaneous effect of pollination and pollen source on the fig seeds' biochemical traits. Therefore, the herein reported findings are very promising since fig seeds remain thus far the less studied part of the species and are being considered a novel source of fats and functional properties. Considering the efficiency of pollen source effect on above-described attributes of fig seeds, it seems that the use of caprifig “Ouzidane” as pollinator could be more appropriate to enhance fig seeds set, oil yield, and quality.
3.3. Mineral Content
Inorganic elements are remarkable constituents of figs; they play a vital role in biological systems and body development. However, minerals can have a toxic effect when their intake exceeds functional levels [42]. Several authors have reported the quantitative estimation of mineral element concentrations in the different parts of plants Ficus carica L., including leaves, aerial roots, and bark [43]; however, most studies have been performed on the whole fruit especially dried figs [42–46]. To the best of our knowledge, one report has mentioned mineral composition in fig seeds, one of the fig fruit parts responsible for beneficial health effects hitherto unknown. Results given in Table 2 summarize the separate and simultaneous influence of pollination and pollen source on the fig seed mineral contents. Overall, results showed that ten mineral elements were identified in fig seeds, among which N, Ca, P, and K were, in order of importance, the major elements, and showed in addition to proteins significant differences among samples. We also found minerals such as Na, Fe, Zn, Mn, Cu, and Mg, which did not display statistically significant differences among samples taking into consideration pollination and pollen source (p > 0.05). The mineral composition herein reported was similar to that of Nakilcioğlu [47]. Unexpectedly, concentrations in mineral elements were substantially lower in fertilized seeds compared to control samples. Only calcium (Ca) escaped to this rule, as it was higher in fertilized seeds with OZ pollen (8.16 ± 0.92 g/kg) compared to other samples, where recorded values were generally lower than 8 g/kg. It is noteworthy that the pollination impact revealed a clear pattern, while the pollen source did not display an obvious tendency, as the levels recorded in N (2.26 ± 0.06%) and Ca (8.16 ± 0.92 g/kg) were slightly higher in seeds pollinated by OZ, whereas the other mineral elements were somewhat greater in seeds fertilized with FD4 pollen. The highly significant impact of pollen source could be particularly noticed on several minerals, e.g., Fe, Zn, and Mn, which were higher in seeds fertilized by FD4 pollen and where values were of 94.23 ± 7.53, 20.13 ± 1.43, and 8.18 ± 0.78, respectively, while they were of 60.13 ± 29.33, 14.78 ± 12.43, and 6.58 ± 2.93, respectively, in seeds pollinated by OZ pollen. It seems that fig seeds’ mineral contents are proprietary dependent on pollination and then pollen source, which needs further investigation to be clearly stated. As no previous study has been interested in this aspect, these findings herein reported remain the first to mention the caprification effect on the mineral composition of fig seeds.
| Samples | NB x FD4 | NB x OZ | Control | ANOVA | ||
|---|---|---|---|---|---|---|
| Overall mean | Mean square | Sig. | ||||
| N (%) | 2.19 ± 0.02 | 2.26 ± 0.06 | 2.65 ± 0.11 | 2.37 | .180 | .001 |
| Proteins (%) | 13.69 ± 0.13 | 14.13 ± 0.39 | 16.54 ± 0.7 | 14.79 | 7.034 | .001 |
| P (g/kg) | 4.88 ± 0.23 | 4.41 ± 0.23 | 7.04 ± 0 | 5.44 | 5.868 | .000 |
| K (g/kg) | 3.6 ± 0.12 | 2.48 ± 0.04 | 4.42 ± 0.1 | 3.50 | 2.845 | .000 |
| Ca (g/kg) | 6.66 ± 0.74 | 8.16 ± 0.92 | 7.98 ± 0.38 | 7.60 | 2.012 | .081 |
| Na (g/kg) | 0.6 ± 0.16 | 0.6 ± 0.12 | 0.9 ± 0.02 | 0.70 | .090 | .030 |
| Fe (ppm) | 94.23 ± 7.53 | 60.13 ± 29.33 | 122.2 ± 3 | 92.18 | 2899.358 | .014 |
| Zn (ppm) | 20.13 ± 1.43 | 14.78 ± 12.43 | 17.65 ± 0.85 | 17.52 | 21.507 | .681 |
| Mn (ppm) | 8.18 ± 0.78 | 6.58 ± 2.93 | 8.48 ± 0.43 | 7.74 | 3.130 | .420 |
| Cu (ppm) | 24.43 ± 0.58 | 25.1 ± 2.8 | 26.73 ± 0.13 | 25.42 | 4.193 | .289 |
| Mg (ppm) | 713.5 ± 0.5 | 714 ± 13.5 | 715 ± 1 | 714.17 | 1.750 | .972 |
- NB : Nabout; FD4 : Frond d’Oued N° 4; OZ : Ouzidane; ANOVA: analysis of variance; N : nitrogen; P: phosphorus; K : potassium; Ca: calcium; Na : sodium; Fe : iron; Zn: zinc; Mn : manganese; Mg : magnesium; Cu: copper.
3.4. Impact of Pollination on the Correlations between Minerals and Phenolic Components
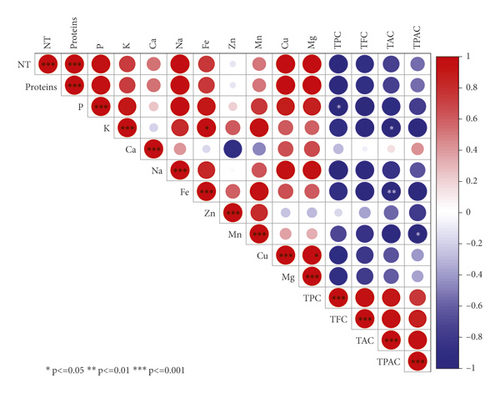
Heatmap correlation matrix shown in Figure 2 displays particularly strong correlations between minerals and phenolics components. In fact, all mineral elements showed strong negative correlations, with all phenolics components herein studied, with the exception of calcium, which showed a weak positive correlation with TPAC and TAC (r = 0.15 and r = 0.42, respectively) and a very weak negative correlation with TPC (r = -0.28). Similarly, zinc showed weak correlations with phenolic compounds, except with TAC and TPAC (r = -0.57 and -0.78, respectively). Similar patterns of correlations between phenolics and minerals were previously reported in several studies, where the increase in phenolic compounds is negatively associated with the minerals levels [48–50]. Based on the results described in the sections above, it was shown that pollination had a large size effect on the correlation between minerals and phenolics content. Hence, unfertilized seeds exhibited low phenolics components compared to pollinated ones but higher mineral elements level with only a single exception of Ca. Contrariwise, fertilized seeds displayed a low level of minerals compared to control, while they recorded high amounts of phenolics. This relationship pattern driven by pollination can be explained by the fact that those minerals are actively involved in activating phenolic compounds' biosynthesis [51]. This relationship was previously explained by the fact that minerals play a key role in providing cofactors for large varieties of enzymes involved in the phenylpropanoid and flavonoid pathways. Particularly, Fe, Mg, and Mn cations are essential for phenylalanine ammonia-lyase (PAL) activation, one of the key enzymes responsible for phenol biosynthesis [52, 53]. Furthermore, limited minerals supply is usually associated with phenolic accumulation. For instance, nitrogen deficiency is especially linked to higher phenolic levels. Finally, in plants, there is a general trend towards increased phenolics whensoever minerals availability is low [54, 55].
4. FTIR Signatures
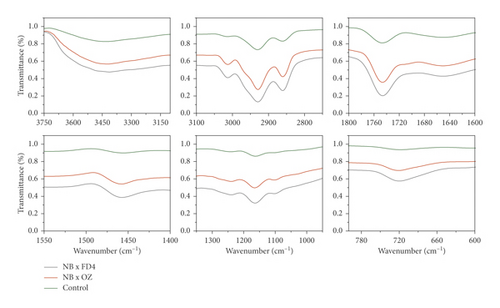
FTIR-ATR fingerprinting has proven itself as a powerful tool for chemical screening and discrimination purposes of biological samples. In the study of Hssaini et al. [15], this technique has provided a high throughput screening framework over the oil sample of fig seeds. In this work, FTIR was employed to determine fig seeds' molecular signatures and to investigate their sensitivity to pollination and pollen source separately and in combination of both. To this end, fertilized and control samples were scanned within a wave numbers interval of 4000 and 500 cm−1. Detailed band assignments are given in Table 3 revealing fifteen fingerprints represented in Figure 3. The influence of pollination and pollen sources separately and jointly was significant on samples' spectrum vibrational intensity (Figures 3 and 4). The first FTIR fingerprint appeared around 3411 cm−1 which would be assigned to O–H stretching vibration, most likely attributed to fibers, which have been reported to be present in large quantities in fig trees [15]. This flattened peak occurred within the vibration region of 3750 and 3100 cm-1 associated with the intramolecular hydrogen bond between C(3) OH⋯O(5) and C(6) O⋯O(2) H according to Schwanninger et al. [69] and Oh et al. [70]. The second peak occurred around 3071 cm−1, which is most likely assigned to C–H stretching of olefinic double bonds related to long carbon chains containing a relatively high number of CH2 groups of unsaturated fatty acids [57, 70–72]. The vibration around the wavenumber of 3013 cm−1 has been attributed to the symmetrical and asymmetrical stretching of C–H, O–H and NH3, which is probably typical to carboxylic acids, carbohydrates, and phenolic compounds [70, 71]. The sharp and distinct peak at 2928 cm−1 is due to the asymmetric and symmetric stretching of the aliphatic C–H in the –CH2 and terminal groups –CH3, respectively [58, 72]. The same goes for the peak that occurred at 2660 cm−1. The bands in the region between 1800 and 1700 cm−1 are ascribed to stretching of carbonyl groups and that of esters. This vibration region is related to the C=O extension of the carboxylic ester type. The sharp and acute peak at 1747 cm−1 is due to the stretching vibration of the C=O of the carbonyl groups belonging to the triacylglycerols. It is probably associated with the lipids and fatty acids contained in the seeds [70, 73]. Nevertheless, according to several authors, this peak could be attributed to proteins [59–61, 74]. Vibration within the wavenumber range of 1700 to 1550 cm−1 is possibly related to the amide I and II secondary structure of the protein. The peaks at 1652 cm−1 and 1544 cm−1 are attributed to the stretching vibration of the C–C group of the cis-alkene [62, 72]. The transmittance bands between 1500 and 1100 cm−1 would correspond to the phosphodiester groups and are probably the result of several weak peaks, which could not be differentiated in the samples analyzed according to several studies. The spectral band at 1457 cm−1 could probably be associated with the curvature of CH2 and the deformation of methylene of lipids, proteins, or cholesterol esters [59–61, 75]. The vibrations that occurred around 1386 cm−1 and 1239 cm−1 could probably be attributed to C–N elongation combined with N–H flexion and small vibrations of C–C elongation and C–O flexion in the plan. This group has been assigned to amides III [59–61, 76]. The band appearing at 1164 cm−1 was associated with the bending vibration of the C–O ester group [63–65, 72]. Approximately, a very weak vibration around 1102 cm−1 is most likely ascribed to a C–O stretch of methyl-carbon (polypeptides) [66]. Finally, the vibration around 720 cm−1 is probably assigned to C–OH group and C–C and C–O segments in the carbohydrate structure and C–O in the phenols [67]. The last region of vibration between 700 and 400 cm−1 shows a peak near 611 cm−1, which has been attributed to the overlap of the methylene (−CH2) vibrations and the out-of-plane vibrations of the C–H bonds of the cis-alkenes disubstituted [68, 73].
| Wavenumber (cm−1) | Functional group | Mode of vibration | Assignments | References |
|---|---|---|---|---|
| 3411 | δ(O–H) | Stretching vibration | Hydroxyl group | [56] |
| 3071 | ν(=C–H) | Bending vibration | Lipids | [57] |
| 3013 | δ(C–H), δ(N–H) | Stretching vibration | ||
| 2928 | δ (–CH2–), δ(–CH3) | Stretching vibration | Methylene and methyl groups (lignins, lipids) | [58] |
| 2660 | δ(C–H) | Stretching vibration | ||
| 1747 | δ(COH), δ(CCH), δ(OCH), ν(C–O) | Stretching and bending vibration | β-Sheet of amide I | [59–61] |
| 1652 | δ(N–H), ν(C–N) | Bending vibration | Amide II (α-helix) | [62] |
| 1544 | ||||
| 1457 | δ(C–H), δ(N–H), ν(C–H) | Stretching and bending vibration | β-Sheet of amide II | [59–61] |
| 1386 | ||||
| 1239 | δ(N–H), ν(C–H) | Stretching and bending vibration | β-Sheet of amide III | [59–61] |
| 1164 | δ(C–O), ν(C–C) | Bending vibration | Ester | [63–65] |
| 1102 | δ(C–O) | Stretching vibration | Methyl-carbon stretching (polypeptides) | [66] |
| 720 | δ(COH), δ(CCH), δ(OCH) | Stretching vibration | (Phenolics) | [67] |
| 611 | δ (C–H) | Stretching vibration | Out-of-plane bending vibrations | [68] |
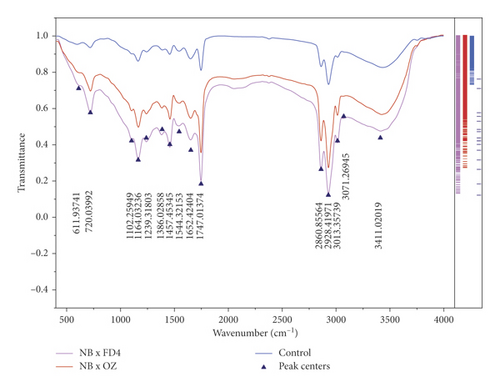
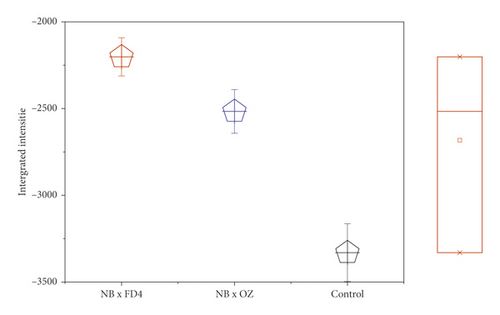
In order to visualize the pollination impact between the samples according to their vibrational intensities, the integrated intensities of the main peaks in the range 3500−1000 cm−1 were analyzed individually using the OriginLab Pro v9 software and a marginal plot (Figure 5). Thus, unfertilized seeds recorded a very low vibrational intensity within the entire wavenumber length, compared to pollinated seeds, which displayed a remarkable impact of the pollen source. Figure 4 displays the overall vibrational intensity of all samples’ spectrum, where the higher level was reordered by seeds fertilized with OZ pollen, followed by those pollinated by FD4 pollen and then the control. Although sometimes considered minor, these differences indicate the high impact of pollination and pollen source on the fig seeds' molecular signatures. Obviously, the results herein reported join those described above by displaying a similar pattern of pollination and pollen source impact on fig seeds set and quality, including phenolic compounds and minerals. Being a highly sensitive, nondestructive, fast, cost-effective, and safeguarding technique, FTIR fingerprinting seems highly accurate to assess fig seeds, especially with larger sample length.
5. Multivariate Analysis
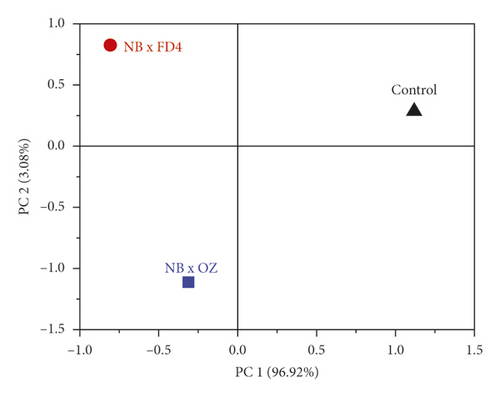
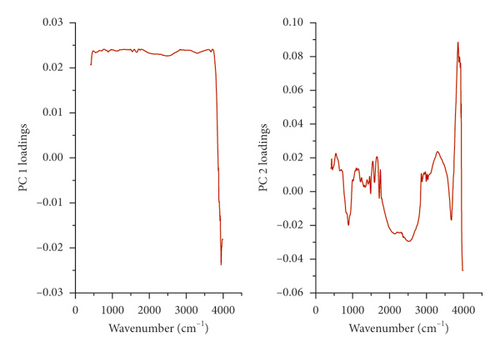
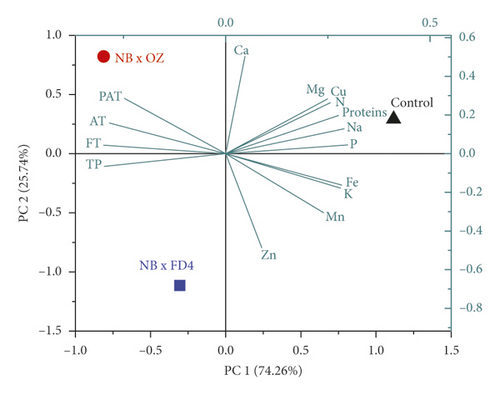
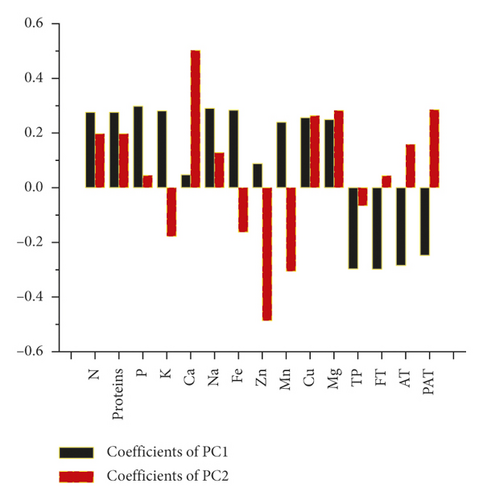
The principal components analysis (PCA) model was employed to reveal the separate and simultaneous impact of pollination and pollen source on the throughput resolution of fig seeds classification. Being an unsupervised learning approach, it was also used to verify whether FTIR-ATR spectrum data can provide a similar classification pattern as that of phenolic compounds and mineral composition, combined. Figure 6 shows two biplots constructed based on the first two PCA components of FTIR fingerprints (Figure 6(a)) and phenolics combined with minerals (Figure 6(c)). The figure also presents the loading plots displaying vibrational regions (Figure 6(b)) along with phenolic and ionomic variables (Figure 6(d)) contribution (weight) to the samples’ classifications. Both models exhibited high total variance, where all major infrared peaks previously described were dominated by lipids, amids, and phenols vibration signature, which displayed high loadings on biplot clustering. In PCA generated by phenolics and minerals data, Ca and Zn had the highest loadings value, which means that they were the main contributors in samples classification. It is noteworthy that Ca and Zn were negatively correlated and were the only elements that did not follow the negative association pattern between minerals and phenolics accumulation previously described as being driven by pollination and pollen source. This relationship pattern suggests that limited minerals supply is usually associated with phenolic accumulation. Outstandingly, both biplots displayed quite similar samples repartitions with high inertia rate showing thus a remarkable influence of pollination and pollen source, separately and simultaneously. This result makes sense due to the fact that FTIR-ATR fingerprinting is a highly accurate qualitative technique of which absorbances are proportionally linked to concentrations in bioactive molecules as the Lambert–Beer law stipulates [77]. Similar classification patterns using a comparable approach were recently used for the first time on fig seeds oil in order to determine whether vibrational spectroscopy can provide high throughput discrimination resolution of a minor vegetable source that is so far scarcely investigated [15].
6. Conclusion
Fig caprification symbolizes an outstanding mutualism between the species and its wasp pollinator. This unique coevolution has a substantial impact on fruit load and quality. However, very limited works have attempted to explore its impact on seeds’ set and quality. Perhaps, this is why those seeds are thus far the less studied part of the tree and their metabolites and nutraceutical attributes are barely known. This article attempts to answer the following question: do pollination and pollen source affect simultaneously or separately the fig seeds set and quality? The article uses an analytical approach scheme combining lipo-biochemical with ionomic analysis and FTIR-ATR fingerprinting. Results displayed a significant effect of caprification and pollen source on all the above-mentioned attributes. Minerals, except Ca and Zn, showed a decreased pattern in response to pollination, which is an opposed tendency to the seeds set, oil yield, and phenolic compounds, as they recorded higher levels in fertilized seeds. These patterns were explained by the fact that minerals are key factors in activating some enzymes accurately involved in phenols biosynthesis. Pollination and pollen source effects were also revealed using FTIR-ATR that showed two sharp and acute peaks around 2928 and 1747 cm−1, which were ascribed to CH2 and CH3 stretching in lipids and to C=O of carbonyl groups belonging to the triacylglycerols, respectively. Multivariate analysis of the above-described approaches showed identical classification of samples, suggesting that vibrational spectroscopy may be accurate, fast, and cost-effective to further investigate this effect on a large sample size. This first study does not answer all questions related to the caprification effect, but it obviously provides valuable data and opens up new possibilities for future directions for more understanding of the impact of the mutualism between fig and its wasp on seeds set and quality as being an atypical functional food.
Disclosure
This research did not receive any specific grant from funding agencies in the public, commercial, or not-for-profit sectors.
Conflicts of Interest
The authors declare no conflicts of interest.
Authors’ Contributions
Lahcen Hssaini conceptualized the study, developed the methodology, performed validation, performed formal analysis, performed investigation, provided the resources, performed data curation, wrote the original draft, reviewed and edited the article, performed visualization, and performed project administration. Ahmed Irchad contributed to visualization and data curation. Rachid Aboutayeb and Rachida Ouaabou conducted the formal analysis.
Acknowledgments
The authors are thankful to Zahra Oussi-Ali, Ali Hssaini, and Ihssane Ghendri for their help in achieving this work.
Open Research
Data Availability
The data used to support the findings of this study are available upon request from the corresponding author.


