Analysis of International Trade Competitiveness of Small Commodities Based on Numerical Simulation Algorithm
Abstract
In order to improve the analysis effect of the international trade competitiveness of small commodities, this study combines the digital simulation algorithm to analyze the competitiveness of international trade of small commodities and builds a competitiveness analysis model. Furthermore, this study summarizes several main factors that affect energy resolution, presents methods to provide energy resolution, and discusses methods for reducing noise from both analog and digital perspectives. In addition, this study gives the design principle and implementation method of the FIR digital filter, which provides theoretical support for digital signal processing design. Through the data analysis, it can be seen that the analysis model of the international trade competitiveness of small commodities based on the numerical simulation algorithm proposed in this study has a good performance in the analysis of the competitiveness of international trade of small commodities.
1. Introduction
Many of the export commodities in the small commodity market are foreign brands, and many production-oriented foreign trade enterprises still export by trade methods such as OEM and OEM, and lack the construction of their own brands. Moreover, for small commodity producers and operators, the use of ready-made export channels and well-known foreign brands is a shortcut to rapidly expanding exports. However, this expedient measure has deepened the dependence of export enterprises on foreign brands and their export channels, contributed to their inertia in opening up export channels and developing their own brands, and made Chinese enterprises become foreign brand processing and promotion bases [1]. Due to too much reliance on customers, not only the profit margin is low, but also the ability to deal with trade shocks is poor, and the competitiveness is low. Some export industries in the small commodity market, although their total sales account for a large proportion of the world, are often led by low-price strategies. Once the same product is affixed with a foreign brand, it can be sold at several times or even dozens of times the price. Today, with more and more emphasis on product quality and brand, products with low grades and poor brand utility will inevitably become the low end of the industrial chain, and will be in a very passive disadvantaged position in the increasingly fierce international competition. Various advantageous industries in the city have cultivated a number of leading enterprises in the industry, such as Langsha and Mengna socks, Xinguang jewelry, true love wool spinning, clockwise underwear, and Weihai zipper and several well-known enterprises. However, the proportion of famous brand enterprises is still small, and the international reputation is not high enough [2].
At present, export has become an important form of trade in the small commodity market, and most commodities in the market are oriented to export. Excessive foreign trade dependence makes foreign trade exports easily affected by the quality of foreign markets [3]. The financial crisis can attest to this. Affected by the world financial crisis, countries are not optimistic about the prospects for economic development, which has led to a decline in consumer confidence in purchasing, resulting in a decline in demand in foreign markets, especially in developed countries such as Europe and the United States. The impact is that the price of export products fell [4]. In the past 10 years, the export value of the small commodity market has grown rapidly, but the export has always been dominated by a few developed countries such as Europe and the United States. Excessive dependence on a few markets will inevitably limit the export growth of the small commodity market. Therefore, the export market diversification strategy has always been one of the basic strategies for foreign trade development [5]. In recent years, the development of emerging markets such as Africa, Oceania, and Latin America has been relatively fast, and exports to ASEAN have also increased rapidly. However, in general, the export market of small commodities is still relatively concentrated. In order to avoid dependence on a few countries and reduce export risks, the small commodity market must further develop the international market and promote the implementation of the strategy of export market diversification [6].
For a long time, price advantage and scale advantage are the key factors for the small commodity market to win in the competition. Small commodities attract numerous orders at home and abroad with their low prices and wide varieties. However, the extensive export method has great hidden risks, which is not conducive to the construction of the sustainable core competitiveness of small commodities and the sustainable development of the small commodity market. In fact, some restrictive factors affecting small profits but quick turnover in the small commodity market have been continuously highlighted and strengthened [7]. In the future, the small commodity market needs to realize the diversification of product grades, actively develop high-quality new products with high technology content, high added value and high market content, and enrich product structure and types. Small commodity producers and operators should carry out flexible production according to market information and can adjust their strategies and switch operations as soon as possible when the export of a class of products is constrained [8]. In addition, the small commodity market should further accelerate the implementation of the brand strategy, widely publicize and establish brand awareness, organize more enterprises to participate in the declaration and selection of various famous brands, and cultivate more export enterprises with independent brands and independent intellectual property rights. Enterprises should promote sales through the use of brand influence, strengthen export advantages by enhancing the inherent added value of products, and achieve the purpose of improving export quality, increasing export prices, and increasing export benefits, and realizing the growth from simple and extensive quantity to both quantity and benefit growth transformation. On the whole, China’s export market is still relatively concentrated [9]. Therefore, foreign trade enterprises should also diversify.
The monopoly advantage theory proposed by the literature [10] opened the prelude to the research on the internationalization of the economy. The theory of monopoly advantage holds that the monopoly advantages in all aspects of the enterprise make it enough to bear the extra cost of internationalization, and then carry out international expansion activities. Literature [11] breaks through the singleness of the “monopoly advantage theory” and proposes the “life cycle theory” of enterprise internationalization. It believes that changes in resource elements and costs at different stages will lead to changes in enterprise production and investment behavior. Complete path: In the stage of new products, the company produces domestically and makes profits by exporting; in the stage of mature products, the monopoly advantage of the company gradually disappears, and the company tends to invest in production internationally to reduce costs. In the stage of standardized products, the company loses its technological monopoly advantage and production. The activity is moved to the international low-cost area, and the import method is used to profit. Literature [12] believes that the internationalization of enterprises is gradual: the market scope of enterprises gradually expands geographically (regional market-national market-international market-global market); the business mode of enterprises gradually changes outward (domestic operation-international export-international terminal sales-international market). Based on the principle of the international division of labor, the literature [13] proposes the “marginal industry expansion theory”, arguing that the narrowing of the international technology gap expands the international comparative cost difference and induces the emergence of internationalization behavior of enterprises. The above theories of enterprise internationalization mainly study enterprise internationalization from the perspective of revenue enhancement, while the “internalization theory” based on transaction cost theory studies enterprise internationalization from the perspective of cost reduction. Literature [14] based on the transaction cost theory and assumed the premise of “market incompleteness”, researched and put forward the “internalization theory”, arguing that for the consideration of reducing costs through internalization methods, the internationalization of enterprises is a process that enterprises at the national level will use to reduce costs. A reasonable representation of the internalization of the trading market. Literature [15] proposes the “international production compromise theory”, which believes that the internationalization of enterprises is a combination of ownership advantages (production factor endowments, market information, and other advantages), internalization advantages (the ability to transfer and allocate ownership advantages internally) and It is a natural phenomenon of further export-oriented development after conditions such as location advantages (market environment, institutional advantages, etc.).
Different from the actual descriptive definition, the literature [16] analyzes and defines the professional market through the evolution model of general market transaction mode: the transaction organization that saves the transaction cost of the specific commodity market [17]. defines a professional market based on the system theory: through the collection and distribution of goods, price discovery, transaction settlement, information collection, distribution, etc., to small and medium-sized retailers and commodity consumers to sell specific types of commodities or several types of strongly complementary and alternative commodities, and provide special formats of technology and services related to transactions. Different professional market definitions have different perspectives and basis. The actual descriptive definition reflects the actual economic activities of the professional market, while the non-actual descriptive definition focuses on the deep-level professional market generation or operating mechanism. The core content of the professional market explained by the two is not contradictory and can be regarded as the traditional definition of the professional market. Under the new international economic situation, the professional market has undergone tremendous changes in terms of transaction methods and market players. Literature [18] pointed out that the major changes such as the diversification of market entities and the intangibility of transaction methods in the professional market make the traditional definition of the professional market no longer accurate and comprehensive, and a new definition that conforms to the new characteristics of the professional market should be adopted.
This study combines the digital simulation algorithm to analyze the competitiveness of international trade of small commodities to build a competitiveness analysis model to explore the development trend of international trade competition of small commodities.
2. Simulation Algorithms for Numerical Simulation
2.1. Noise Analysis and Analog Signal Processing
The causes of noise in electronic devices are complex and generally fall into three categories.
The first type is caused by the random thermal motion of carriers. This type of noise is called thermal noise. Thermal noise exists in most carrier devices, so any device with resistance has thermal noise.
The second type of noise exists in minority carrier conducting devices (such as vacuum tubes, PN junction reverse current, etc.), and both the generation of carriers and their recombination and disappearance during the movement process will affect the size of the device current. Moreover, the process of generation and recombination is random, which will cause the fluctuation of current, that is, noise. We call this type of noise as shot noise.
These two types of noise power spectral density are independent of frequency, called white noise.
The noise intensity is equal in every ten-octave frequency range, so this type of noise is mainly concentrated in the low-frequency band, so it is called low-frequency noise, also known as 1/f noise. 1/f noise can be suppressed in the system by suppressing the low-frequency response. Moreover, low-frequency noise is generally related to the process level of the system, and reducing this type of noise requires device selection.
-
is detector leakage current noise;
-
is the thermal noise of the bias resistor;
-
is the gate current noise of the FET;
-
is the thermal noise of the feedback resistor Rf;
-
is the thermal noise of the FET channel;
-
is the low frequency noise of the FET;
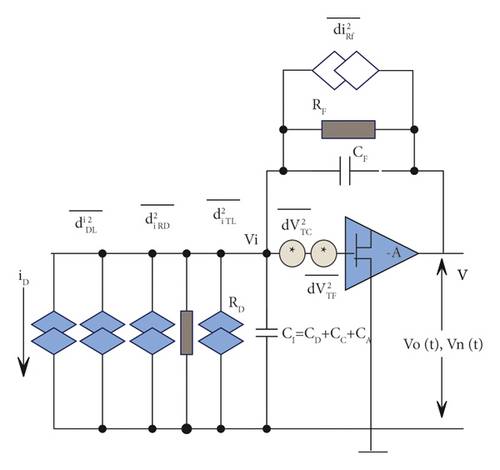
The size of ENV is determined by the noise power spectral density at the input end of the system and the frequency response of the system.
2.2. Analog Filter
The spectrum of the output signal of the charge-sensitive preamplifier is different from the power spectral density of the noise, so a suitable filtering system can be selected to maximize the signal-to-noise ratio to achieve the best filtering.
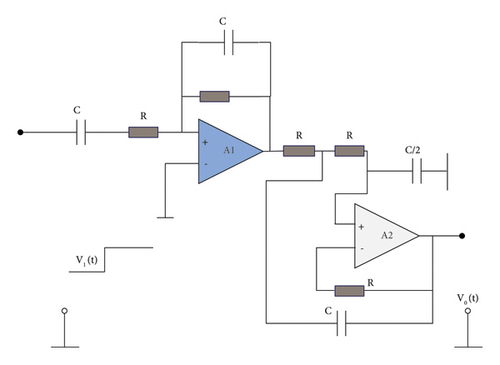
In the following, we take the active filter as an example to introduce the filtering principle of the analog filter.
Its performance is comparable to an CR − (RC)2 filter. In the circuit shown in Figure 2, the second circuit is the above-mentioned active filter, and the best filtering can be obtained when τ = 0.633τc is selected. Its inferiority coefficient is F = 1.164, which is close to the CR − (RC)4 quasi-Gaussian filter, and it uses only two amplification sections.
2.3. Signal Shaping
Filtering is to shape the output signal into a certain shape from the perspective of improving the signal-to-noise ratio, but in the energy spectrum measurement, other factors also put forward certain requirements on the signal shape. For example, to reduce the influence of accumulation and baseline fluctuation on the energy spectrum line, the signal width is required to be as narrow as possible, and the tail drag time is short. In order to reduce the influence of track loss, the top of the waveform is required to have a certain degree of flatness, etc. Next, we discuss the requirements for the shape of the output signal.
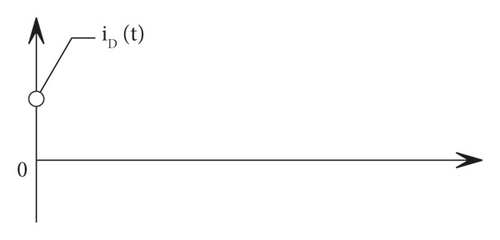
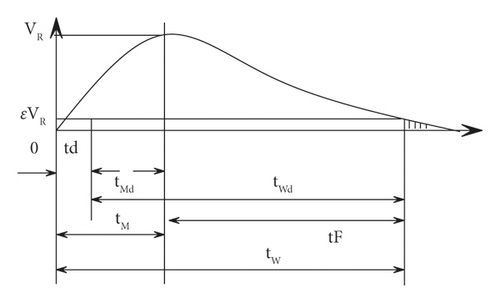
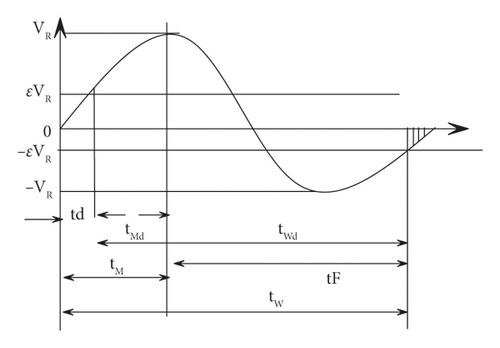
Figure 3 shows two output signals, (b) is a unipolar signal, (C) is a bipolar signal, the peak value of the signal is Vom, and the output signal tends to have a long tail. That is, it takes a very long time to reach the true zero value. Therefore, a certain value can be given, below which the signal is considered to have reached the “zero” value, or the signal is considered to belong to the residual part or tail after this value. This value can generally be determined according to the actual system accuracy requirements. This value is expressed in εVom, which is called the definition zero, and the ε value is small (1% or less).
-
td—is the delay time;
-
tm—is the time to peak, tmd = tm − td, and sometimes tmd is the time to peak;
-
tw—is the pulse width, tw = td + twd, and sometimes tw is the pulse width;
-
tF—the reset time;
-
tz—the zero-crossing time;
- (1)
The impulse response is finitely spaced in time, and the pulse width is narrow;
- (2)
There is no recoil at the tail;
- (3)
The top of the signal is relatively flat.
These requirements are put forward from different angles and sometimes contradict each other. Therefore, in the specific experiment, the requirements for the shape of the output signal should be put forward according to the actual situation. Commonly used forming circuits are pole-zero cancellation, CR − RCn and so on.
Before discussing discrete-time signal processing, let's look at some common assumptions. The sampling frequency is a fixed value fs, that is, the sampling interval is Tclk, which is also the most common representation of digital signal processing.
-
Tclk is the sampling period (Tclk = 1/fs);
-
fs is the sampling frequency (the angular frequency is ωs = 2πfs);
-
fN is the Nyquist frequency;
-
S(t) is the continuous-time signal system;
-
[k] is the discrete signal system;
-
Fs(ω) is the Fourier transform of the continuous-time signal S(t) in the frequency domain;
-
Zs(z) is the Z transform of the discrete signal S(k);
-
(f∗g)(t) is the convolution of functions f(t) and g(t).
2.4. Fourier Transform and z Transform
In general, Fs(ω) is a complex number.
The transform that transforms the time domain into the frequency domain is called the forward Fourier transform; and the transformation that transforms the frequency domain into the time domain is called the inverse Fourier transform. Fourier analysis provides a relatively complete method to obtain information in the frequency domain, which allows us to describe the vibration waveform in the time domain using frequency, amplitude and phase. If a waveform in the time domain rises faster, it means that the wave contains higher frequencies. The discrete Fourier transform is referred to as DFT, and the fast Fourier transform is referred to as FFT. Moreover, FFT is an important means used in discrete Fourier transform solutions.
-
Linear: F(af + bg) = aFf + bFg
-
Convolution:
-
Parseval theorem:
The input signal S(t) is defined as a finite bandwidth signal if there is |ω| > 2πfN such that Fs(ω) = 0, and fN is the Nyquist frequency of the signal.
For discrete signals of finite length s[k], S[k] ≠ 0 if and only if 0 ≤ k < N. The summation of (21) is limited to the sequence N, which is also limited.
Fast Fourier Transform (FFT) is a fast algorithm of discrete Fourier transform (DFT). It is obtained by improving the algorithm of discrete Fourier transform according to the odd, even, imaginary and real characteristics of discrete Fourier transform.
- (1)
The Z transform of a stable system has no poles in a unit period (|z|<1).
- (2)
The Z transform has mathematical properties similar to the Fourier transform.
- (3)
When a sequence S[k] is given, the delay is k0 cycles, and k0 is a positive integer, then:
2.5. Sampling and Antialiasing
The precision is sin c(x) = sin(πx)/πx.
When fN < fs/2, there is no overlap between adjacent frequency bands, and each frequency band can be completely separated from its adjacent frequency band without filtering.
When fN > fs/2, two adjacent frequency bands overlap, and each frequency band contains frequency information that the original signal does not have, this phenomenon becomes aliasing. We cannot recover the original signal from such sample points.
The front edge of the signal output from the preamplifier is generally very fast, with strong high-frequency components. It is not suitable to be used due to technical considerations. After the sampling frequency of the ADC has been determined, only by performing (linear) filtering on the signal output by the preamplifier to limit the high-frequency components and make the upper limit frequency of the signal less than half of the sampling frequency, aliasing will not be caused. This filter is called an anti-aliasing filter, which is a low-pass filter. The choice of performance and complexity of the anti-aliasing filter is specific to the experimental system. The most commonly used anti-aliasing filters are Bessel filter, Chebyshev filter, and Butterworth filter.
3. Competitiveness Analysis Model Based on Digital Technology
The schematic diagram of the structure of the real-time processing digitized spectrometer designed in this paper is shown in Figure 4. The system uses a 40MSP/S 12 bit ADC for digitization, which is triggered based on an event.
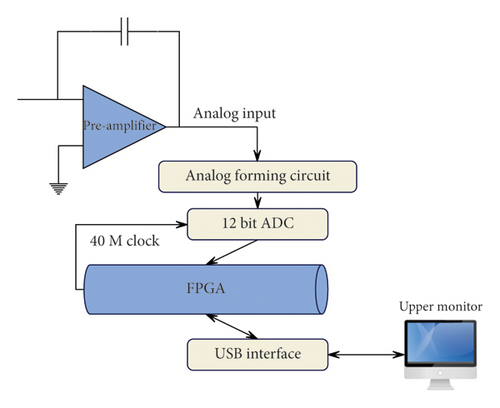
This study uses a second-order active anti-aliasing filter whose circuit is shown in Figure 5, with two isolated op amps at both ends. Because the input range of the ADC is 0–2 V, in order to prevent the negative noise signal from affecting the ADC signal output, a 200 mV DC offset is added to the output of the anti-aliasing circuit.

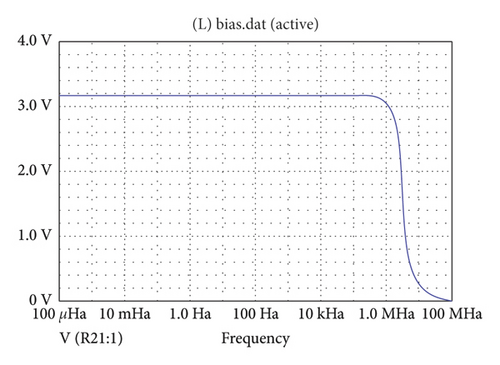
The filter formed by connecting the RC network in the feedback loop of the amplifier is called an active filter. The advantage of using an active filter is that multiple integrals can be formed with fewer components, and a conjugate complex pole can be obtained to improve the filter's transfer function. The frequency response curve of the filter is shown in Figure 6:
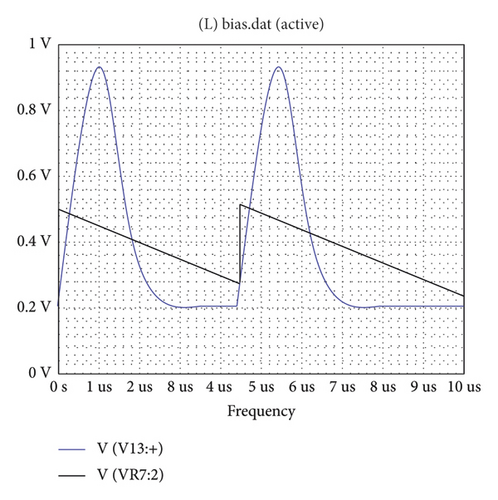
The time domain simulation of the front-end analog circuit of the digital nuclear spectrometer is shown in Figure 7:
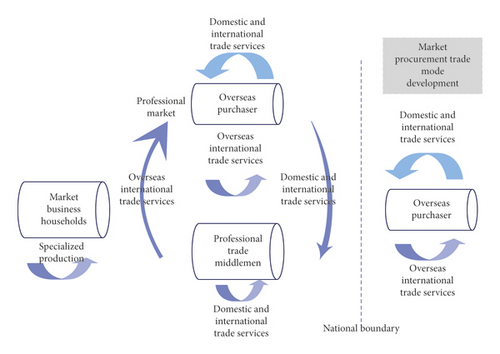
The professional market division of labor and cooperation system is gradually extended to inter-regional and is suitable for the establishment of a trading system for international trade. The reform of trade policy and trade system has promoted the substantial improvement of endogenous transaction efficiency and endogenous production efficiency, thereby accelerating the gathering of professional trade intermediaries and overseas buyers in specialized markets, and promoting the deepening of trade division of labor. Moreover, it strengthens the cooperation between overseas buyers and professional trade intermediaries, and professional trade intermediaries focus on the provision of domestic international trade services. However, due to the restrictions of the trading system and information technology, overseas buyers still need to undertake some domestic international trade services by themselves. During this stage, market operators still specialize in production and design, and professional trade intermediaries focus on domestic and international trade services. Moreover, overseas buyers are mainly responsible for overseas international trade services, but they cannot carry out fully specialized production. The market procurement trade method has basically developed in the professional market. Figure 8 shows the development period model of the procurement and trade mode of the small commodity market.
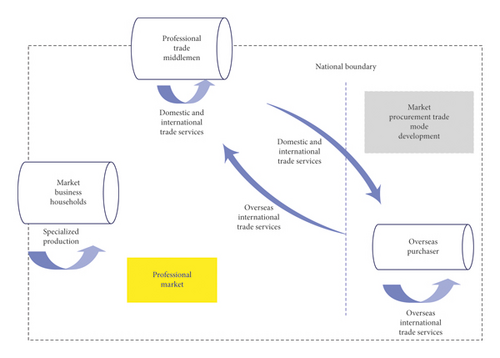
The improvement of electronic information technology has promoted the emergence of cross-border e-commerce platforms, an emerging professional trade intermediary. This has led to the fact that overseas buyers can fully focus on overseas international trade services, which has transformed into an economic embedding in the professional market, thus promoting the division of trade into a stage of complete division of labor. Market operators specialize in product production and design, while professional trade intermediaries focus on domestic and international trade services. However, overseas buyers focus on overseas international trade services, and the market procurement trade mode has also entered the development stage of formal formation. Figure 9 shows the formative period model of the small commodity market procurement trade mode.
Based on the above analysis, this study studies the effect of this model on the analysis of the competitiveness of international trade of small commodities. Based on the historical data of the past 20 years, this study makes a prediction and analysis of the competitiveness of small commodity trade in this model, compares the prediction results with the standard results, counts the prediction accuracy, and obtains the results shown in Table 1.
| Num | Competitive analysis | Num | Competitive analysis |
|---|---|---|---|
| 1 | 82.73 | 16 | 83.15 |
| 2 | 81.48 | 17 | 80.55 |
| 3 | 80.53 | 18 | 83.19 |
| 4 | 80.12 | 19 | 82.79 |
| 5 | 81.28 | 20 | 82.45 |
| 6 | 80.08 | 21 | 81.79 |
| 7 | 80.82 | 22 | 80.48 |
| 8 | 83.25 | 23 | 83.68 |
| 9 | 82.24 | 24 | 80.70 |
| 10 | 81.73 | 25 | 81.34 |
| 11 | 82.63 | 26 | 82.97 |
| 12 | 80.34 | 27 | 82.55 |
| 13 | 81.79 | 28 | 79.56 |
| 14 | 83.09 | 29 | 80.41 |
| 15 | 80.97 | 30 | 83.03 |
From the above data, it can be seen that the analysis model of the international trade competitiveness of small commodities based on the numerical simulation algorithm proposed in this study has a good performance in the analysis of the competitiveness of international trade of small commodities.
4. Conclusion
The extensive export trade growth mode is mainly reflected in the low price to win, quantity expansion, lack of independent brands, and so on. The export products of the small commodity market are mainly labor-intensive products with low technology, low added value, and low processing degree, which are at the low end of the industrial chain. Therefore, small commodity producers and operators adopt the trading strategy of quantity expansion and low prices to achieve small profits but quick turnover. Meanwhile, due to only relying on price advantages, focusing solely on quantity expansion, not focusing on the technical content of products, and not creating competitive advantages in terms of cost, quality, and brand, the export efficiency of products in the small commodity market is low. This study combines the digital simulation algorithm to analyze the competitiveness of international trade of small commodities and builds a competitiveness analysis model. Through the data analysis, it can be seen that the analysis model of the international trade competitiveness of small commodities based on the numerical simulation algorithm proposed in this study has a good performance in the analysis of the competitiveness of international trade of small commodities.
Conflicts of Interest
The authors declare no conflicts of interest.
Open Research
Data Availability
The labeled dataset used to support the findings of this study are available from the corresponding author upon request.


